However, when electrical current density is increased at a very high rate, the amount of iron in the separated sludge is increased at a high rate. Agricultural and industrial activities are probably effective factors causing an increase in the V concentration of the region. The direction of the dominant wind influenced the distribution of Vanadium in the high concentration location in the study area.
Geochemical processes affecting groundwater chemistry in Khosh_yailagh carbonate formation, north of Iran
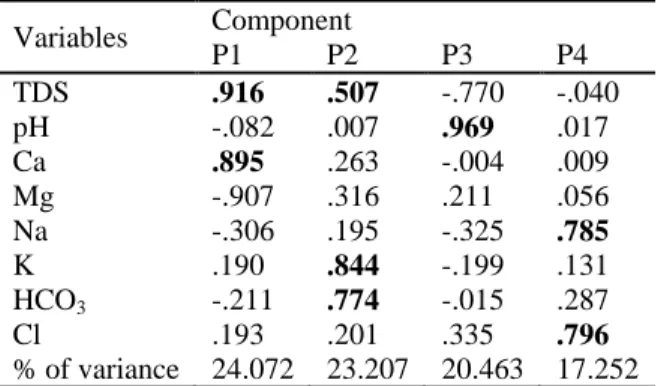
Most measured parameters showed weak correlation, which is the evidence of the effects of different processes in the water chemistry. Factor analysis was used to identify the dominant processes controlling the main chemical components of the groundwater. Ion exchange reactions occur in both positive and negative directions depending on the flow distribution and mixing of groundwater.
To understand the dominant lithology of the environment in which water flows, the. Saturation indices of calcite, dolomite and gypsum indicate that groundwater does not participate in chemical evolution. The processes that determine changes in groundwater composition, as interpreted from the factor analysis, are largely determined.
The dissolution and precipitation of carbonate minerals is a major factor controlling groundwater chemistry in the study area. Rainwater, which is charged with both biogenic and atmospheric CO2, is another component that determines the groundwater chemistry in the recharge area.
Treatment of soil contaminated with petroleum compounds using stabilization/ solidification method
Case study: Salafchegan Industrial Estate)
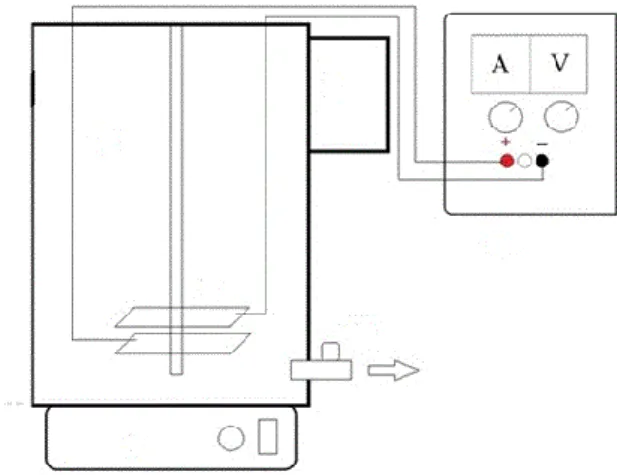
In addition, the 3050 B method (EPA) was applied to analyze the heavy metals present in the mixed sample of the contaminated soil from the site. A compressive strength apparatus was used in the laboratory of the University of Qom to test the strength of the solidified samples of the contaminated soil. The samples on which this experiment was conducted include the solidified samples of the oil hydrocarbon contaminated soil with a curing time of 28 days.
Atterberg soil limits (liquid limit and plastic limit) according to the ASTM D4318 method - soil pH according to ASTM D4972. In addition, for information regarding the chemical properties of the modified clay (a type of modified montmorillonite), a modified soil commercially named Clayton R40 was used in which a quaternary ammonium salt called dimethyl di(hydrogenated) tallow was used to modify this clay on a sheet basis with technical information provided by the manufacturer (South Clay Products Company, Table 1). For solidification and stabilization of soil contaminated with petroleum hydrocarbons, 16 samples (from the prepared compound sample) were mixed with different compositions of cement, quicklime and modified clay soil.
The free push resistance tests show that the addition of clay will increase the resistance of the samples. In general, it can be concluded that the use of modified clay in improving the efficiency of the stabilization and solidification process is positive in the stabilization of oil hydrocarbons and heavy metals in the contaminated soil of the site.
Investigation and simulation of upper-Gotvand dam challenge and management solutions
Salinity sources were placed at the exact location of salt formations in reality to consider dissolution of these formations in the model. The dissolution of salt formations in the dam reservoir is a complicated and non-linear phenomenon, which is due to the effect of several factors, such as different water levels in the reservoir, reservoir hydrodynamics, salinity gradient and temperature, etc. Here, a 3D numerical simulation was carried out. implemented for accurate prediction of reservoir water quality conditions with respect to time, in the interaction of salt formations and salinity/thermal stratification in the dam reservoir obtained.
The most effective factor in the dissolution rate variations is variations in the hydrodynamics of the flow in the dam reservoir, due to the three directional variations at different stages of impoundment, resulting in different dissolution rates. Also, the thermal stratification results of the Upper Gotvand reservoir indicate that due to the extreme temperature variation at the reservoir location and due to the highly variable salinity at different depths of the reservoir, there are different patterns of stratification cycle and tilt . Another important point is that at the time of the simulation, assuming an equilibrium dissolution rate of 0.5 cm per hour and taking into account the imported salinity of the upstream boundary and the saline rivers leading to the reservoir, the amount of salt accumulation in the reservoir will amount to 875 kg. /s, where its discharge failed, resulting in a severe salinity gradient and serious challenges for the Upper Gotvand Dam.
Discharge of accumulated salt by downstream outflow can prevent salt accumulation in the reservoir, so the amount of flow discharge and corresponding salt concentrations have been proposed. As a solution, the discharge of salinity can be carried out in the non-cultivating seasons and according to the associated standards that require further investigations at downstream.
Making the soundscape map of the city using the grounded theory and Nvivo application (Case study: the District 12 of Tehran)
Mapping the city's soundscape using grounded theory and Nvivo application (Case study: District 12 of Tehran). Initially, those sounds were considered likely that one might generally expect irritation from them, but they are considered an integral part of the soundscape. In contrast, very few people have been used in the study of urban parks for this purpose.
The range of soundscape changes is "loud but acceptable", "loud but unacceptable", "quiet and acceptable" and "quiet but horrible visual". The most important sounds that can be heard from the city are unpleasant sounds such as the sound of traffic, construction, road factories and repair shops, the loud music of neighbors, noises, etc. Here, the main question would be "how to apply the results of the soundscape design assessment and urban planning in the area to be used?" Since urban planning based on location information, the use of GIS are different models for the future, proper planning with the aim of improving the environment. In this regard, the researcher stated that the method can be combined with a clear map to show different aspects of the same soundscape.
In order to define the existing sonotopes, the expected hearing modes of the users should be taken into account regarding the respective locations. Nowadays, the common method of describing the acoustic fields for one or more acoustic sources for planning or understanding is often limited to the sound intensity characteristic.
Analyzing land use change trends and socio-economic driving forces of land degradation in Arasbaran Biosphere Reserve
Analysis of Land Use Change Trends and Socio-Economic Drivers of Land Degradation in the Arasbaran Biosphere Reserve. Vahid Amini Parsa., et al. i.e. from forest to rangeland and residential areas, rangeland to agriculture and residential areas and agriculture to bare land) is considered as land degradation in this study. Temporal relationship between the aforementioned socio-economic factors for 73 villages within the study area with land degradation, analyzed using a multivariate regression model.
The amount of land degradation was about 7868.43 ha during the first period and 12952.35 ha experienced land degradation in the second period. Land degradation within the 5 km buffer of the center of each village for the entire time period was also calculated. The remaining variables analyzed through the multivariate regression method and projecting land degradation models with respect to socio-economic variables were obtained (Eq.
Modeling the socio-economic variable of LULCC at the local scale shows that three of the factors studied (population, labor force, growth rate of family size) were significant. The resulting model that predicts land degradation based on socio-economic variables can be used to determine the amount of LULCC in an area that is indirectly related to independent variables.
Environmental effect assessment using ecological footprint method (Case study: Energy Engineering Department of Sharif University of Technology)
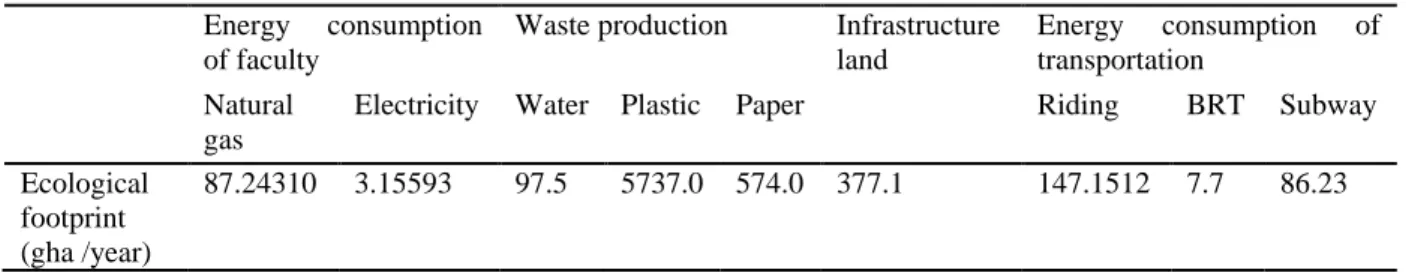
Indirect effects are the results of consumption of materials or energy at a site other than the site of the faculty. Finally, the total ecological footprint of the faculty is obtained from the sum of the above cases. According to the results, most of the ecological footprint is caused by energy consumption in the department.
To assess the potential of reducing the ecological footprint, the ecological footprint of the faculty's electricity and gas consumption is calculated based on the global average values for electricity and gas consumption per capita in two scenarios. In scenario 1, to calculate the total energy consumption of the faculty, gas consumption is calculated by assuming the global gas consumption per capita and adding it to the current electricity consumption of the faculty. In scenario 2, electricity consumption is calculated by assuming the global electricity consumption per capita and adding it to the current gas consumption of the faculty.
According to the results, the ecological footprint caused by the faculty's energy consumption in scenarios 1 and 2 will be reduced by 14.3% and 20.7% respectively. The majority of transport's ecological footprint is related to private cars, which have higher fuel consumption per
Environmental Kuznets Curve Test in Iran and OPEC Countries: A generalized method of moments approach
The Environmental Kuznets Curve was studied in Iran and OPEC countries using the Generalized Method of Moments for the period 1992-2013. In fact, during the process of economic growth in these countries, the amount of carbon dioxide emissions has been continuously increasing. Increasing urbanization, population growth, energy consumption and real GDP had a positive and significant impact on emissions in these countries.
These countries include Angola, Ecuador, Nigeria, Libya, Iraq, Iran, United Arab Emirates, Saudi Arabia, Venezuela, Algeria, Qatar and Kuwait. The dirt road of these countries is still a rapidly rising curve that has not yet been agreed upon. These countries, including Iran, have not yet achieved the level of economic growth that the Kuznets curve confirmed for them in inverted U-shape.
The pollution path of these countries is still rising rapidly and there is no return to the Curve Return Point. It indicates an increase in the consumption of energy carriers with more pollution and expresses the undesirable energy use and low technology in these countries.
Assessment and ranking of urban districts to refer ecological quality of urban green spaces using TOPSIS method (Case study: Urban districts of
Assessment and ranking of urban districts to refer the ecological quality of urban green spaces using TOPSIS method (Case study: Urban districts of.
Mashhad)
Due to the physical development of Meshhad in most areas, the urban green spaces have been replaced by different buildings, so it is necessary to study the urban green spaces in terms of quality. Based on the divisions of Mashhad Municipality, it has 13 regions, each of them has different surface area, population and types and conditions of green spaces. To obtain a green space distribution map, the NDVI map was corrected and georeferenced by Arc GIS 10.
TOPSIS tries to show the best alternative that simultaneously has the shortest distance from the positive ideal solution and the furthest distance from the negative ideal solution. The ideal positive solution consists of all the best attainable values of the criteria, while the ideal negative solution consists of all the worst attainable values of the criteria. The results show that Mashhad's green spaces do not have adequate relative frequency and parts of green spaces have undesirable conditions in terms of composition and spatial configuration.
There is no adequate distribution of green areas in other parts of the city; patches of green areas are unevenly and heterogeneously distributed. Classification of ecological urban areas is done with TOPSIS. The results of this study showed that the highest quality ecological zone is 5, and zone 12 has the most undesirable ecological quality.
The measurement of the spatial coefficient acoustic comfort in the metropolitan of Ahvaz