This enables the first understanding of the elemental abundance distribution of nearby M dwarfs as promising planet host candidates. The future extension of the analysis to all the targets of the IRD-SSP and other planet search projects around M dwarfs will lead to a further understanding of the abundance distribution of M dwarfs.
M dwarfs as planet-search targets
Chemical composition of M dwarfs
It is naturally explained by planet formation scenarios based on planetesimal accretion (e.g., Fortney et al., 2013). Welbanks et al. (2019) used the individual element abundances of FGK host stars based on high-resolution spectroscopy for eight of the 19 objects, while those of the other objects were approximated by scaling the solar element abundance model by their total metallicity [Fe /H] or [M/H].
M dwarf in the Galaxy
Previous determinations of M dwarf chemistry
Bonfils et al. (2005) first derived the relationship between band size, color and metallicity for M dwarfs. Hejazi et al. (2020) determined the [M/H] and [𝛼/Fe] of 1544 M dwarfs with high proper motion, fitting the template to the medium-resolution visible spectra.
Goal of the thesis
We need a method of determining abundances for M dwarfs that is based on model atmospheres but also consistent with the expected uniformity of abundances in binary systems. We describe how we use them to derive element abundances and individual errors in Section 2.3 and present the results in Section 2.4.
Target selection and data
The chemical composition of M dwarfs and its effects on the spectra cannot be accurately described by the overall metallicity scaled by the solar chemical composition alone. The spectra were Doppler-shifted to the stellar rest frame based on the radial velocity estimated by cross-correlation with the model spectra calculated from the atomic line data.
Abundance analysis
- Stellar parameters
- Synthetic spectra
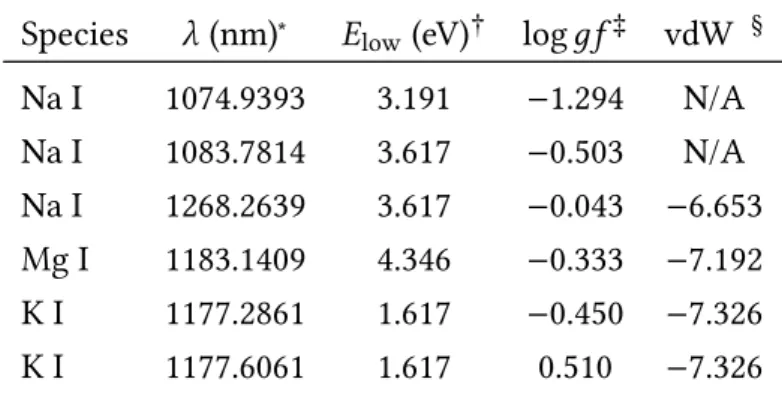
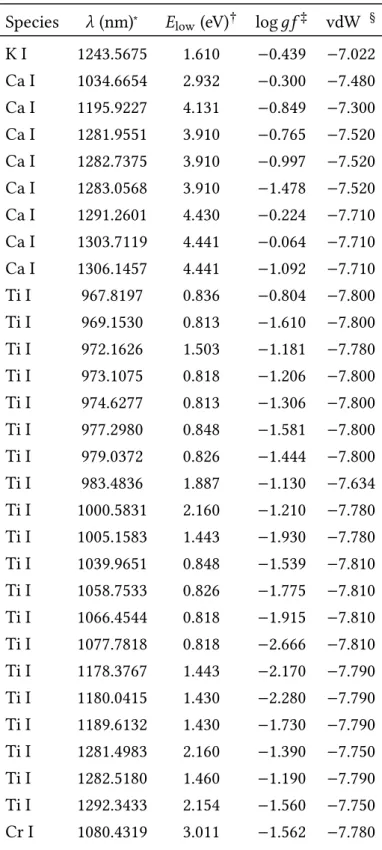
- Spectral lines
- Equivalent width measurement
- Abundance determination
- Error estimation
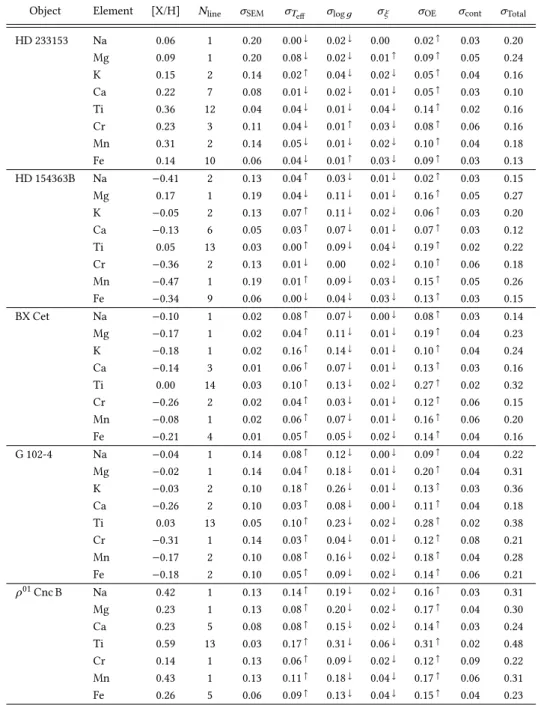
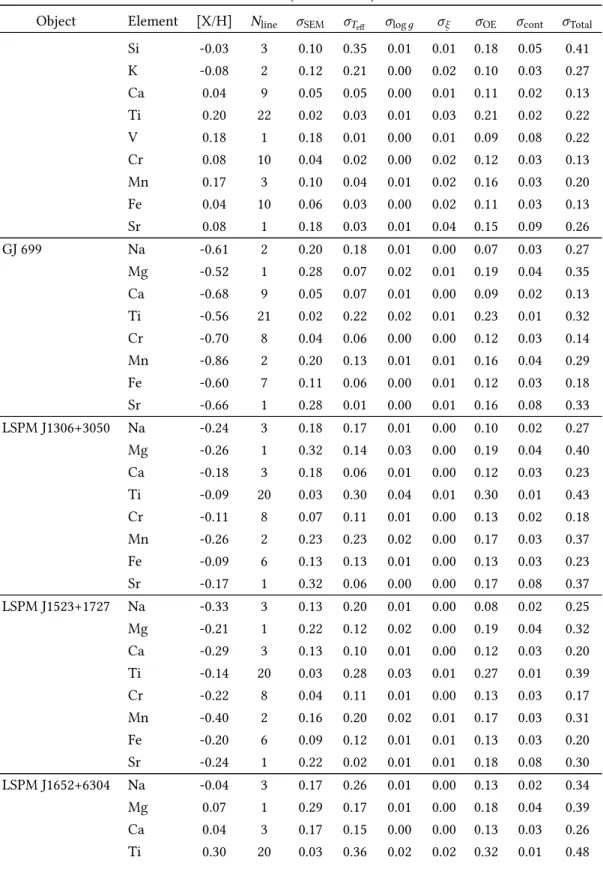
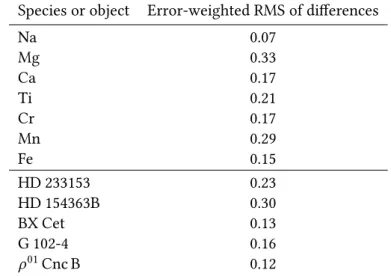
Note that we give the metallicities of the primaries in the table for comparison only. These are estimated as standard error of the mean (SEM) by dividing the standard deviation of the [X/H] obtained from individual absorption lines by the square root of the number of absorption lines used in the analysis (𝑁line).
Results
Contributions of individual error sources
For errors caused by the uncertainty of the stars' parameters (𝜎𝑇 . eff,𝜎log𝑔, and𝜎𝜉 and𝜎OE), those marked with ↑ show an upward change in the results as the parameters increase. The total errors on [Ti/H] for all three mid-M dwarfs are greater than 0.3 dex.
Consistency check with G/K-type primaries
The colored filled circles represent the abundances of M-dwarf seconds we determined, and the open black circles (horizontally shifted for clarity) represent those of the G/K-type primaries reported by Montes et al. (2018). Note that the error bars for the primary abundances reported by Mon18 contain only the row-to-row distributions divided by the square root of the number of spectral lines used in the analysis.
![Figure 2.4: Abundance ratios [X/H] of individual elements for each binary pair as a function of atomic number](https://thumb-ap.123doks.com/thumbv2/123deta/10550785.0/41.892.278.618.168.1003/figure-abundance-ratios-individual-elements-binary-function-atomic.webp)
Discussion
Sensitivity of line strength to abundances of elements other
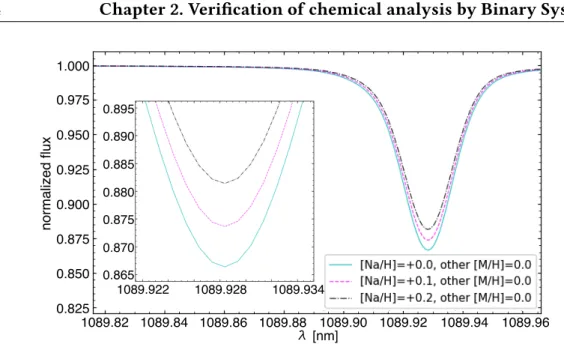
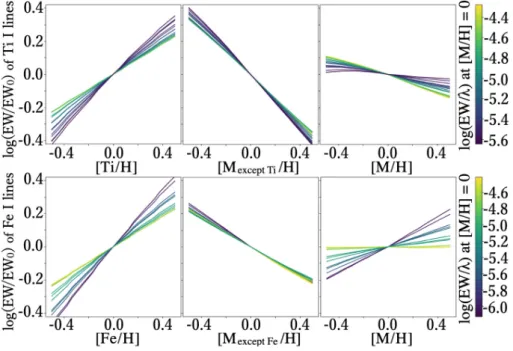
The legend in the upper left corner shows log(EW0/𝜆), i.e. the logarithmic EW normalized by the wavelength in the case of [M/H] = 0.0. We found that the low sensitivity of the absorption lines to the total metallicity is attributed to the influence of elements other than the species responsible for the absorption. This is due to the sensitivity of the abundance results of Na, Mg and Ca, which are obtained from large lines, to the change in log𝑔.
The vertical axis shows the ratio of the partial pressure of the single ionized species to the total pressure of the gas.
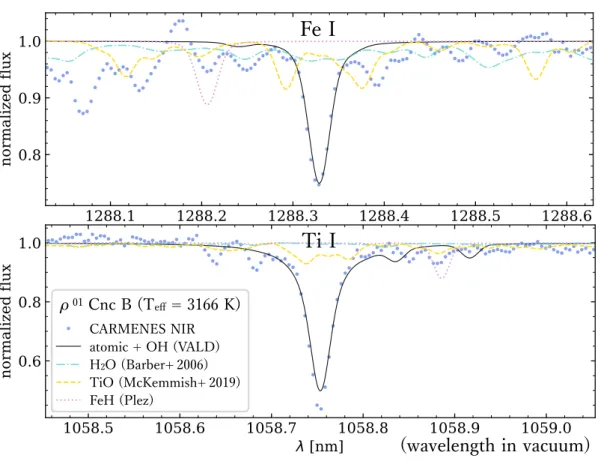
Titanium lines
2.8, but for the amount of oxygen [O/H] in the left panel, and for the amount of oxygen and carbon [O, C/H] in the right panel. This indicates that the unique behavior of Ti I lines is not due to the specific nature of the spectral lines. We conclude that the dominant cause of the unique response of Ti I lines to changes in overall metallicity is the consumption of neutral Ti atoms by the formation of TiO molecules.
Because the atmospheric temperature of M dwarfs corresponds to the temperature range in which these transitions occur, the changes in the ionization state of Ti complicate the interpretation of the Ti I lines.
HD 154363B
Both are consistent with our Fe abundance of HD 154363B rather than its primary as reported by Mon18. Although the reason for the discrepancy between our result for HD154363B and that of Mon18 for the main star is not clear, we consider our abundance results for this M dwarf to be reliable from the above inspection.
Summary
These results indicate that to constrain the true abundance of any element or even the overall metallicity, it is essential to determine the consistent abundance ratios of individual elements in the chemical analysis of each M dwarf. Applying our chemical analysis to the M dwarfs observed by the planet search projects will provide reliable and consistent abundance ratios on a larger sample of nearby M dwarfs than ever before. This information will be useful for the observational understanding of how the occurrence rate and characteristics of planets depend on the elemental abundances of the host M dwarfs.
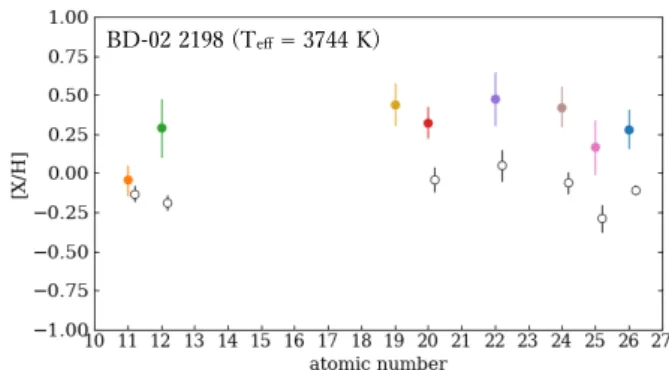
Chapter Appendix: Exclusion of BD-02 2198
The results of our abundance analysis on BD-02 2198 show an offset larger than the margin of error for the abundances of HD 61606 A reported by Mon18, as seen in Fig.2.11. The main purpose of the instrument is the planet search around nearby mid-M to late-M dwarfs (spectral type later than M4V). The research project has been running since February 2019 within the framework of the Subaru Strategic Program (IRD-SSP).
In addition, knowledge of the elemental abundances of the IRD-SSP targets will be necessary to discuss the characteristics of the planets to be discovered in the project.
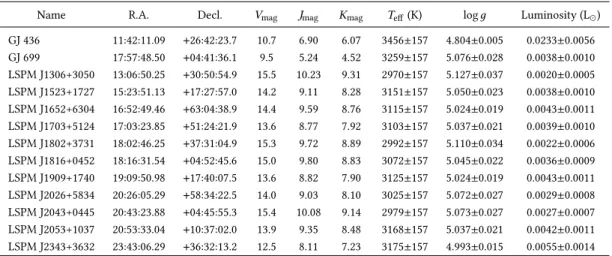
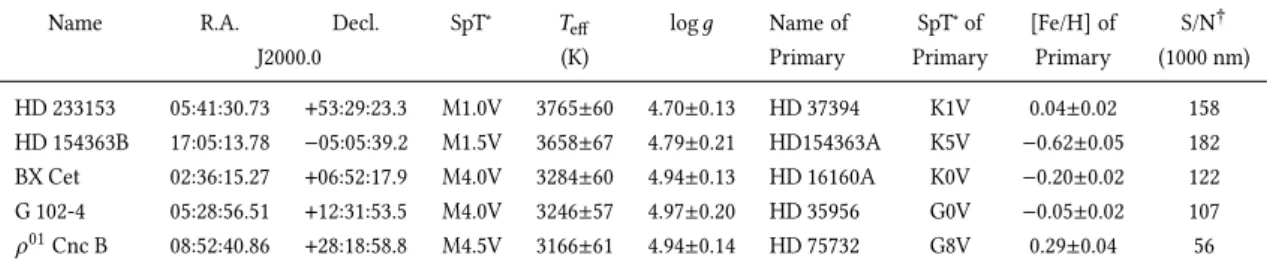
Targets and data
This allows us to understand the abundance distribution of stellar elements in the solar vicinity, because M dwarfs make up more than 70% of nearby stars. To understand the basic feature of our sample, we mention here the purposive selection of IRD-SSP. By the start of the project, 150 objects have been selected in the catalog of IRD entries.
Therefore, we do not consider the influence of magnetic field and activity in the analysis in this chapter.
Analysis
- Stellar parameters
- Effective temperature from FeH lines
- Equivalent width measurement
- Kinematics
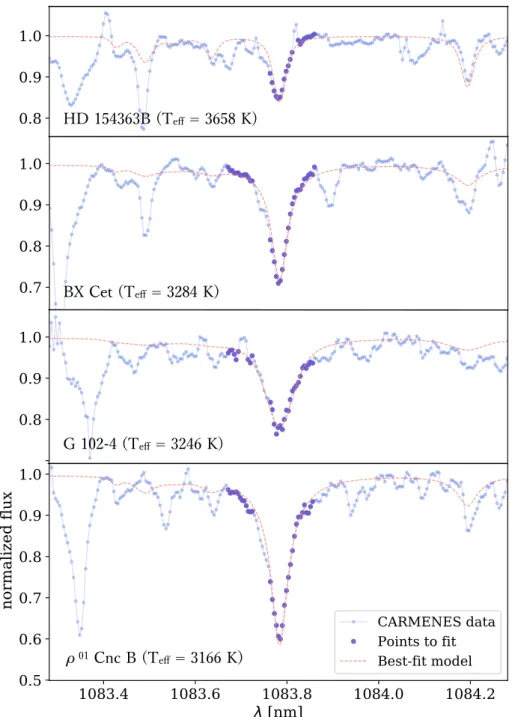
We selected 57 well-isolated FeH lines in the band to measure EW as indicators of 𝑇eff. We measured the EWs of the FeH lines by fitting the Gaussian profiles to the observational data. Chemical analysis of the IRD planet survey than most of the other estimates based on the color.
The FeH lines clearly affected by the Zeeman effect are excluded from the object's 𝑇eff-FeHestimation.
Results
Elemental abundance
The horizontal dashed line shows the mean of all elements [Mave/H], weighted by the inverse of the squared errors. Sodium is one of the most important elements in terms of contributing to persistent darkness, as discussed in the previous chapter. We found that the accuracy of the [Na/H] determination degrades with increasing [Mave/H] values between objects with similar temperatures.
Extending the analysis to the other IRD-SSP targets will substantiate these discussions.
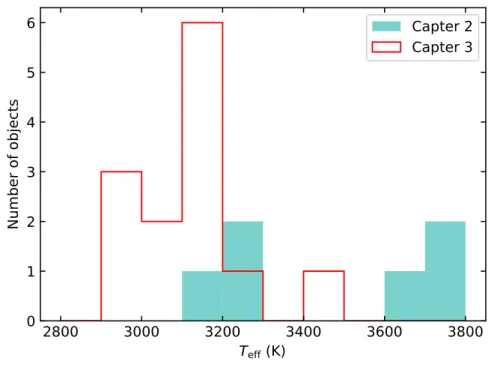
Comparison with literatures for the 11 objects with 2900
The possible systematic error in the adopted 𝑇eff-TIC and its impact on the abundance results are discussed in more detail in Section 3.5.2. Given the long lifetime of M dwarfs and the selection bias of IRD-SSP targets towards magnetically inactive, it is more natural to think that they are biased towards lower metallicities, if detectable. On the other hand, if the initial mass function depends on the metallicity, this could affect the metallicity distribution.
The bottom four small panels show the differences between our results and previous estimates as a function of 𝑇eff or [Fe/H], where gray solid lines, gray dashed lines and orange dashed lines represent the mean, 1𝜎 scatter and fitted linear trend, respectively.
![Figure 3.11: Comparison between our resulting [Fe/H] values and the previous estimates of the overall metallicity](https://thumb-ap.123doks.com/thumbv2/123deta/10550785.0/86.892.150.744.184.1026/figure-comparison-resulting-values-previous-estimates-overall-metallicity.webp)
Comparison with literatures for Barnard’s star
They refer to the total metallicity, except for Maldonado et al. (2020), who empirically determined iron abundances using principal component analysis and the sparse Bayesian method. The New14 overestimation mentioned above is not visible because the 𝑇eff of GJ 699 is higher than those of the objects in Section 3.4.2 and in the 𝑇eff range where their method is well calibrated. Recent evaluations using synthetic spectral fitting of high-resolution spectra show even higher results. Passegger et al. (2019) and Rajpurohit et al. (2018a) simultaneously determined the metallicity and stellar parameters by fitting the PHOENIX-SESAM and PHOENIX-BT-Settl synthetic spectral grids to high-resolution CARMENES optical and near-infrared spectra.
Moreover, the 𝑇eff simultaneously estimated by the fit in Rajpurohit et al. (2018a) (3400 K) is higher than that in other literature, including the 𝑇eff-TIC (3259 K), and the 𝜒2 (=2.43) of their adjustment is significantly greater. than that of most objects.
![Figure 3.12: Comparison of the [Fe/H] of GJ 699 from our analysis with those from previous studies](https://thumb-ap.123doks.com/thumbv2/123deta/10550785.0/88.892.152.748.285.693/figure-comparison-fe-gj-699-analysis-previous-studies.webp)
Discussion
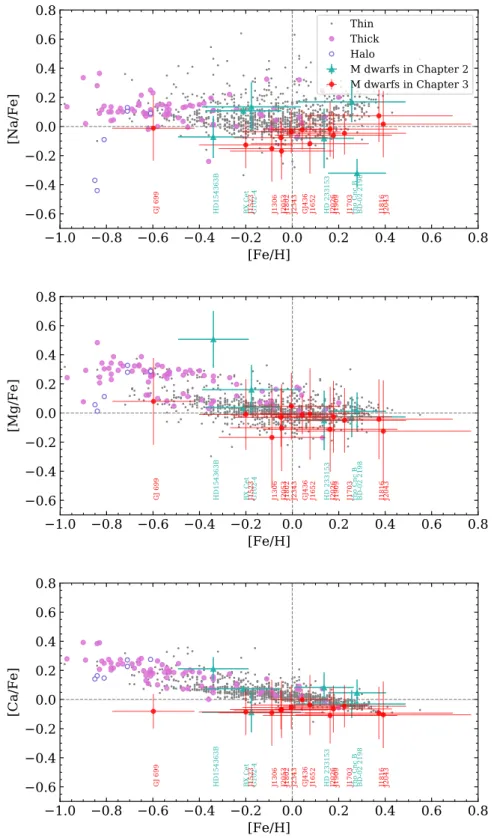
- Abundance distribution
- Effect of 𝑇 eff shift
- Kinematics
- Indication to chemical composition of planet-hosts
In the following, we report what we can find out about the arrangement of individual elements. [Cr/Fe] is closely aligned around the solar value as in the FGK samples. In the following, we will discuss this possibility and its impact on the abundance analysis.
These are reasonable results considering the fact that ~90 % of the FGK stars in the solar environment are thin disk stars and halo stars account for less than 1 % (e.g. Fuhrmann et al., 2017; de Jong et al., 2010).
Summary
Future expansion of the analysis to all IRD-SSP targets will lead to a further understanding of the abundance distribution of M dwarfs. It will also help study the relationship between the chemical composition of M dwarfs and the properties of orbiting planets and constrain theories of planet formation. Comprehensive and statistical measurements of their chemical composition will lead to an understanding of the relationship between planet formation and the nature of their host stars, including their populations in a galactic context.
We verified the validity and accuracy of the analysis of the abundance of M dwarfs by confirming that the resulting elemental abundance of M dwarfs (𝑇eff K) forming binary systems with FGK primaries matches that of the primaries.
Future prospects
FeH FeH FeH FeH FeH FeH FeH FeH FeH FeH FeH FeH FeH FeH FeH FeH FeH FeH FeH FeH FeH FeH FeH FeH FeH. OH OH OH OH OH OH OH OH OH OH OH OH OH OH OH OH OH OH OH OH OH OH. OH OH OH OH OH OH OH OH OH OH OH Na I.
OH OH OH OH OH OH OH OH OH OH OH OH OH OH OH OH OH OH OH OH OH OH OH OH OH OH OH OH OH OH OH OH OH OH OH OH OH OH OH OH OH OH OH OH OH OH OH OH OH OH OH OH OH OH.
![Table 2.3: Measured EWs in units of [pm]](https://thumb-ap.123doks.com/thumbv2/123deta/10550785.0/34.892.142.747.218.1070/table-2-measured-ews-in-units-of-pm.webp)
![Figure 2.5: Sensitivity of the EWs of Fe I lines in model spectra to the assumed overall metallicity [M/H]](https://thumb-ap.123doks.com/thumbv2/123deta/10550785.0/43.892.186.711.168.533/figure-sensitivity-lines-model-spectra-assumed-overall-metallicity.webp)
