We hope that PECC, by uniting those committed to the common vision of the region, will continue to contribute to the development of the Asia-Pacific. This moderation of growth for developing economies is reflected in this year's survey on the state of the region.
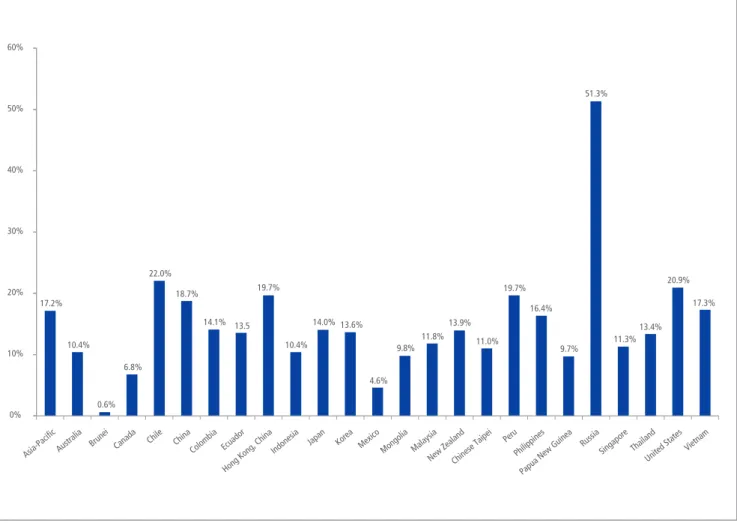
Economies Rate of dependence in 2010 (%)
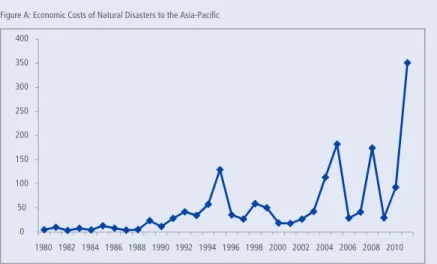
Two catastrophic events in the region were responsible for the scale of the losses: the earthquake and tsunami that hit Japan in March 2011, which totaled $212 billion; Some estimates of such dependence for selected economies in the region are shown in Table A.
Less Concern over Headline Inflation
Current Account Imbalances
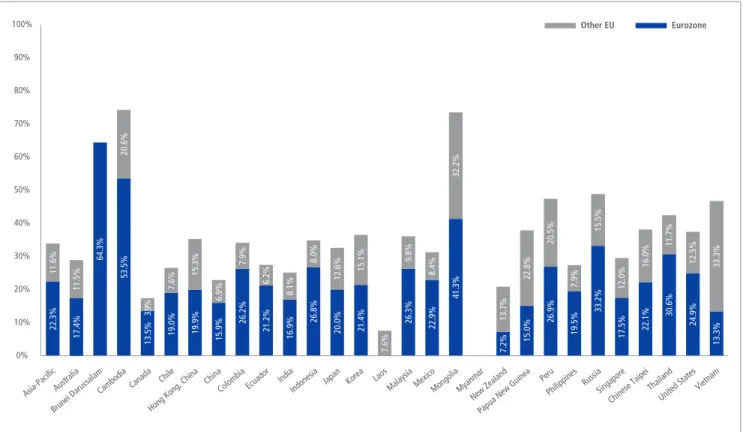
The Eurozone Debt Crisis and the Asia-Pacific
Exposure through Trade Channel
This year's APEC host, Russia, is much more connected to the European market than the rest of Asia-Pacific. In 2009, when the world went into recession, exports from the Asia-Pacific region fell more sharply than exports to the European Union.
Exports to the European Union
Overall, roughly 30 percent of financial assets in the Asia-Pacific are held by partners in the eurozone or from the EU as a whole. In the exchange rate channel, quantitative easing could cause appreciation pressures on the currencies of emerging economies.
Policy Tools and Programs for Managing Capital Flows in Asia
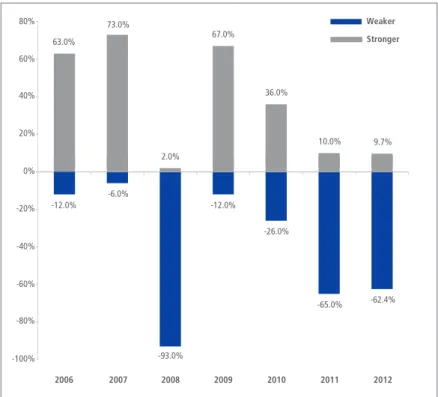
Sixty-two percent of respondents to our annual survey expect global economic growth to be somewhat weaker to much weaker over the next 12 months. Slightly more than two-thirds of respondents from Southeast Asia expect the word economy to be weaker over the next 12 months and (See Figure 2).
OPINION LEADERS’
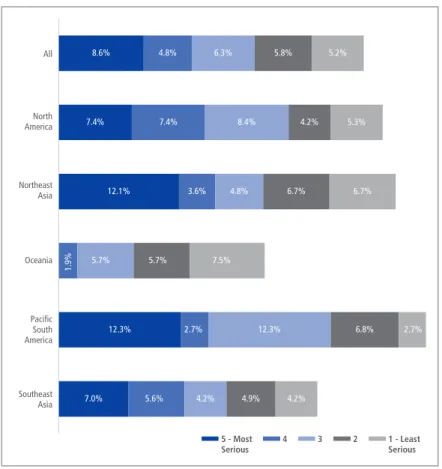
Negative sentiment about the global economy is fairly evenly spread across the Asia-Pacific region, but is currently strongest in Southeast Asia.
SURVEY*
Growing Pessimism on Emerging Markets
Opportunities for Growth
Myanmar
Risks to Growth
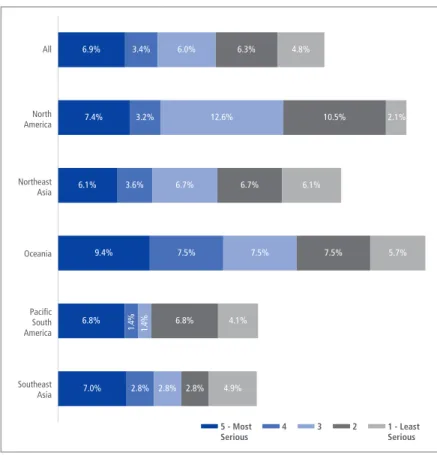
What should worry regional policymakers are views on protectionism and income inequality as risks to growth. Income inequality was already a concern before the economic crisis hit, but has been exacerbated by the crisis. Concerns about income inequality were expressed as the greatest risk by respondents from South America, with 37 percent of respondents citing income inequality as a risk to growth, followed by Northeast Asia (34 percent) and North America (33 percent) and the least by those from Oceania.
Will the reforms last?
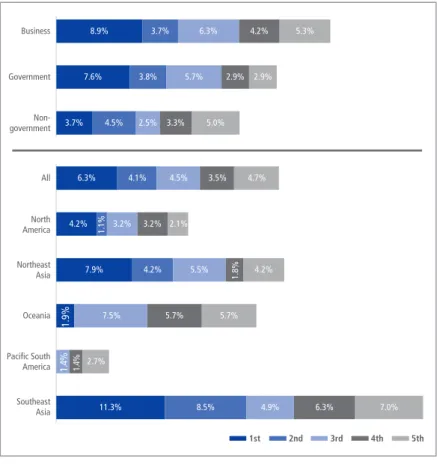
Myanmar was ranked as the 6th best opportunity for growth, even though it is neither a member of PECC nor APEC. Business respondents were much more interested in Myanmar than those from the government or non-government sectors. One reason for this is that the winds of change are picking up in Myanmar.
The challenges that lie ahead
The Eurozone Crisis
Priorities for Trade Agreements
Labor and the Environment: Divergence among Emerging Economies
Pathways to a Free Trade Area of the Asia-Pacific
East Asian Free Trade Area (ASEAN Plus 3)
The relative lack of awareness of an East Asian Comprehensive Economic Partnership and a Regional Comprehensive Economic Partnership points to a need for much more dialogue and socialization of these proposed pathways.
Which Pathway for FTAAP?
Top Issues for APEC Leaders’ Meeting
Business Government Non-government
North America Northeast Asia Oceania Pacific South
America Southeast Asia
Russia’s Priorities Well Supported by Regional Opinion Leaders
Region Divided on the Doha Round
Are they the way to a free trade area of the Asia-Pacific (FTAAP), as APEC leaders hope. Answers matter; the Asia-Pacific region is the world's largest trade area and its most promising driver of long-term economic growth. Now, a new wave of regional trade agreements and negotiations on both the Asian tracks and the TPP are creating new opportunities as well as sources of uncertainty for Asia-Pacific trade.
ASIAN AND TRANS-PACIFIC INITIATIVES IN REGIONAL INTEGRATION*
Are they the seeds of tense economic rivalry between China and the United States, as some experts fear. These extraordinary results have mostly been achieved without formal trade agreements, although the WTO system has played an important role. China and Vietnam, two of the region's most dynamic exporters, increased their trade dramatically after joining the WTO in 2001 and 2007, respectively.
APEC
The United States became involved in 2009 to help promote the dynamic development of Asia-Pacific trade and maintain its own economic engagement in the region. The Asian direction and the TPP direction (defined as the ASEAN+3 and TPP discussions) receive roughly equal support from respondents and are both seen as promising routes to FTAAP. However, their chances of success are not assessed as high - only 38 percent and 34 percent respectively for the Asian and TPP routes.
The Asian Track
In Chapter 2, PECC's annual survey of regional opinion leaders finds that respondents consider regional economic integration to be the most important focus for regional policy given the difficult global macroeconomic environment. More opinion leaders expect success in ASEAN integration (51 percent), but far fewer in the Doha Round (8 percent).
The Trans-Pacific Track
Contrasting Templates
For example, some see the TPP as a response to Asian rail agreements that excluded the United States. On the other hand, the TPP has led to stronger efforts to negotiate between China, Japan and Korea. In addition, the benefits of the TPP (as discussed in the text) could attract other ASEAN economies to the TPP.
Economic Effects
Potentially more serious could be the tensions between China and the United States arising from their participation in the various tracks. Critics of Asia-only deals in the United States have in turn warned that China is trying to pressure the US. China and the United States are just a few players in the two free trade paths, but have major interests in an integrated Asia-Pacific treaty. economy.
Economy
TPP track economies are those that were considered to participate only in Trans-Pacific track agreements. Asia-rail economies are assumed to participate only in Asia-rail agreements, and dual-track economies are assumed to participate in both agreements.
GDP2025 (billions of
Income gains in 2025
Policy Implications
The convergence measures are based on a notion that integration will lead to greater uniformity between economies. Therefore, more trade and investment among regional partners may not translate into a higher score on the integration index if the partners simultaneously diverge in terms of income, education, life expectancy, urbanization, and economic structure. This is to control for the effect sub-regional flows may have on the index, whereby a very high degree of integration among, for example, NAFTA economies may result in a falsely high measure of integration with the Asia-Pacific region as a whole.
INDEX OF REGIONAL
The previous chapters discussed a number of regional economic integration initiatives being pursued in the Asia-Pacific region. PECC's index was developed to measure the extent of economic integration in the Asia-Pacific region. The composite index is based on a combination of measures that look, on the one hand, at the extent to which the reference economies are becoming more similar in their economic characteristics ("convergence" measure) and, on the other hand, at the relative importance of trade. , investment and human flows within the region compared to flows with the rest of the world.
ECONOMIC INTEGRATION*
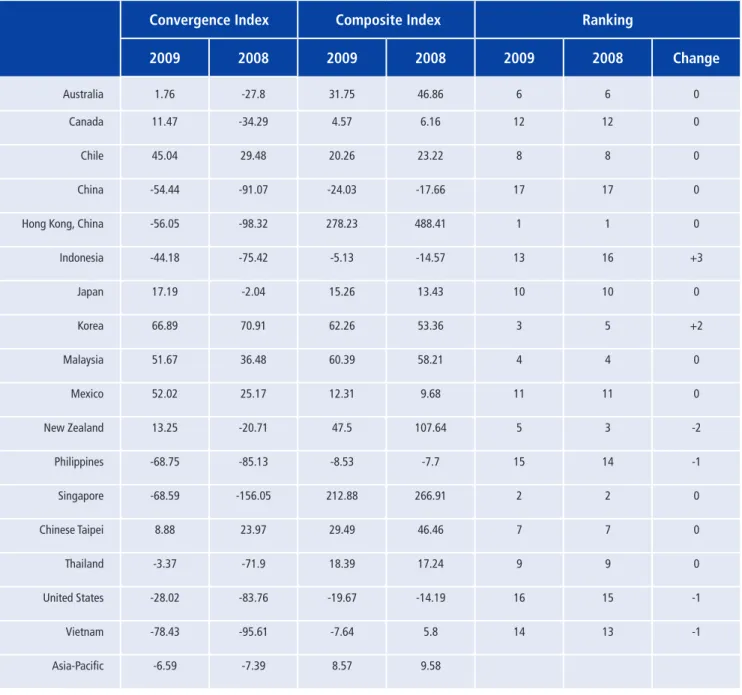
The measures chosen for inclusion in the composite index are imperfect indicators of "convergence" and trade/investment integration. The rankings, on the other hand, should not be read normatively as "league tables" in the sense that a higher ranking is better than a lower ranking. The index value for the region as a whole can also be seen as a measure of closer economic ties between the Asia-Pacific economies and as an indicator of APEC's success.
Economic Slowdown Takes Toll on Regional Integration
However, the two largest economies in this region, namely the United States and China, were the bottom two in the rankings. In summary, all three flow indicators in Figures 3 to 5 imply that the global economic crisis has dampened the trend of regional economic integration in the Asia-Pacific. Compared to trade, foreign direct investment was more likely to respond to the economic crisis because it is procyclical.
Intra-Regional Flows Impacted by Crisis
The Convergence Index
Income Inequality in the Region
Instead of assigning weights based on the perceived importance of different dimensions of integration, the index uses variation within the data to determine the weights. This is to control for the effect that sub-regional flows could have on the index, where a very high level of integration within a sub-region could result in a spuriously high level of integration within Asia-Pacific as a whole. The weights for each dimension of the index are derived by principal components analysis – they are determined by the variation between the indicators themselves.
Composite Index Weight
The deviation indicator of non-agricultural share shows that Asia-Pacific economies' industrialization (as measured by the deviation indicator of non-agricultural share), although reversed somewhat during 2006 to 2008, resumed in 2009. Data show that life expectancy varies more between the developed and emerging economies, although all the sampled economies report longer life expectancy. Finally, the education indicator implies that the share of education expenditure across the region has converged over time.
Convergence Index Weight
The urban population share indicator continues to converge steadily over time due to the ambitious process of urbanization in developing economies such as China and Southeast Asian economies. This means that although index weights change over time, they are more objective because they are derived from data rather than any preconceived notions about which factors are more important.
ANNEX A
Asia-
Pacific Developed
Economies Emerging
Economies Oceania North
America NortheastAsia
Pacific South
Southeast Asia
Export Weights Import Weights
As a guide, government respondents in previous years included a number of former and current ministers, deputy and deputy ministers, central bank governors and their advisors on Asia-Pacific issues, current senior APEC officials and a number former senior APEC officials. . Panelists should come from companies operating in a number of Asia-Pacific economies or doing business with a number of partners in the region. In last year's survey, these included CEOs, vice presidents for Asia Pacific operations and directors of chambers of commerce.
Respondent Breakdown
Note on Survey
ANNEX B
Economic Outlook and Risks to Growth
Much weaker Somewhat
No response
1st - Opportunity
2nd - Opportunity
3rd - Opportunity
4th - Opportunity
5th - Opportunity
2. Which economies do you think offer the best opportunities for growth over the next 5 years. 3 Please choose the top five risks to growth for your economy over the next 2-3 years.
1 - least
Eurozone Crisis
1 - low
No response Net score
Regional Economic Integration
1 - not at
1 – not
1 - most
APEC Leaders’ Meeting
MEMBER COMMITTEES
Korea National Committee for Pacific Economic Cooperation c/o Korea Institute for International Economic Policy (KIEP) 4F, 300-4, Yomgok-Dong. Malaysia National Committee for Pacific Economic Cooperation c/o Institute of Strategic and International Studies (ISIS) No. Vietnam National Committee for Pacific Economic Cooperation c/o Vietnam Chamber of Commerce and Industry (VCCI) 9 Dao Duy Anh Street, Hanoi.
ASSOCIATE MEMBERS
Hadelin DE LA TOUR DU PIN Permanent Secretary for Pacific Affairs Ministry of Foreign Affairs.
INSTITUTIONAL MEMBERS