저작자표시-비영리-변경금지 2.0 대한민국 이용자는 아래의 조건을 따르는 경우에 한하여 자유롭게
l 이 저작물을 복제, 배포, 전송, 전시, 공연 및 방송할 수 있습니다. 다음과 같은 조건을 따라야 합니다:
l 귀하는, 이 저작물의 재이용이나 배포의 경우, 이 저작물에 적용된 이용허락조건 을 명확하게 나타내어야 합니다.
l 저작권자로부터 별도의 허가를 받으면 이러한 조건들은 적용되지 않습니다.
저작권법에 따른 이용자의 권리는 위의 내용에 의하여 영향을 받지 않습니다. 이것은 이용허락규약(Legal Code)을 이해하기 쉽게 요약한 것입니다.
Disclaimer
저작자표시. 귀하는 원저작자를 표시하여야 합니다.
비영리. 귀하는 이 저작물을 영리 목적으로 이용할 수 없습니다.
변경금지. 귀하는 이 저작물을 개작, 변형 또는 가공할 수 없습니다.
의학박사 학위논문
당뇨 환자에서 기계학습을 이용한 생리학적 지표 및 위험요인이 심혈관계
예후에 미치는 영향에 대한 검증
Validation of Physiologic Indices and Risk Factors for Cardiovascular Outcomes in
Patients with Diabetes Mellitus: A Machine-Learning Based Approach
2020년 8월
서울대학교 대학원
의학과 내과학 전공
Jinlong Zhang
학위논문 원문 이용에 대한 동의서
본인은 아래의 학위논문이 제3자의 권리를 침해하지 않았음을 서약하며, 서울대학교가 다음과 같이 저작물을 이용하는 것에 동의합니다.
논문 제목
Validation of Physiologic Indices and Risk Factors for Cardiovascular Outcomes in Patients with Diabetes Mellitus: A Machine-Learning Based Approach
학위 구분 석사 □ / 박사
■
학 과 의과대학 의학과 내과학
학 번 2017-39235
연 락 처 010-7440-1237
1. 본인은 서울대학교가 위 저작물을 인터넷 등 정보통신망을 통해 복제·전송·배포하는 것에 동의합니다.
2. 본인은 서울대학교가 위 저작물에 대해 무료로 온라인 서비스를 제공하는 것에 동의합니다.
3. 서울대학교는 내용을 변경하지 않는 범위 안에서 위 저작물을 다른 파일 형식으로 변경할 수 있습니다.
4. 본인은 위 저작물의 저작권을 타인에게 양도하거나 출판을 허락하는 등 동의 내용을 변경하고자 할 경우 소속대학(원)에 공개의 유보 또는 해지를 즉시 통보하겠습니다.
5. 서울대학교는 저작권법 및 도서관법을 준수하며 해당 저작물로 인하여 발생하는 타인에 의한 권리침해에대하여일체의 법적 책임을 지지않습니다.
제 출 일 : 년 월 일
저 작 자 : (인)
서울대학교총장 귀하
Abstract
Validation of Physiologic Indices and Risk Factors for Cardiovascular Outcomes in Patients with Diabetes
Mellitus: A Machine-Learning Based Approach
Jinlong Zhang Department of Internal Medicine The Graduate School Seoul National University
Background and Objectives:
Current European Society of Cardiology and European Association for Cardio- Thoracic Surgery guidelines recommend fractional flow reserve (FFR) measurement as a standard invasive method to identify the ischemia-causing coronary lesions.
However, patients after therapeutic procedures still suffer adverse cardiovascular events even after deferral of revascularization according to FFR, potentially due to the presence of microvascular dysfunction that may cause ischemia or foster the progression of obstructive disease. Coronary microvascular dysfunction (CMD) is more frequently observed in patients with diabetes mellitus (DM) and is a major
determinant of long-term adverse outcome. Since comprehensive physiologic assessment enables the evaluation of microvascular function which could not be fully demonstrated by angiography, we sought to investigate the prognostic implication of invasive physiologic index-defined CMD in patients with DM and coronary artery disease (part I). Increasing evidence showed that machine learning can provide tools to assist physicians during diagnosis and treatment of diverse clinical conditions, including myocardial infarction. Therefore, we sought to study using machine learning algorithms with an expanded sample size, to validate the physiologic indices and find out the valuable risk factors for cardiovascular outcomes in patients with DM and coronary artery disease (part II).
Methods:
Part 1: Two hundred and eighty-three patients with available FFR and index of microcirculatory resistance (IMR) were selected from the 3V FFR-FRIENDS study. Patients were classified according to the presence of DM and CMD into group A (DM-, CMD-), group B (DM-, CMD+), group C (DM+, CMD-), and group D (DM+, CMD+). Primary outcome was a major adverse cardiac event (MACE, a composite of cardiac death, myocardial infarction and ischemia-driven revascularization) at 2 years. Part 2: Seven hundred and fourteen patients (235 patients with DM) with deferred coronary revascularization according to FFR (>0.80) were included. This registry hitherto is the biggest cohort whose patients were fully assessed by comprehensive physiologic indices. Comprehensive physiologic evaluation, including coronary flow reserve (CFR), IMR and FFR, was performed at the time of revascularization deferral. The median values of CFR (2.88), FFR (0.88) and IMR (17.85) were used to classify high or low CFR, FFR, and IMR groups.
Information gains of variables with 5,000-permutation resampling, minimal depth and Boruta algorithms were used for feature selection. Furthermore, prognostic models were compared using c-index. In this part, patient-oriented composite outcome (POCO) at 5 years, including all-cause death, any myocardial infarction, and any revascularization, was the primary outcome.
Results:
Part 1: DM population showed significantly higher risk of MACE compared with non-DM population (HR 4.88, 95% CI 1.54-15.48, p=0.003). MACE at 2-year among four groups were 2.2%, 2.0%, 7.0%, and 18.5%, respectively. Group D showed significantly higher risk of MACE compared with group A (HR 8.98, 95%
CI 2.15-37.41, p=0.003). The multivariable regression analysis showed the presence of DM and CMD was an independent predictor of 2-year MACE (HR 11.24, 95%
CI 2.53-49.88, p=0.002) and integrating CMD into a model with DM increased discriminant ability (C-index 0.683 vs. 0.710, p=0.010, integrated discrimination improvement 0.015, p=0.040). Part 2: Compared with non-DM population, DM population showed a higher risk of POCO at 5 years (HR 2.49, 95% CI 1.64-3.78, p<0.001). Low CFR group had a higher risk of POCO than high CFR group (HR 3.22, 95% CI 1.74-5.97, p<0.001) only in DM population. In contrast, CFR values could not differentiate the risk of POCO in non-DM population. There was a significant interaction between CFR and the presence of DM regarding the risk of POCO (interaction p=0.025). Independent predictors of POCO at 5 years were low CFR and family history of coronary artery disease in DM population, and percent diameter stenosis and multi-vessel disease in non-DM population. Among all angiographic and physiologic parameters, CFR showed the highest information gain.
In DM population, CFR, consistently, was the most important feature followed by Age and FFR using “Minimal Depth” algorithm. Moreover, CFR was the valuable features to predict POCO using “Boruta” algorithm in DM population. In DM population, adding clinical risk factors (c-index 0.75 0.65-0.85, p=0.500) or clinical risk factors and invasive parameters together (c-index 0.75, 95%CI 0.65-0.85, p=0.535) into features from Boruta (c-index 0.73, 95% CI 0.63-0.83) did not show a better discriminant ability.
Conclusions:
The patients with DM and CMD were associated with increased risk of cardiovascular events. Integration of CMD improved risk stratification to predict the occurrence of MACE. The importance of risk factors for cardiovascular outcomes is different according to the presence of DM. CFR consistently was the important prognostic factor in patients with DM regardless of methods. Machine learning could help find out the most effective combination with acceptable numbers of features for better outcome prediction.
Keywords:
Coronary artery disease, diabetes mellitus, coronary microvascular dysfunction, coronary flow reserve, fractional flow reserve, index of microcirculatory resistance, machine learning.Student Number: 2017-39235
Contents
Introduction ... 2
Part 1 Methods ... 4
Results ... 7
Part 2 Methods ... 10
Results ... 16
Discussion ... 19
Conclusions ... 26
References ... 28
국문초록 ... 58
1 / 61
Abbreviations
CFR = coronary flow reserve CI = confidence interval
CMD = coronary microvascular dysfunction DM = diabetes mellitus
FFR = fractional flow reserve HR = hazard ratio
IMR = index of microcirculatory resistance MACE = major adverse cardiac event PCI = percutaneous coronary intervention POCO = patient-oriented composite outcome
2 / 61
Introduction
The presence of myocardial ischemia is the most important prognostic factor in patients with coronary artery disease. Current European Society of Cardiology and European Association for Cardio-Thoracic Surgery guidelines recommend fractional flow reserve (FFR) measurement as a standard invasive method to identify the ischemia-causing coronary lesions.1 It has been reported that the clinical outcomes of FFR-guided percutaneous coronary intervention (PCI) are better than those of angiography-guided PCI.2-4 However, patients still suffer adverse cardiovascular events even after deferral of revascularization according to FFR, potentially due to the presence of microvascular dysfunction that may cause ischemia or foster the progression of obstructive disease.2,5 Comprehensive physiologic assessment enables the evaluation of microvascular function which could not be fully demonstrated by angiography. Awareness of the existence of concealed mechanisms of coronary dysfunction could lead to closer patient surveillance and to specific treatments which, eventually, could result in better patient outcomes.2,5 Therefore, identifying patients at higher risk of future adverse cardiovascular events is a clinically important issue, even after physiology-guided revascularization strategy.
The presence of diabetes mellitus (DM) is strongly associated with CAD and increases the risk of cardiovascular events.6,7 Previous studies demonstrated that patients with DM were more likely to have multi-vessel disease and diffuse disease in small vessels,8,9 and were associated with plaque vulnerability with more significant atherosclerotic burden with lipid-rich plaques.10 In addition, coronary microvascular dysfunction (CMD), which can be defined by physiologic indices, is more frequently observed in patients with DM and11,12 is a major determinant of long
3 / 61
term outcome in this patient population.13 However, the prognostic implication of DM with or without CMD in patients has not been clarified. Moreover, prognostic value of physiologic indices and other risk factors in patients with DM and coronary artery disease has not been well investigated.
Machine learning, an application of artificial intelligence, is the study of computer algorithms that can analyze clinical information and provide tools to assist physicians during diagnosis and treatment of diverse clinical conditions.
Conventional statistical method exists within a mathematical framework and make certain probabilistic assumptions about the data generation process. In contrast, machine learning approach makes no assumptions about the data generating process and learns relationships from the data itself.14 Furthermore, it becomes an increasing trend of published work in the combined field of medicine and data science.14,15
The main aim of our study is to investigate the prognostic implication of invasive physiologic index-defined CMD in patients with DM and coronary artery disease. Furthermore, with an expanded sample size, we went on to validate the physiologic indices and find out the valuable risk factors for cardiovascular outcomes using machine learning algorithm in patients with DM and coronary artery disease.
4 / 61
Part 1 Methods
Study Design and Patient Selection
The study was sub-study of 3V FFR-FRIENDS study (3-vessel fractional flow reserve for the assessment of total stenosis burden and its clinical impact in patients with coronary artery disease, NCT01621438), which was international multi-center prospective study recruiting patients from 11 centers in 3 countries (Korea, China, and Japan) between November 2011 and March 2014.16 Patients who had >30%
stenosis in a major epicardial coronary artery by visual estimation and underwent FFR measurement in all major coronary arteries were included. The exclusion criteria were patients with depressed left ventricular systolic function (ejection fraction <35%), acute ST-elevation myocardial infarction within 72 hours, previous coronary artery bypass graft surgery, chronic renal disease, abnormal epicardial coronary flow (TIMI flow <3), or planned coronary artery bypass graft surgery after diagnostic angiography.
The current study was performed to evaluate clinical outcomes of patients according to the presence of DM and CMD, which was assessed by using IMR.
Among the main study cohort, 284 patients with 458 lesions who underwent IMR measurement were selected for the current analysis. The study protocol was approved by the Institutional Review Board or Ethics Committee at each center and was conducted following the Declaration of Helsinki. All patients provided written informed consent before enrollment.
5 / 61
Angiographic Analysis and Quantitative Coronary Angiography
Coronary angiography was performed using standard techniques. Angiographic views were obtained after intracoronary nitrate administration (100 or 200 µg).
Quantitative coronary angiography was analyzed at a core laboratory (Seoul National University Hospital) in a blinded fashion with validated software (CAAS II, Pie Medical System, Maastricht, The Netherlands). The minimum lumen diameter, reference vessel size, percent diameter stenosis, and lesion length were quantified.
FFR and IMR Measurements
FFR and IMR measurements were performed after diagnostic angiography.
Briefly, coronary angiography was performed using a 5-7 Fr guide catheter without side holes. FFR and IMR were measured with standardized protocol among the participating centers using a pressure-temperature sensor guide wire (St. Jude Medical, St. Paul, MN, USA).
The pressure sensor was positioned at the distal segment of target vessel, and intracoronary nitrate (100 or 200 µg) was administered before FFR and IMR measurements. To induce hyperemia, continuous intravenous infusion of adenosine or adenosine triphosphate was used. Hyperemic proximal aortic pressure (Pa) and distal arterial pressure (Pd) were obtained during sustained hyperemia, and FFR was calculated by means of Pd/Pa during hyperemia. According IMR measurement, resting mean transit time was obtained by injecting 4 ml saline at room temperature for 3 times, and hyperemic mean transit time was measured during sustained
6 / 61
hyperemia. The IMR was calculated by Pd × mean transit time during hyperemia.16,17 PCI was recommended as the current guideline for lesions with FFR ≤0.80. Pre-PCI FFR and IMR values were used in this study.
Cut-off Values and Classification of Patients
CMD was defined as IMR values ≥25U. Study population was classified according to the presence of DM and CMD: group A, non-DM with non-CMD;
group B, non-DM with CMD; group C, DM with non-CMD; group D, DM with CMD.
Patient Follow-Up, Outcome Measurements, and Clinical Events Adjudication
The patients were followed up at outpatient clinic visits or by telephone. All events were adjudicated by an independent clinical events committee unaware of clinical, angiographic, and physiologic data. The primary outcome was a major adverse cardiac event (MACE), including cardiac death, vessel-related myocardial infarction, and vessel-related ischemia-driven revascularization during 2-year follow-up. The individual components of MACE were also analyzed. All clinical outcomes were defined according to the Academic Research Consortium, including the addendum to the definition of MI.18 All deaths were considered cardiac, unless an undisputable non-cardiac cause was present. Ischemia-driven revascularization was defined as a revascularization procedure with at least one of the following: (1) recurrence of angina, (2) positive non-invasive test and (3) positive invasive
7 / 61 physiologic test.
Statistical Analysis
Categorical variables were presented as frequency and percentage. Continuous variables (normal distribution) were presented as mean and standard deviation or median and interquartile range (non-normal distribution). Chi-squared (or Fisher exact test) and Student`s t test were used to evaluate the differences among two groups at baseline. Chi-squared (or Fisher exact test) and ANOVA (or Kruskal–
Wallis test for non-normal distribution) were used to evaluate the differences among four groups at baseline. Multiple comparisons were performed using Tukey's Multiple Comparison Test. A multivariate Cox proportional-hazard regression model was used to calculate hazard ratio (HR) and 95% confidence interval (CI) to estimate the relative risks of the incidence of 2-year MACE. Additive prognostic implication of IMR in addition to DM was evaluated using Harrell’s C-index comparison as well as relative integrated discrimination improvement.
All probability values were two-sided and p values <0.05 were considered statistically significant. The SAS version 9.3 (SAS Institute, Inc., Cary, NC, USA) and R 3.2.3 (R Corporation, USA) statistical packages were used for statistical analyses.
Results
Characteristics of patients and target vessels
8 / 61
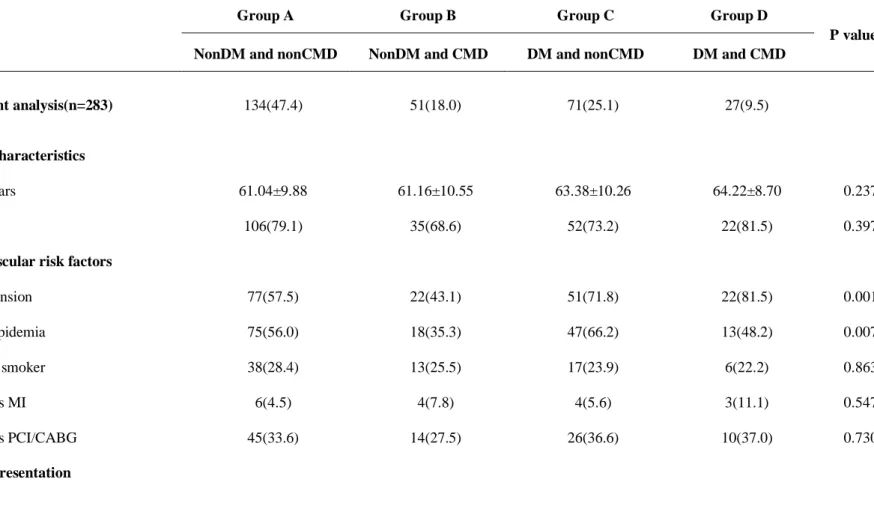
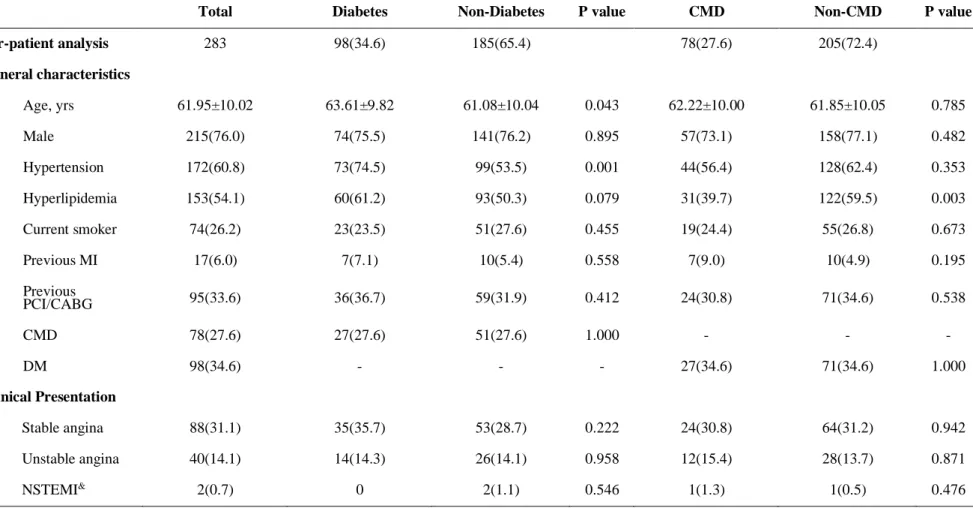
Table 1 shows baseline patient and lesion characteristics among 4 groups, classified according to the presence of DM and CMD. Among total patients, mean %DS was 36.76±15.12% and median FFR was 0.88 (Q1-Q3 0.80-0.94). Of 283 patients, 47.4% had non-DM and non-CMD (group A), 18.0% had non-DM and CMD (group B), 25.1% had DM and non-CMD (group C), and 9.5% had DM and CMD (group D). The distribution of most cardiovascular risk factors and clinical presentation was similar among all groups, except that the proportion of hypertension and hyperlipidemia. The Synergy Between Percutaneous Coronary Intervention With Taxus and Cardiac Surgery score of group B was significantly lower than other groups, while mean reference diameter of group B was higher than other groups. The 3-vessel FFR showed no significant difference among 4 groups (2.71 vs. 2.76 vs. 2.73 vs. 2.68, overall p=0.135). Significant different rate of positive FFR (34.3% vs. 13.7% vs. 21.1% vs. 33.3%, overall p=0.019) and rate of those without PCI were shown among 4 groups (20.9% vs. 3.9% vs. 12.7% vs. 7.4%, overall p=0.016) mostly due to group A and group B. The comparisons of baseline clinical characteristics according to DM or CMD are presented in Table 4.
Clinical Outcomes According to Presence of DM and CMD
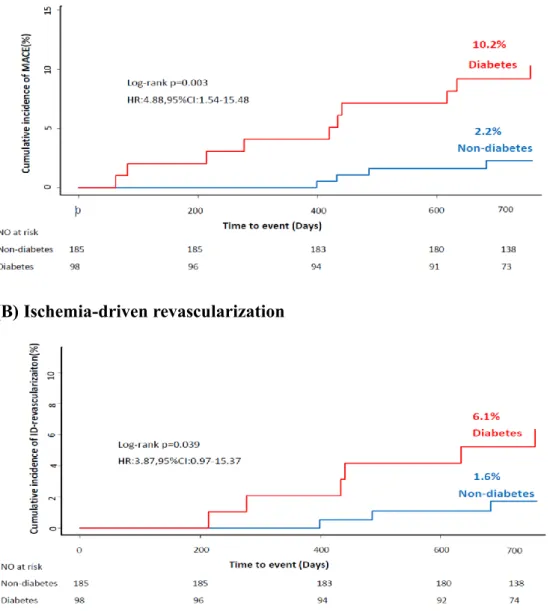
At 2 years of follow-up, DM patients had significantly higher risk of MACE (HR 4.88, 95% CI 1.54-15.48, p=0.003), compared with non-DM patients. The significant difference in MACE was mainly driven by higher risk of ischemia-driven revascularization in DM patients (HR 3.87, 95% CI 0.97-15.37, p=0.039), compared with non-DM patients (Figure 1).
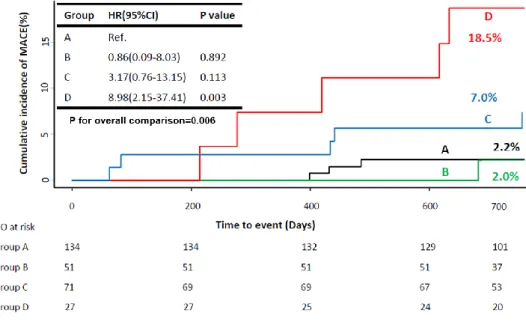
Among the four groups, classified according to the presence of DM and CMD,
9 / 61
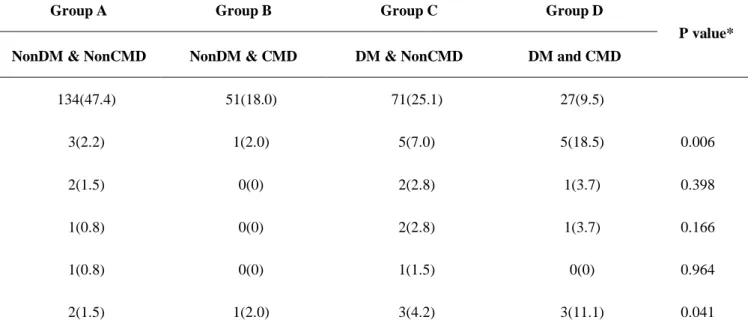
the cumulative incidence of MACE was 2.2%, 2.0%, 7.0%, and 18.5% for groups A, B, C, and D, respectively (p=0.006). Only group D showed significantly higher risk of MACE, compared with other groups (Table 2 and Figure 2). The significant difference in the risk of MACE was mainly driven by ischemia-driven revascularization. The incidence of death, cardiac death and MI was not different among 4 groups (Table 2).
Prognostic Implication of CMD in Addition to DM
A multivariate model showed that DM was an independent predictor of MACE.
When CMD and DM was included as one of the covariates, the presence of DM and CMD (group D) was the most powerful independent predictor for MACE (HR 11.24, 95% CI 2.53-49.88, p=0.002) (Table 3). In addition, integration of CMD into prediction model with DM for 2-year MACE showed significantly improved discriminant function (C-index 0.683 vs. 0.710, p=0.010) and reclassification ability (relative integrated discrimination improvement 0.015, p=0.040). When we put CFR into the model instead of IMR, consistently improvement of c-index was shown (0.025, 0.683 vs 0.708, p=0.046). However, there was rarely integrated discrimination improvement (0.01, p=0.359).
10 / 61
Part 2 Methods
Study Population
The study population was from the International Collaboration of Comprehensive Physiologic Assessment Registry which included patient-level data of 3 registries from 5 university hospitals in Korea, Tsuchiura Kyodo General Hospital (Ibaraki, Japan), and Hospital Clinico San Carlos (Madrid, Spain).5,19-22 All enrolled patients underwent comprehensive coronary physiologic evaluations (FFR, CFR and IMR) during coronary angiography, and all registries shared the same exclusion criteria. FFR was measured in intermediate stenosis to identify hemodynamic significance and CFR and IMR were measured as a part of routine clinical practice and for research purposes. Exclusion criteria were hemodynamic instability, left ventricular dysfunction and a culprit lesion of acute coronary syndrome. Finally, the International Collaboration of Comprehensive Physiologic Assessment Registry included a total of 1,397 patients with 1,694 vessels. This registry hitherto is the biggest cohort whose patients were fully assessed by comprehensive physiologic indices. According to the purpose of this study, 714 patients with 988 vessels with deferred coronary revascularization according to FFR (>0.80) were included. In patients with multi-vessel interrogations, a representative vessel was defined as the one with the lowest FFR value. The study protocol was approved by the ethics committee at each participating center and was conducted according to the principals of the Declaration of Helsinki. All patients provided written informed consent. The study protocol was registered at clinicaltrials.gov
11 / 61 (NCT03690713).
Invasive Coronary Angiography and Measurement of Physiologic Indices
Invasive coronary angiography was performed utilizing standard techniques.
Briefly, all angiograms were acquired after administration of intracoronary nitrate (100 or 200ug).
Quantitative coronary analysis was performed at each core laboratory of included registries using a validated software program. Reference vessel diameter, MLD, %DS and lesion length were evaluated. Coronary physiologic indices were measured following diagnostic angiography.19 After engagement of a guide catheter, a pressure/temperature-sensor guide wire (Abbott Vascular, St. Paul, MN, USA) was calibrated and equalized to aortic pressure. Then, it was positioned at the distal part of a coronary artery. During maximal hyperemia, FFR was acquired and was defined as the lowest value of mean hyperemic distal coronary to aortic pressure. CFR was calculated as a ratio of resting Tmn to hyperemic Tmn. To obtain Tmn, 3 injections of room-temperature saline were performed, and thermodilution curves were acquired in both resting and hyperemic state. Hyperemic state was induced with administration of intravenous adenosine (140 µg/kg/min). Pressure wire pull-back was performed after every measurement to check the presence of pressure drift. IMR was calculated as distal coronary artery pressure × Tmn during hyperemia, and all IMR values were adjusted to the expected collateral support using Yong’s formula (Pa × Tmn × ([1.35 × Pd/Pa] − 0.32).17
12 / 61
Data Collection, Clinical Outcomes, and Classification of Patients
Data collection was performed using a standardized form of a spreadsheet with standardized definitions of variables. Clinical, angiographic, and physiologic data of the enrolled patients were recorded at the time of the index procedure using this form.
Clinical outcome data were collected by outpatient clinic visits or telephone call.
Baseline characteristics including age, sex, body mass index, conventional risk factors (including hypertension, DM, dyslipidemia, current smoking, prior history of myocardial infarction and revascularization, family history of CAD), left ventricular ejection fraction (%) and the presence of multivessel disease were obtained. Body mass index was defined as weight (kg)/height (m2). Hypertension was defined as systolic blood pressure more than 140 mmHg, diastolic blood pressure more than 90 mmHg, previous history of hypertension, or the use of antihypertensive medications. DM was defined as fasting glucose more than 126 mg/dL, previous history of DM or the use of DM medications. Dyslipidemia was defined as low- density lipoprotein cholesterol more than 160 mg/dL, previous history of dyslipidemia, or the use of lipid lowering medications. Current smoker was defined if a patient had smoked regularly within past 12 months. Left ventricular ejection fraction was measured by M-mode echocardiographic estimation to evaluate systolic function and multivessel disease was defined as having at least 2 major epicardial coronary arteries with the presence of greater than 50% luminal narrowing. All data were requested of the principal investigators of each registry to be sent to Seoul National University Hospital, Korea. All submitted data were double-checked by a
13 / 61
central monitoring team at Seoul National University Hospital, Korea.
The primary outcome was the patient-oriented composite outcome (POCO) at 5 years, including all-cause death, any myocardial infarction, and any revascularization. All clinical outcomes followed the definitions of the Academic Research Consortium, including the addendum to the definition of myocardial infarction.23,24
All patients were grouped according to the values of CFR, FFR, and IMR in a representative vessel. The median values of CFR (2.88), FFR (0.88) and IMR (17.85) were used to classify high or low CFR, FFR and IMR groups, respectively.
Statistical Analysis
The categorical variable was described as a number and relative frequency and the continuous variable as mean and standard deviation. The Student’s t-test was performed to compare continuous variables. Kaplan-Meier analysis was used to calculate the cumulative incidence of clinical outcomes, and a log-rank test was used to evaluate the group differences. Cox proportional hazard regression model was used to calculate the HR and 95% CI. In addition, multivariate Cox proportional hazard regression models were used to identify independent predictors of POCO according to the presence of DM. The covariates that were considered clinically reliable or were associated with clinical outcomes (univariate analysis, p value < 0.1) were included in the models. In addition, the locally-weighted scatterplot smoothing regression line was used to explore the prognostic value of CFR. All p values were 2-sided, and p<0.05 was considered statistically significant. The statistical package
14 / 61
R, version 3.4.3 (R Foundation for Statistical Computing) was used for statistical analysis.
Machine learning
In order to build a reasonable machine learning model, data visualization was performed via Histogram, Density Plot and Whisker Plot for univariate distribution and Correlation Plot, Scatter Plot matrix Plot and Density Plots by Class for multivariate correlation. Missing data will be checked on missingness map.
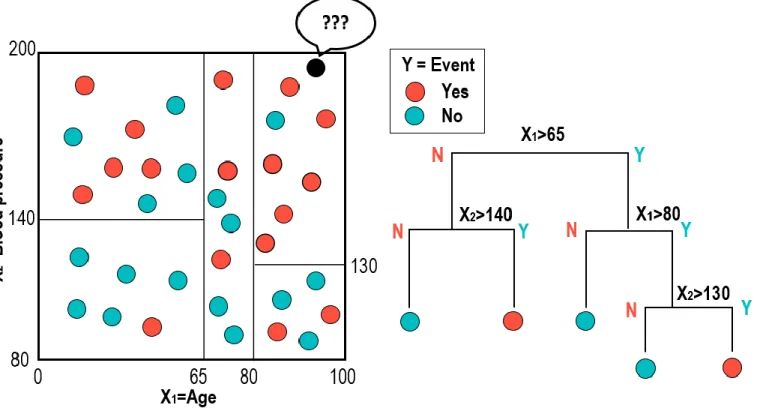
Random survival forest is one of the most popular techniques used in data mining or machine learning. A binary tree is a decision tool that uses a binary tree- like graph or model of decisions and their possible consequences. It is a flowchart like structure where each node represents a decision (based on a selected variable) and the two branches of the node represent the outcome of the test (Figure 3). The process of Random Survival Forest method is started with bootstrapping samples from the data. Each bootstrap sample excludes one-third of the data, called out-of- bag data, and a binary survival tree is made from each bootstrap sample by the repeated splitting of tree nodes starting from the root node. At each node, randomly selected variables from the data are used to split the nodes by maximizing the survival difference between daughter nodes (maximizing cumulative hazard function at that node). The tree is fully grown until each terminal node has at least one unique outcome. The trees are grown 3,000 times in this study. Then, cumulative hazard function for each tree is calculated, and an ensemble hazard function is obtained by averaging over all trees.
Feature selection to identify the important predictors is based on the minimal
15 / 61
depth of variables. The minimal depth is the shortest distance from the root node to the root of the closest maximal subtree of the variable. A maximal subtree for the variable is the largest subtree whose root node splits on the variable. The smaller value of minimal depth means the more predictive value.
For evaluating the relative importance of covariates to predict POCO, information gains of variables with 5,000-permutation resampling method were calculated. Information gain presents the effect of the variable of interest, and is defined as the change of information entropy between before and after the variable given.25 Entropy is a measure of the randomness of the distribution of data. Higher information gain means the covariate is more informative in classifying the outcome.
The higher information gain means covariate has more importance in predicting the clinical outcome.
The “Boruta” algorithm was used for evaluating the importance of variables.
The “Boruta” algorithm can provide a numerical ranking according to Z-score for input parameters in classification or regression of an outcome variable, and all input parameters are classified as important, or unimportant based on the comparison with random variables through 1 iteration. Firstly, it adds randomness to the given data set by creating shuffled copies (shadow features) of all feature. Then it trains random forest classifier on the data set and applies a feature importance (mean decrease accuracy) to evaluate the importance of each feature. At each iteration, it checks whether a real feature has a higher importance than the best of its shadow. Finally, the algorithm stops either when all features gets confirmed or rejected or reaches a specified limit of random forest runs. In the current study, 3,000 iterations of the Boruta algorithm were performed.
16 / 61
Results
Patient Characteristics
Among the 714 patients included in this study, 235 patients (32.9%) had DM.
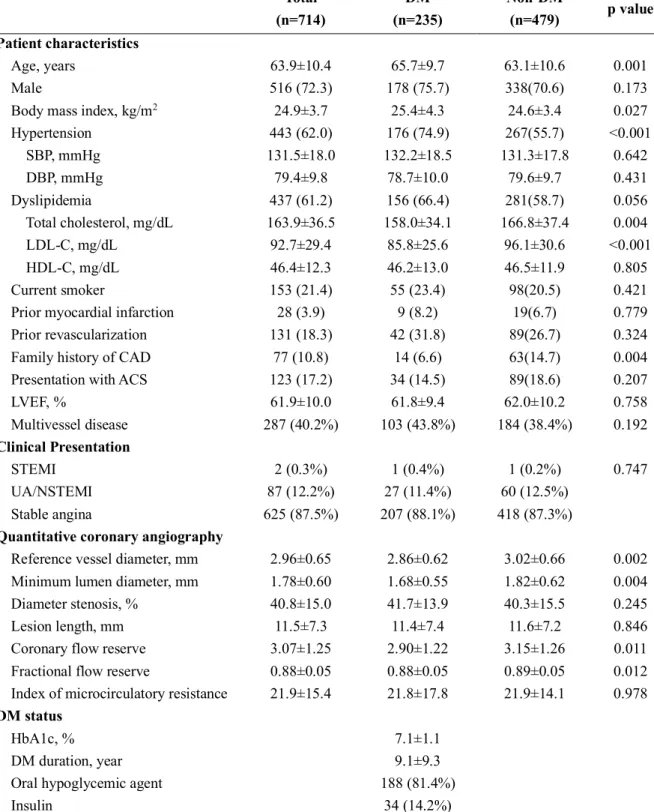
Baseline patient and lesion characteristics are presented in Table 5. Compared to patients without DM, DM patients were associated with older age (63.1±10.6 vs.
65.7±9.7 years, p=0.001), higher body mass index (24.6±3.4 vs. 25.4±4.3, p=0.027) and higher prevalence of hypertension (55.7% vs. 74.9%, p<0.001). Neither the clinical presentation nor the presence of multivessel disease was significantly different between the DM and non-DM populations.
Lesion Characteristics and Clinical Outcomes According to the Presence of DM
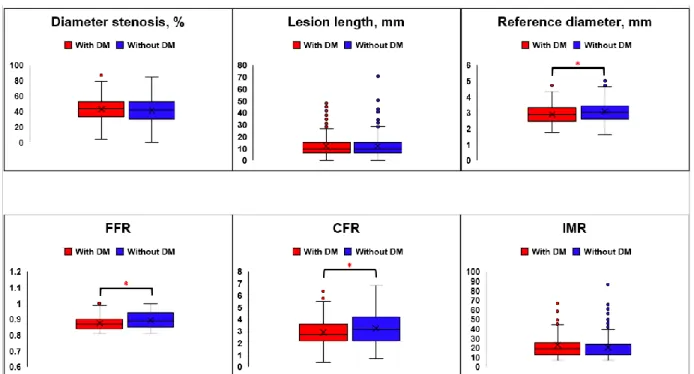
Anatomical lesion severity was not different among patients with or without DM (diameter stenosis 41.7±13.9 vs. 40.3±15.5 %, p=0.245; lesion length 11.4±7.4 vs. 11.6±7.2 mm, p=0.846). However, vessel reference diameter was smaller in patients with DM than those without DM (2.86±0.62 vs. 3.02±0.66, p=0.002) (Figure 4 and Table 5). In terms of physiological indices, DM patients showed lower CFR and FFR values than those without DM (CFR 2.90±1.22 vs. 3.15±1.26, p=0.011;
FFR 0.88±0.05 vs. 0.89±0.05, p=0.012) (Figure 4 and Table 5). There was no significant difference in IMR between patients with and without DM (21.8±17.8 vs.
21.9±14.1, p=0.978) (Figure 5 and Table 5).
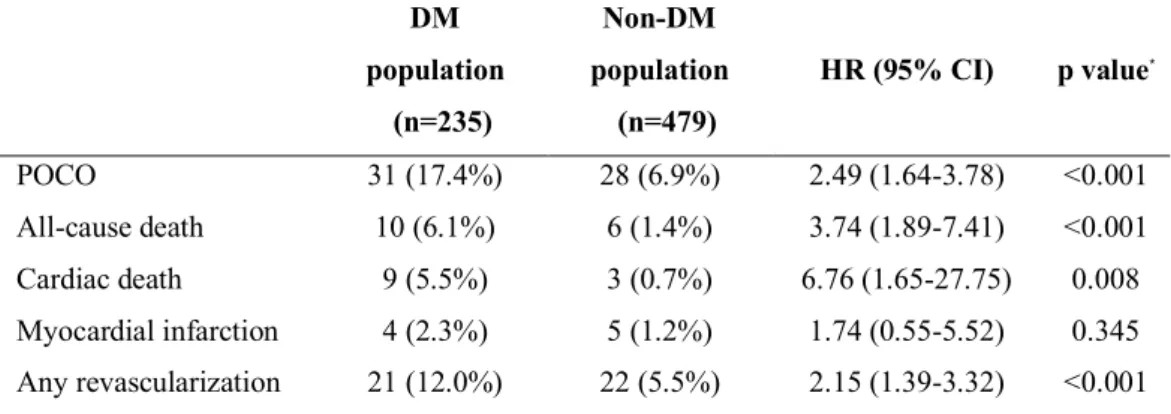
Compared with the non-DM population, the DM population showed a higher
17 / 61
risk of POCO at 5 years (6.9% vs. 17.4%, HR 2.49, 95% CI 1.64-3.78, p<0.001) (Figure 5 and Table 6). Higher risk of POCO in the DM population was mainly driven by higher risk of all-cause death (6.1% for patients with DM vs. 1.4% for patients without DM, HR 3.74, 95% CI 1.89-7.41, p<0.001) and any revascularization (12.0% for patients with DM vs. 5.5% for patients without DM, HR 2.15, 95% CI 1.39-3.32, p<0.001) (Table 6).
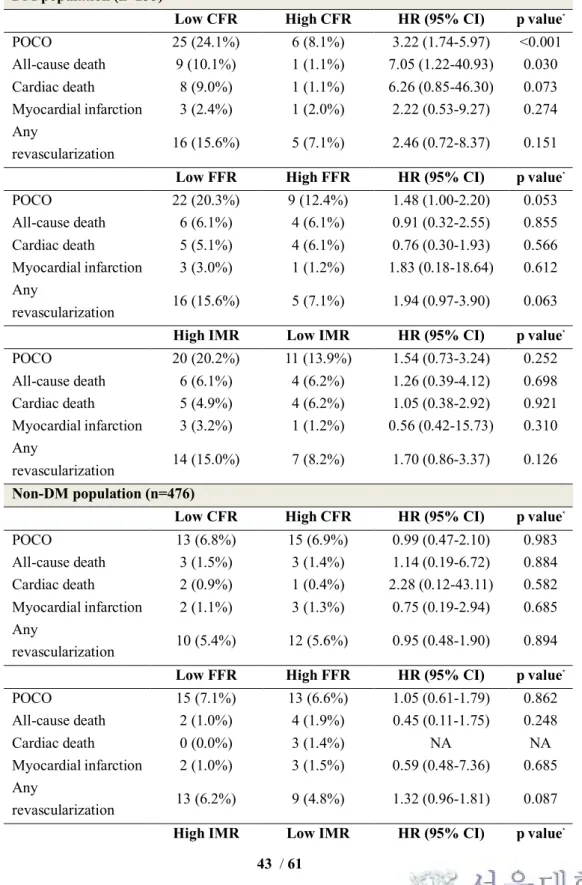
Clinical Outcomes According to Physiologic Indices and the Presence of DM
The relationship between physiological indices and long-term patient outcomes differed significantly between patients with and without DM.
In the DM population, the low CFR group had a higher risk of POCO than the high CFR group (24.1% vs. 8.1%, HR 3.22, 95% CI 1.74-5.97, p<0.001) (Figure 6 and Table 7). In contrast, low FFR or high IMR value showed only a trend toward higher risk of POCO (low FFR vs. high FFR groups 20.3% vs. 12.4%, HR 1.48, 95%
CI 1.00-2.20, p=0.053; high IMR vs. low IMR groups 20.2% vs. 13.9%, HR 1.54, 95% CI 0.73-3.24, p=0.252).
In the non-DM population, CFR and FFR values could not differentiate the risk of POCO. The low CFR and low FFR groups showed comparable risk of POCO at 5 years with the high CFR and high FFR groups (the low CFR vs. high CFR groups 6.8% vs. 6.9%, HR 0.99, 95% CI 0.47-2.10, p=0.983; the low FFR vs. high FFR groups 7.1% vs. 6.6%, HR 1.05, 95% CI 0.61-1.79, p=0.862) (Figure 7 and Table 7).
IMR showed a borderline association with a risk of POCO in the non-DM population (HR 2.08, 95% CI 1.00-4.31, p=0.050) (Figure 6 and Table 7).
18 / 61
When the CFR values were treated as a continuous variable, the risk of POCO at 5 years was significantly increased with decrease of CFR in the DM population (HR 1.71, 95% CI 1.39-2.11, p<0.001), but not in the non-DM population (HR 1.13, 95% CI 0.85-1.50, p=0.418) (Figure 7). There were no significant interactions between FFR or IMR values and the presence of DM for POCO (interaction p values
= 0.353 for FFR and 0.163 for IMR against DM). However, there was a significant interaction between CFR values and the presence of DM (interaction p=0.025).
Independent Predictors using Cox-regression and Important variables using Machine Learning Algorithm
Independent predictors of POCO at 5 years were low CFR and family history of CAD in DM patients (Table 8). Among the angiographic and physiologic indices, CFR showed the highest information gain (0.027, 95% CI 0.010-0.044) (Figure 8).
In contrast, %diameter stenosis and multi-vessel disease were independent predictors of POCO at 5 years in patients without DM (Table 8) and information gain of diameter stenosis (0.014, 95% CI 0.006-0.022) was the highest (Figure 8).
Consistently, The most important feature for POCO using “Minimum Depth”
algorithm was CFR in patients with DM and age in patients without DM. (Figure 9) Moreover, “Boruta” algorithm showed sex, CFR, age were valuable (more important than shadow variable) in patients with DM and reference diameter, sex, FFR, age, %DS, MLD were valuable in patients without DM (Figure 10).
Prognostic Models with Conventional Risk Factors or
19 / 61
Features Selected from Machine Learning in Patients with DM
As for the discriminant ability for POCO in patients with DM, the model with important features selected using minimal depth algorithm (CFR, age, FFR and % diameter stenosis; c-index 0.74, 95% CI 0.63-0.85, p=0.606) or using information gain algorithm (CFR, minimum lumen diameter, % diameter stenosis, age and sex;
c-index 0.74, 95% CI 0.64-0.84, p=0.587) showed similar discriminant ability compared to that with features selected using Boruta algorithm (sex, CFR and Age;
c-index 0.73, 95% CI 0.63 – 0.83) (Figure 11).
Moreover, adding clinical risk factors (acute coronary syndrome, hypertension, dyslipidemia and family history of coronary artery disease; c-index 0.75 0.65-0.85, p=0.500) or clinical risk factors and invasive parameters (%diameter stenosis, FFR, IMR) together (c-index 0.75, 95%CI 0.65-0.85, p=0.535) into features from Boruta did not show a better discriminant ability (Figure 12).
Discussion
This registry hitherto is the biggest cohort whose patients were fully assessed by comprehensive physiologic indices. The current study investigated the prognostic implication of invasive physiologic index-defined CMD, validated the physiologic indices and found out the valuable risk factors for cardiovascular outcomes in patients with DM and coronary artery disease. The main findings are as follows: 1) The DM population showed not only a higher risk of MACE at 2 years but a higher risk of POCO at 5 years than the non-DM population; 2) Patients with both DM and CMD were at increased risk of MACE and significantly improved discriminant
20 / 61
function and reclassification ability were observed when CMD were integrated into a prediction model with DM for 2-year MACE; 3) Low CFR value was associated with a higher risk of POCO at 5 years and was an independent predictor of POCO in the DM population but not in the non-DM population; 4) There were no significant interactions between FFR or IMR values and the presence of DM regarding the risk of POCO. However, there was significant interaction between CFR and the presence of DM. 5) In patients with DM, CFR was consistently an important index in predicting POCO regardless of methods. 6) Model with important features (age, sex, CFR) selected using machine learning showed a similar discriminant ability compared to model built by conventional factors (age, sex, CFR, acute coronary syndrome, hypertension, dyslipidemia, family history of coronary artery disease, %diameter stenosis, FFR and IMR).
Association Between Coronary Artery Disease and DM
DM is an important risk factor of CAD, and its prevalence is rapidly growing worldwide.6,7 Patients with DM are more likely to have severe and diffuse vascular disease, multi-vessel disease, and microvascular dysfunction9,11,26, which are poor prognostic factors in patients with CAD. The current guidelines recommend invasive physiologic index-guided coronary revascularization in patients without evidence of ischemia, and the indications for revascularization are not different between DM and non-DM populations.27 In the current study, patient with DM had not only a significantly higher risk of MACE at 2 years but a significantly higher risk of POCO at 5 years than those without DM.
21 / 61
Prognostic Implication of CMD in Patients with DM
In the first part of our study, prognostic implications of CMD in diabetic patients who underwent comprehensive physiologic assessment was investigated.
Coronary microvascular dysfunction is a wider category including abnormalities in microcirculatory resistance. It represents a spectrum from both the pathological and clinical viewpoint.28 The presence of CMD is associated with an increased risk of clinical events.29-32 There are several invasive and non-invasive diagnostic techniques to define CMD and IMR is a specific index to evaluate microvascular status in a cardiac catheterization laboratory. It is relatively independent from epicardial coronary stenosis and shows a good reproducibility.33 A previous study showed that IMR >25 can be considered abnormal in a non-MI population13, and Lee et al. demonstrated that the patients with high IMR and low CFR have the highest cumulative incidence of events including death, MI and revascularization.5 Thus, the current study used the IMR cutoff value 25 to define CMD.34
In this study, the patients with DM and CMD (Group D) have significantly higher MACE compared to non-DM and non-CMD patients. In addition, only DM with CMD was an independent predictor of MACE, and the presence of DM and CMD has additional prognostic value. A similar result was published in a Doppler- derived coronary flow velocity reserve study. Cortigiani et al. investigated the prognostic implications in patients with type 2 diabetes with angiographically normal or near normal coronary arteries and preserved left ventricular function. The CMD conferred strong prognostic information which was predicting a nearly seven times higher hard-event compared to non-CMD group.35 These results suggest that CMD is an important prognosticator in DM patients regardless of methods of
22 / 61 measurement.
Prognostic Factors in Patients with DM
In the second part of our study, population was extended from single country to three countries (Korea, Japan and Spain). To avoid the prognostic impact of PCI, we enrolled only deferred coronary lesions according to FFR > 0.80. Coronary physiology and the importance of prognostic factors can be different in the DM population, as DM affects various compartments of the coronary circulation system.6 In the current study, different outcome predictors and valuable features were shown between DM and non-DM population. However, the results consistently showed CFR was a valuable feature in DM population. In previous study, the long term prognosis of patients with DM without obstructive coronary disease but impaired CFR has been shown to be poor, and similar to patients with DM and obstructive CAD.13 In this context, the current study evaluated the characteristics and prognosis of deferred coronary lesions in the DM population, taking into account not only the functional relevance of epicardial coronary stenoses but also the subtended microcirculatory status.
Angiographic and Physiologic Features in Deferred Patients with DM
We investigated the impact of DM on deferred coronary lesions. The results showed that angiographic lesion severity, assessed by percent diameter stenosis and lesion length, was not different among patients with or without DM. However,
23 / 61
reference diameter and minimal lumen diameter in patients with DM were smaller than those in patients without DM. These results imply that there is a possibility of diffuse epicardial coronary disease in patients with DM, suggesting that deferred patients with DM might have a more extensive disease burden than those without DM. These results are in line with previous studies that the presence of DM was associated with more severe and diffuse CAD.9 By physiologic assessment, CFR and FFR values were lower in DM patients. These angiographic and physiologic features seem to be the main factors for the higher risk of POCO in deferred coronary lesions in DM patients than in those without DM. In the current study, deferred patients with DM showed about 2.5-fold higher risk of POCO than those without DM, even though all patients had an FFR >0.8.
Considering the potential impact of DM on the coronary microvascular system, it is interesting that the IMR values were similar between DM and non-DM patients in our study. Although IMR reflects the microvascular state during the hyperemia,34 not all aspects of microvascular dysfunction can be assessed by this index.36 The direct relation between DM and IMR has been sparsely studied in a small number of patients.37 In addition, several previous studies reported that DM was not an independent predictor of high IMR, and DM patients showed comparable level of IMR with non-DM patients.5,38 The microvascular dysfunction in DM has been explained by endothelial dysfunction in not being able to increase the coronary flow when needed.13,26,36 In this regard, our study results suggest that CFR can be a more appropriate index for evaluating microvascular dysfunction in DM patients without epicardial coronary stenosis.
24 / 61
Clinical Implications of Physiologic Indices for Revascularization Deferral in Patients with DM
Although patients with DM generally have a higher risk of cardiovascular events than those without, the risk was reported to be different according to anatomical and physiologic disease burden. Malik et al. reported that the risk of CAD ranged from 0.4% to 4% per year for annual CAD event rates, according to the amount of coronary artery calcium.39 Murthy et al. investigated coronary vascular dysfunction in the DM population and reported that DM population without coronary artery disease and preserved CFR had a very low risk of cardiac death.13 These studies suggest that DM carries a heterogeneous risk of CAD, thereby supporting the need for additional risk stratification in the DM population.
The current study demonstrated that CFR was the most important prognostic factor in the DM population after deferral of revascularization according to FFR.
CFR showed the highest information gain and was an independent predictor for 5- year POCO in the DM population. Moreover, CFR was the most important feature using “Minimum Depth” algorithm and also was the valuable feature using “Boruta”
algorithm in patients with DM rather than FFR and IMR. The predictive model with important features selected using machine learning showed a favorable discriminant ability.
There was a significant interaction between CFR values and the presence of DM regarding the risk of POCO, but not for FFR or IMR. Considering that DM affects various compartments of the coronary circulation system, it may be natural that CFR is better associated with the patients’ outcomes than the other specific indices.6 CFR reflects the status of both macrovascular and microvascular
25 / 61
compartments of coronary circulation and its capacity to respond to oxygen demand.
Compared to the DM population, associations of coronary physiologic indices with future clinical outcomes and prognostic factors were different in the non-DM population. Our study results suggest that the association between coronary physiologic indices and clinical outcomes in deferred patients according to FFR can be different according to the presence of DM, thereby supporting the importance of CFR measurement in DM patients.
Important Features from Machine Learning Algorithm
Our study showed similar discriminant abilities using features from given three machine learning algorithms. Thereinto, Boruta algorithm provided us numerically least features (age, sex and CFR) among three algorithms. Moreover, adding clinical risk factors or clinical risk factors and invasive parameters together into the model made by features from Boruta did not make it more predictive although over 4 or more conventional risk factors had been added. This result implies that machine learning algorithm enables a minimization of feature numbers physicians should take care of when making cardiovascular outcomes in consideration, which called
“dimension reduction”, unlike conventional statistic method.
Future Perspective
The implications of these findings merit further research, aimed to improve the safety of decision making on revascularization and, overall, to obtain better long- term clinical outcomes in patients with DM. On one hand, the presence of normal CFR in vessels with FFR>0.80 in patients with DM might reassure deferral of
26 / 61
revascularization. On the other, abnormal CFR values might foster implementation of tighter measures to control DM and cardiovascular risk factors. In the absence of studies supporting specific treatment for abnormal microcirculatory function in the DM population to modify prognosis, an abnormal CFR might indicate the presence of higher cardiovascular risk and, therefore, the need for closer patient surveillance.
In addition, considering the diverse nature of microvascular dysfunctions, our study raises the need for thorough physiologic evaluation in other disease states, such as CAD with primary myocardial disease, to understand the state of microvascular circulation.
Increasing number of features about patient need to be considered for diagnosis, treatment and outcome prediction. In this regard, machine learning algorithm enables a minimization of feature and might help find out the most effective combination with acceptable numbers of features for daily practice.
Study Limitations
There were several limitations to be considered First, this study was not a randomized controlled trial and could not control all potential bias and confounding factors. Therefore, further studies are needed to validate the results of this study.
Second, the information on true anatomical disease burden is not available as intravascular imaging was not performed. Third, although the same exclusion criteria were applied, there can be some heterogeneities in the patient population as this study consisted of 3 separate registries.
Conclusions
27 / 61
The patients with DM and CMD were associated with increased risk of cardiovascular events. Integration of CMD improved risk stratification to predict the occurrence of MACE. The importance of risk factors for cardiovascular outcomes is different according to the presence of DM. CFR consistently was the important prognostic factor in patients with DM regardless of methods.Machine learning could help find out the most effective combination with acceptable numbers of features for better outcome prediction.
28 / 61
Reference
1. Neumann FJ, Sousa-Uva M, Ahlsson A, et al. 2018 ESC/EACTS Guidelines on myocardial revascularization. Eur Heart J 2019;40:87-165.
2. De Bruyne B, Fearon WF, Pijls NH, et al. Fractional flow reserve-guided PCI for stable coronary artery disease. N Engl J Med 2014;371:1208-17.
3. Pijls NH, Fearon WF, Tonino PA, et al. Fractional flow reserve versus angiography for guiding percutaneous coronary intervention in patients with multivessel coronary artery disease: 2-year follow-up of the FAME (Fractional Flow Reserve Versus Angiography for Multivessel Evaluation) study. J Am Coll Cardiol 2010;56:177-84.
4. Tarantini G, Razzolini R, Iliceto S. Letter by Tarantini et al regarding article,
"Optimal medical therapy with or without percutaneous coronary intervention to reduce ischemic burden: results from the clinical outcomes utilizing revascularization and aggressive drug evaluation (COURAGE) trial nuclear substudy". Circulation 2008;118:e839; author reply e40-1.
5. Lee JM, Jung JH, Hwang D, et al. Coronary Flow Reserve and Microcirculatory Resistance in Patients With Intermediate Coronary Stenosis. J Am Coll Cardiol 2016;67:1158-69.
6. Beckman JA, Paneni F, Cosentino F, Creager MA. Diabetes and vascular disease: pathophysiology, clinical consequences, and medical therapy: part II. Eur Heart J 2013;34:2444-52.
7. Haffner SM, Lehto S, Ronnemaa T, Pyorala K, Laakso M. Mortality from coronary heart disease in subjects with type 2 diabetes and in nondiabetic subjects with and without prior myocardial infarction. N Engl J Med 1998;339:229-34.
29 / 61
8. Ertek S, Cicero AF, Cesur M, et al. The severity of coronary atherosclerosis in diabetic and non-diabetic metabolic syndrome patients diagnosed according to different criteria and undergoing elective angiography. Acta diabetologica 2011;48:21-7.
9. Ledru F, Ducimetiere P, Battaglia S, et al. New diagnostic criteria for diabetes and coronary artery disease: insights from an angiographic study. J Am Coll Cardiol 2001;37:1543-50.
10. Moreno PR, Murcia AM, Palacios IF, et al. Coronary composition and macrophage infiltration in atherectomy specimens from patients with diabetes mellitus. Circulation 2000;102:2180-4.
11. Nahser PJ, Jr., Brown RE, Oskarsson H, Winniford MD, Rossen JD.
Maximal coronary flow reserve and metabolic coronary vasodilation in patients with diabetes mellitus. Circulation 1995;91:635-40.
12. Di Carli MF, Janisse J, Grunberger G, Ager J. Role of chronic hyperglycemia in the pathogenesis of coronary microvascular dysfunction in diabetes. J Am Coll Cardiol 2003;41:1387-93.
13. Murthy VL, Naya M, Foster CR, et al. Association between coronary vascular dysfunction and cardiac mortality in patients with and without diabetes mellitus. Circulation 2012;126:1858-68.
14. Goldstein BA, Navar AM, Carter RE. Moving beyond regression techniques in cardiovascular risk prediction: applying machine learning to address analytic challenges. Eur Heart J 2017;38:1805-14.
15. Ambale-Venkatesh B, Yang X, Wu CO, et al. Cardiovascular Event Prediction by Machine Learning: The Multi-Ethnic Study of Atherosclerosis.
30 / 61 Circulation research 2017;121:1092-101.
16. Lee JM, Koo BK, Shin ES, et al. Clinical implications of three-vessel fractional flow reserve measurement in patients with coronary artery disease. Eur Heart J 2018;39:945-51.
17. Yong AS, Layland J, Fearon WF, et al. Calculation of the index of microcirculatory resistance without coronary wedge pressure measurement in the presence of epicardial stenosis. JACC Cardiovasc Interv 2013;6:53-8.
18. Stone GW, Vahanian AS, Adams DH, et al. Clinical Trial Design Principles and Endpoint Definitions for Transcatheter Mitral Valve Repair and Replacement:
Part 1: Clinical Trial Design Principles: A Consensus Document From the Mitral Valve Academic Research Consortium. J Am Coll Cardiol 2015;66:278-307.
19. Lee JM, Choi KH, Hwang D, et al. Prognostic Implication of Thermodilution Coronary Flow Reserve in Patients Undergoing Fractional Flow Reserve Measurement. JACC Cardiovasc Interv 2018;11:1423-33.
20. Hamaya R, Yonetsu T, Kanaji Y, et al. Diagnostic and Prognostic Efficacy of Coronary Flow Capacity Obtained Using Pressure-Temperature Sensor-Tipped Wire-Derived Physiological Indices. JACC Cardiovascular interventions 2018;11:728-37.
21. Echavarria-Pinto M, Escaned J, Macias E, et al. Disturbed coronary hemodynamics in vessels with intermediate stenoses evaluated with fractional flow reserve: a combined analysis of epicardial and microcirculatory involvement in ischemic heart disease. Circulation 2013;128:2557-66.
22. Mejia-Renteria H, Lee JM, Lauri F, et al. Influence of Microcirculatory Dysfunction on Angiography-Based Functional Assessment of Coronary Stenoses.
31 / 61
JACC Cardiovascular interventions 2018;11:741-53.
23. Mehran R, Rao SV, Bhatt DL, et al. Standardized bleeding definitions for cardiovascular clinical trials: a consensus report from the Bleeding Academic Research Consortium. Circulation 2011;123:2736-47.
24. Garcia-Garcia HM, McFadden EP, Farb A, et al. Standardized End Point Definitions for Coronary Intervention Trials: The Academic Research Consortium-2 Consensus Document. Circulation 2018;137:2635-50.
25. Hall MA, Holmes G. Benchmarking attribute selection techniques for discrete class data mining. IEEE Transactions on Knowledge and Data Engineering 2003;15:1437-47.
26. Di Carli MF, Janisse J, Ager J, Grunberger G. Role of chronic hyperglycemia in the pathogenesis of coronary microvascular dysfunction in diabetes. Journal of the American College of Cardiology 2003;41:1387-93.
27. Neumann FJ, Sousa-Uva M, Ahlsson A, et al. 2018 ESC/EACTS Guidelines on myocardial revascularization. Eur Heart J 2019;40:87-165.
28. Crea F, Camici PG, Bairey Merz CN. Coronary microvascular dysfunction:
an update. Eur Heart J 2014;35:1101-11.
29. Dhawan SS, Corban MT, Nanjundappa RA, et al. Coronary microvascular dysfunction is associated with higher frequency of thin-cap fibroatheroma.
Atherosclerosis 2012;223:384-8.
30. Murthy VL, Naya M, Taqueti VR, et al. Effects of sex on coronary microvascular dysfunction and cardiac outcomes. Circulation 2014;129:2518-27.
31. Taqueti VR, Everett BM, Murthy VL, et al. Interaction of impaired coronary flow reserve and cardiomyocyte injury on adverse cardiovascular outcomes
32 / 61
in patients without overt coronary artery disease. Circulation 2015;131:528-35.
32. Taqueti VR, Hachamovitch R, Murthy VL, et al. Global coronary flow reserve is associated with adverse cardiovascular events independently of luminal angiographic severity and modifies the effect of early revascularization. Circulation 2015;131:19-27.
33. Ng MK, Yeung AC, Fearon WF. Invasive assessment of the coronary microcirculation: superior reproducibility and less hemodynamic dependence of index of microcirculatory resistance compared with coronary flow reserve.
Circulation 2006;113:2054-61.
34. Fearon WF, Kobayashi Y. Invasive Assessment of the Coronary Microvasculature: The Index of Microcirculatory Resistance. Circ Cardiovasc Interv 2017;10.
35. Cortigiani L, Rigo F, Gherardi S, Galderisi M, Bovenzi F, Sicari R.
Prognostic meaning of coronary microvascular disease in type 2 diabetes mellitus: a transthoracic Doppler echocardiographic study. J Am Soc Echocardiogr 2014;27:742-8.
36. Camici PG, Crea F. Coronary microvascular dysfunction. N Engl J Med 2007;356:830-40.
37. Layland J, Judkins C, Palmer S, et al. The resting status of the coronary microcirculation is a predictor of microcirculatory function following elective PCI for stable angina. International journal of cardiology 2013;169:121-5.
38. Lee JM, Layland J, Jung JH, et al. Integrated physiologic assessment of ischemic heart disease in real-world practice using index of microcirculatory resistance and fractional flow reserve: insights from the International Index of
33 / 61
Microcirculatory Resistance Registry. Circ Cardiovasc Interv 2015;8:e002857.
39. Malik S, Budoff MJ, Katz R, et al. Impact of subclinical atherosclerosis on cardiovascular disease events in individuals with metabolic syndrome and diabetes:
the multi-ethnic study of atherosclerosis. Diabetes care 2011;34:2285-90.
34 / 61
Table 1. Comparison of Clinical and lesion characteristics in 4 groups, classified according to diabetes mellitus and coronary microvascular disease
Group A Group B Group C Group D
P value NonDM and nonCMD NonDM and CMD DM and nonCMD DM and CMD
Per-patient analysis(n=283) 134(47.4) 51(18.0) 71(25.1) 27(9.5)
General characteristics
Age, years 61.04±9.88 61.16±10.55 63.38±10.26 64.22±8.70 0.237
Male 106(79.1) 35(68.6) 52(73.2) 22(81.5) 0.397
Cardiovascular risk factors
Hypertension 77(57.5) 22(43.1) 51(71.8) 22(81.5) 0.001
Hyperlipidemia 75(56.0) 18(35.3) 47(66.2) 13(48.2) 0.007
Current smoker 38(28.4) 13(25.5) 17(23.9) 6(22.2) 0.863
Previous MI 6(4.5) 4(7.8) 4(5.6) 3(11.1) 0.547
Previous PCI/CABG 45(33.6) 14(27.5) 26(36.6) 10(37.0) 0.730
Clinical Presentation
35 / 61
Stable angina 37(27.6) 16(31.4) 27(38.0) 8(29.6) 0.497
Unstable angina 18(13.4) 8(15.7) 10(14.1) 4(14.8) 0.983
NSTEMI 1(0.8) 1(2.0) 0 0 0.538
Syntax Score 10.5(6.0,16.0)† 6(2,11)§*‡ 10(5,16)† 10(7,18)† 0.002
Coronary factors
FFR ≤ 0.8 46(34.3) † 7(13.7) * 15(21.1) 9(33.3) 0.019
FFR ≤ 0.8 without PCI 28(20.9) † 2(3.9) * 9(12.7) 2(7.4) 0.016
3-vessel FFR 2.71(2.59,2.80) 2.76(2.65,2.81) 2.73(2.60,2.79) 2.68(2.57,2.82) 0.135
PCI performed 21(15.7) 7(13.7) 6(8.5) 7(25.9) 0.164
Per-vessel analysis (n=456) 234(51.3) 62(13.6) 125(27.4) 35(7.7)
Quantitative coronary angiography
Reference diameter 2.85±0.53† 3.16±0.69*‡ 2.91±0.60† 2.99±0.72 0.004
Minimum lumen diameter 1.83±0.57† 2.08±0.62*‡ 1.83±0.64† 1.78±0.64 0.017
Diameter stenosis 36.31±15.04 33.96±12.72 37.97±15.89 40.42±16.25 0.159
Lesion length 7.81(5.33,13.54) 8.69(5.71,13.38) 7.27(4.93,12.55) 8.48(5.58,16.59) 0.628
36 / 61 Coronary physiological parameters
FFR(pre-PCI) 0.87(0.79,0.94)† 0.92(0.85,0.95)* 0.87(0.82,0.93) 0.88(0.76,0.93) 0.022
CFR 2.93±1.11 2.83±1.02 2.77±1.04 2.70±1.07 0.457
IMR 16.00(12.99,19.00)†§ 32.40(28.00,38.06)*‡ 16.33(12.74,20.00)†§ 29.48(26.00,33.65)‡ <0.001
*: p<0.05 comparied with group A; †: p<0.05 comparied with group B; ‡: p<0.05 comparied with group C; §: p<0.05 comparied with group D. Abbreviations:
CFR, coronary flow reserve; DM, diabetes mellitus; FFR, fractional flow reserve; IMR, index of microcirculatory resistance; MI, myocardial infarcti on; PCI/CABG, percutaneous coronary intervention/ coronary artery bypass grafting; NSTEMI, non-ST segment elevation Myocardial Infarction.
37 / 61
Table 2. Clinical events in 4 groups, classified according to diabetes mellitus and microvascular disease
Group A Group B Group C Group D
P value*
NonDM & NonCMD NonDM & CMD DM & NonCMD DM and CMD
Per-patient analysis (n=283) 134(47.4) 51(18.0) 71(25.1) 27(9.5)
MACE 3(2.2) 1(2.0) 5(7.0) 5(18.5) 0.006
All cause death 2(1.5) 0(0) 2(2.8) 1(3.7) 0.398
Cardiac Death 1(0.8) 0(0) 2(2.8) 1(3.7) 0.166
MI 1(0.8) 0(0) 1(1.5) 0(0) 0.964
ID-Revascularization 2(1.5) 1(2.0) 3(4.2) 3(11.1) 0.041
Abbreviations: CMD, coronary microvascular dysfunction; DM, diabetes mellitus; ID-Revascularization, Ischemia-driven revascularization; MI, myocardial infarction.
38 / 61 Table 3. Independent predictors of MACE
HR 95%CI P value
Age 0.99 0.93-1.06 0.853
Male 1.53 0.25-9.39 0.645
Hypertension 0.49 0.16-1.49 0.208
Smoking 1.18 0.35-3.98 0.786
Hyperlipidemia 1.51 0.55-4.16 0.427
Syntax score 1.05 0.99-1.11 0.112
Diabetes 5.46 1.56-19.12 0.008
Diabetes mellitus and coronary microvascular dysfunction
NonDM and nonCMD Reference
NonDM and CMD 1.04 0.11-9.58 0.974
DM and nonCMD 3.86 0.92-16.16 0.065
DM and CMD 11.24 2.53-49.88 0.002
Abbreviations: CMD, coronary microvascular dysfunction; DM, diabetes mellitus; MACE, , major adverse cardiac event (a composite of cardiac death, myocardial infarction and ischemia-driven revascularization).
39 / 61
Table 4. General characteristics of study population and target vessels according to presence of DM or CMD
Total Diabetes Non-Diabetes P value CMD Non-CMD P value
Per-patient analysis 283 98(34.6) 185(65.4) 78(27.6) 205(72.4)
General characteristics
Age, yrs 61.95±10.02 63.61±9.82 61.08±10.04 0.043 62.22±10.00 61.85±10.05 0.785
Male 215(76.0) 74(75.5) 141(76.2) 0.895 57(73.1) 158(77.1) 0.482
Hypertension 172(60.8) 73(74.5) 99(53.5) 0.001 44(56.4) 128(62.4) 0.353
Hyperlipidemia 153(54.1) 60(61.2) 93(50.3) 0.079 31(39.7) 122(59.5) 0.003
Current smoker 74(26.2) 23(23.5) 51(27.6) 0.455 19(24.4) 55(26.8) 0.673
Previous MI 17(6.0) 7(7.1) 10(5.4) 0.558 7(9.0) 10(4.9) 0.195
Previous
PCI/CABG 95(33.6) 36(36.7) 59(31.9) 0.412 24(30.8) 71(34.6) 0.538
CMD 78(27.6) 27(27.6) 51(27.6) 1.000 - - -
DM 98(34.6) - - - 27(34.6) 71(34.6) 1.000
Clinical Presentation
Stable angina 88(31.1) 35(35.7) 53(28.7) 0.222 24(30.8) 64(31.2) 0.942
Unstable angina 40(14.1) 14(14.3) 26(14.1) 0.958 12(15.4) 28(13.7) 0.871
NSTEMI& 2(0.7) 0 2(1.1) 0.546 1(1.3) 1(0.5) 0.476
40 / 61
SYNTAX score 10(5,16) 10(6,16) 10(4,15) 0.348 8(3,13) 10(6,16) 0.019
Coronary physiological parameters
Highest IMR of
all target vessels 19.29(14.82,25.83) 20.17(15.00,25.83) 19.00(14.40,25.22) 0.644 32.05(27.21,36.00) 16.97(13.00,20.02) <0.001
FFR > 0.8 206(72.8) 74(75.5) 132(71.4) 0.454 62(79.5) 144(70.2) 0.118
Per-vessel analysis 456 160(35.1) 296(64.9) 97(21.3) 359(78.7)
Quantitative coronary angiography
Reference
diameter 2.92±0.59 2.93±0.62 2.92±0.58 0.882 3.10±0.70 2.87±0.55 0.004
Minimum lumen
diameter 1.86±0.61 1.82±0.64 1.88±0.59 0.263 1.97±0.64 1.83±0.60 0.035
Diameter stenosis 36.76±15.12 38.51±15.95 35.82±14.60 0.070 36.29±14.35 36.89±15.34 0.732
Lesion length 7.84(5.32,13.55) 7.76(5.16,13.95) 7.92(5.46,13.46) 0.957 8.53(5.71,14.10) 7.70(5.16,13.07) 0.283 Coronary physiological
parameters
FFR(pre-PCI) 0.88(0.80,0.94) 0.87(0.81,0.93) 0.88(0.79,0.95) 0.687 0.90(0.83,0.95) 0.87(0.79,0.94) 0.054
CFR 2.85±1.07 2.75±1.05 2.91±1.09 0.151 2.78±1.04 2.87±1.09 0.455
IMR 17.91(13.76,23.05) 18.17(13.55,23.00) 17.35(13.81,23.11) 0.767 31.00(27.20,35.60) 16.00(12.92,19.55) <0.001
Values are n, N/n (%), mean ± SD, n (%), median (interquartil