저작자표시-비영리-변경금지 2.0 대한민국 이용자는 아래의 조건을 따르는 경우에 한하여 자유롭게
l 이 저작물을 복제, 배포, 전송, 전시, 공연 및 방송할 수 있습니다. 다음과 같은 조건을 따라야 합니다:
l 귀하는, 이 저작물의 재이용이나 배포의 경우, 이 저작물에 적용된 이용허락조건 을 명확하게 나타내어야 합니다.
l 저작권자로부터 별도의 허가를 받으면 이러한 조건들은 적용되지 않습니다.
저작권법에 따른 이용자의 권리는 위의 내용에 의하여 영향을 받지 않습니다. 이것은 이용허락규약(Legal Code)을 이해하기 쉽게 요약한 것입니다.
Disclaimer
저작자표시. 귀하는 원저작자를 표시하여야 합니다.
비영리. 귀하는 이 저작물을 영리 목적으로 이용할 수 없습니다.
변경금지. 귀하는 이 저작물을 개작, 변형 또는 가공할 수 없습니다.
A Dissertation for the Degree of Doctor of Philosophy
AHNAK ablation promotes browning of white adipose tissue and counteracts obesity
AHNAK 유전자 결손에 의한 백색지방에서 갈색지방 발생과
항비만 효과 연구
Feburary 2016
By
Jae Hoon Shin, D.V.M.
Department of Veterinary medicine Graduate School
Seoul National University
수의학박사 학위논문
AHNAK ablation promotes browning of white adipose tissue and counteracts
obesity
AHNAK 유전자 결손에 의한 백색지방에서
갈색지방 발생과 항비만 효과 연구
Jae Hoon Shin
(Supervisor: Je Kyung Seong, D.V.M., Ph.D.)
Department of Veterinary Medicine Graduate School
Seoul National University
AHNAK ablation promotes browning of white adipose tissue and counteracts
obesity
지도교수 성 제 경
이 논문을 수의학박사 학위논문으로 제출함
2016 년 2 월
서울대학교 대학원 수의학과 수의해부학 전공
신 재 훈
신재훈의 수의학박사 학위논문을 인준함 2016 년 2 월
위 원 장 윤 여 성 (인) 부위원장 성 제 경 (인) 위 원 배 윤 수 (인) 위 원 구 승 회 (인) 위 원 이 윤 희 (인)
ABSTRACT
AHNAK, a large size-phosphoprotein, plays a crucial role in the cell adhesion, proliferation and calcium signaling. Recently emerging evidence has suggested that AHNAK expression is altered in obese condition.
Nevertheless, the role of AHNAK during adipose tissue development remains unclear. The objective of this study was to determine the molecular mechanism of AHNAK in adipogenesis and glucose homeostasis. In this study, AHNAK KO mice displayed resistance to diet-induced obesity due to reduction of fat accumulation. We found that adipogenesis from adipose derived mesenchymal stem cells (ADSCs) was severely impaired in AHNAK KO mice, which could contribute to whole-body fat accumulation. We also observed that loss of AHANK led to a decreased BMP4/SMAD1 signaling, resulting in decreased expression of key regulators for adipocyte differentiation. AHNAK directly interacts with Smad1 on the PPAR2 transcription activity. Concomitantly, AHNAK KO mice displayed a better degree of metabolic profiles, including improved glucose tolerance, enhanced insulin sensitivity, and higher energy expenditure without alteration in food intake and physical activity. Taken together, Ahnak plays a crucial role in body fat accumulation by regulation of adipose tissue development through interaction with Smad1 protein and can be involved in metabolic homeostasis.
Changes in brown adipose tissue (BAT) activity and energy expenditure through thermogenesis would be a promising therapeutic target against obesity. In adipose tissue, agonists of the3-adrenergic receptor
(ADRB3) regulate lipolysis, lipid oxidation, and thermogenesis. AHNAK deficiency induced thermogenesis in white adipose tissue (WAT) of mice fed high-fat diet, suggesting that AHNAK may stimulate energy expenditure via the development of beige fat. Here, we report that AHNAK deficiency promoted browning and thermogenic gene expression in WAT but not in brown adipose tissue of mice stimulated with the ADRB3 agonist CL- 316243. Consistent with increased thermogenesis, AHNAK KO mice exhibited an increase in energy expenditure, accompanied by elevated mitochondrial biogenesis in WAT depots in response to CL-316243. CL- 316243 activated PKA signaling and enhanced lipolysis, as evidenced by increased phosphorylation of hormone sensitive lipase and release of free glycerol in AHNAK KO mice compared to the wild-type mice. AHNAK deficient WAT contains more eosinophil and type 2 cytokines (IL-4/IL-13) to promote browning of WAT and mitochondrial biogenesis in response to CL. This is associated with enhanced sympathetic tone in WAT via upregulation of adrb3 and tyrosine hydroxylase (TH) expression in AHNAK KO mice in response to-adrenergic activation. Overall, these findings suggest an important role of AHNAK in the regulation of thermogenesis and lipolysis in WAT via -adrenergic signaling.
.
Keywords: Ahnak, obesity, adipogenesis, BMP4/SMAD1, energy expenditure, browning, lipolysis, thermogenesis, β-adrenergic signaling
Student Number: 2009-21627
CONTENTS
Abstract ... i
Contents ... iii
List of figures ... v
List of Table ... viii
Chapter I. Obesity resistance and enhanced insulin sensitivity in Ahnak
-/-mice fed a high fat diet are related to impaired adipogenesis and increased energy expenditure ... 1
1.1. Introduction ... 2
1.2. Materials and Methods ... 7
1.3. Results... 14
1.4. Discussion ... 42
Chapter II. Increased levels of eosinophils and type II cytokines in WAT mediates the browning and thermogenensis in AHNAK KO mice ... 47
2.1. Introduction ... 48
2.2. Materials and Methods ... 52
2.3. Results... 55
2.4. Discussion ... 75
Chapter III. Effect of enhanced -adrenergic and NPs signaling on lipolytic activity in AHNAK KO mice ... 78
3.1. Introduction ... 79
3.2. Materials and Methods ... 82
3.3. Results... 84
3.4. Discussion ... 99
General Conclusion ... 104
Reference ... 105
Abstract in Korean ... 119
List of Figures
Figure 1-1. Structure of AHNAK protein
Figure 1-2. Bone Morphogenetic Protein Pathway Figure 1-3. AHANK expression in adpose tissue
Figure 1-4. AHNAK plays a role in adipogenesis in vitro
Figure 1-5. AHNAK is required for SMAD1/5 activation, which is essential for adipogenic effects caused by BMP4 signaling
Figure 1-6. Effects of AHNAK on SMAD1-dependent Ppar2 transcriptional regulation
Figure 1-7. Role of AHNAK in obesity
Figure 1-8. Effect of AHNAK ablation in fat tissue
Figure 1-9. Resistance to detrimental effect of obesity in AHNAK KO mice Figure 1-10. Serum lipid profiles from AHNAK KO mice
Figure 1-11. AHNAK KO mice exhibit enhanced glucose tolerance and insulin sensitivity
Figure 1-12. Insulin signaling pathway in AHNAK KO mice
Figure 1-13. AHNAK KO mice display increased energy expenditure Figure 1-14. mRNA expression of thermogenic genes in AHNAK KO WAT Figure 1-15. Phenotypic characteristics of BAT in AHNAK KO mice
Figure 2-1. Types of adipose tissue
Figure 2-2. Secreted factors that recruit beige adipocytes
Figure 2-3. AHNAK mRNA expression by qPCR during cold chanllege
Figure 2-4. Browning phenotype of WAT in AHNAK- KO mice under cold exposure
Figure 2-5. Expression of thermogenic related genes in AHNAK KO mice under cold exposure
Figure 2-6. Ablation of AHANK induces white to brown fat transition Figure 2-7. Expression of thermogenic related genes in AHNAK KO mice under CL-challenges
Figure 2-8. Thermogenic gene expression in AHNAK KO mice
Figure 2-9. Measurement of body temperature in AHNAK KO mice after CL challenge
Figure 2-10. Enhanced thermogenesis in AHNAK KO mice after CL challenge
Figure 2-11. Mitochondrial biogensis of WAT in AHNAK KO mice Figure 2-12. Mitochondrial biogensis of BAT in AHNAK KO mice
Figure 2-13. Increased levels of eosinophils and type 2 cytokines in AHANK deficient WAT
Figure 2-14. PDGFRa+ CD44+ progenitor cells in AHNAK deficient eWAT of Cells
Figure 3-1. Major pathways involved in the control of human fat cell lipolysis
Figure 3-2. Enhanced -adrenergic signaling in WAT of AHNAK KO mice Figure 3-3. Expression of -adrenergic receptors in adipose tissue of AHNAK KO mice
Figure 3-4. Lipolysis signaling pathway in WAT of AHNAK KO mice by
-adrenergic signals
Figure 3-5. Lipolysis signaling pathway in BAT of AHNAK KO mice by -adrenergic stimulation
Figure 3-6. Enhanced -adrenergic signaling in WAT of AHNAK KO mice fed a HFD
Figure 3-7. Ex vivo lipolysis in response to b-adrenergic stimulation
Figure 3-8. AHNAK deficiency enhanced lipolysis in adipocytes in vitro in response to -adrenergic stimulation
Figure 3-9. AHNAK deficiency enhanced NPs expression in eWAT in response to -adrenergic stimulation
Figure 3-10. AHNAK deficiency enhanced NPs expression in BAT in response to -adrenergic stimulation
Figure 3-11. AHNAK deficiency enhanced NPs expression in eWAT during fasting condition
Figure 3-12. NPs expression in heart
Figure 3-13. Putative model for parallel activation of 3-AR and NPs in AHNAK deficient WAT
List of Table
Table 1. Sequnece of primer used for real-time quantatitive PCR
Chapter I
Obesity resistance and enhanced insulin sensitivity in Ahnak
-/-mice fed a high fat diet are related to impaired adipogenesis
and increased energy expenditure
(Publishied in 2010, PLoS One)
1.1. Introduction
Figure 1-1. Structure of AHNAK protein.
(http://edoc.hu-berlin.de/dissertationen/petzhold-daria-2007-07- 31/HTML/chapter1.html)
AHNAK, located on human chromosome 11q 12-13, is a giant protein of approximately 700kD in size initially identified in human neuroblastomas and skin epithelial cells (Hashimoto et al., 1995; Shtivelman and Bishop, 1993; Shtivelman et al., 1992). In epithelial cells, AHANK is mainly localized in the nucleus in low calcium concentrations, but an increase in intracellular calcium levels leads to translocation of the protein to the plasma membrane (Nie et al., 2000). AHNAK, as a scaffolding protein, plays an important role in the formation of cytoskeletal structure, calcium homeostasis, and muscle regeneration (Alvarez et al., 2004; Hohaus et al., 2002; Huang et al., 2007). The protein structure of AHNAK contains three main parts (Figure 1-1): N-terminal, central, and C-terminal domain.
PDZ-containing N-terminal domain has 251 amino acids and the carboxyl- terminal includes 1002 amino acid residues which are involved in skeletal muscle regeneration and calcium signaling (Davis et al., 2014; Hohaus et al., 2002). The central domain with 36 central repeated units (CRU) activates phospholipase C-γ1 (PLC γ 1) as well as protein kinase C-α (PKC-α) (Lee et al., 2008; Lee et al., 2004). Moreover, AHANK is involved in plasma membrane differentiation and repair by calcium-induced exocytosis called enlargosome, and functions in brain endothelial cells in maintenance of the integrity of the blood brain barrier (Borgonovo et al., 2002; Gentil et al., 2005).
It had been assumed that deficiency of AHNAK would lead to significant phenotypes since it is implicated in multiple organs.Nevertheless, AHNAK deficiency displayed no overt phenotypes in muscle cells and epidermis of null mutation mice (Komuro et al., 2004; Kouno et al., 2004) A previous study using AHNAK knockout mice has shown that AHANK is required for the activation and proliferation of T cells and calcium influx in CD4+ T cells (Matza et al., 2008). Recent studies suggested that AHNAK plays a crucial role in not only the cell cycle to stimulate the activation of c- raf, MEK, and Erk signaling in mouse embryonic fibroblast cells (MEF), but also the activation of Erk and Rac in PDGF-dependent migration of mouse aortic smooth muscle cells (ASMC) (Lee et al., 2008; Lim et al., 2013). Furthermore, it has also been suggested that AHNAK is a tumor suppressor as an important component of TGFβ/Smad signaling pathway (Lee et al., 2014).
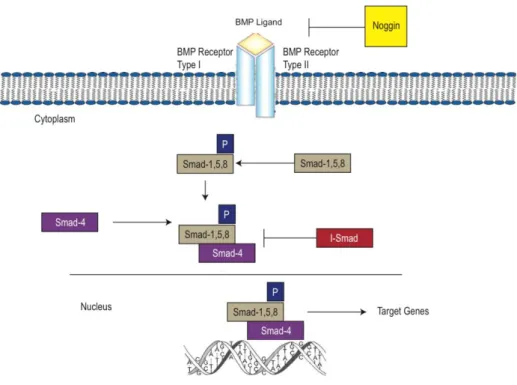
Figure 1-2. Bone Morphogenetic Protein Pathway. (Hyun et al. INTECH Open Access Publisher, 2011)
White adipose tissue (WAT) is important for maintaining energy balance, storing calories in the form of lipids, and supplying energy sources in response to hormonal stimulation(Rosen and Spiegelman, 2006). We first reported that AHNAK KO mice are protected from diet-induced obesity due to alteration of metabolomic profiles in urine and blood between high fat- fed wild-type and AHNAK KO mice (Kim et al., 2010). This finding was
reconfirmed by Ramdas et al. (Ramdas et al., 2015). In addition, Li et al.
showed upregulation of AHNAK in the adipose tissue of diet-induced obesity rat models (Li et al., 2002). However, the molecular mechanism of AHNAK during adipogenesis remains unclear.
Bone morphogenetic proteins (BMPs) are important regulators of proliferation, apoptosis and differentiation during various developmental processes (Chen et al., 2004; Margoni et al., 2012). Several evidences have suggested that BMP signaling promote cell fate determination in the mammalian systems (Kang et al., 2008; Schulz and Tseng, 2009; Zhao, 2003). The effects of BMP2 and -4 in the mesenchymal stem cell line C3H10T1/2 induce commitment to preadipocyte and promote adipogenic differentiation (Huang et al., 2009; Tang et al., 2004; Wang et al., 1993).
BMP signal trasnduction stimulates phophorylation of Smad1/5/8. The heterodimeric complex Smad1/5/8 and Smad4 translocates the nucleus and modulate the transcriptional activity of C/EBP family and PPARγ (Figure 1- 2) (Huang et al., 2009; Rosen and MacDougald, 2006; Zamani and Brown, 2011).
It was proposed that AHNAK regulates cell growth by mediating TGF/Smad signaling (Lee et al., 2014). Studies have shown that bone morphogenetic proteins (BMPs), members of the transforming growth factor
(TGF) are involved in adipocyte differentiation and Smad family plays important roles in BMP/TGF signaling (Huang et al., 2009; Rosen and MacDougald, 2006; Zamani and Brown, 2011). The present study aimed to elucidate the molecular mechanism leading to impaired adipogenesis in Ahnak KO which have been subjected to enhanced metabolic features.
Furthermore, we demonstrate the critical role of Ahnak in adipogenesis via regulation of the BMP4/Smad1 pathway.
1.2 . Materials and Methods
Animals
Ahnak knockout mice were generated by disruption of exon 5 in the Ahnak gene, as previously described (Lee et al., 2008). AHNAK-KO (Ahnak-/-) mice were obtained by crossing heterozygous breeders. 6-week-old male KO and wild-type mice were fed either a regular chow (RC) diet or a high fat diet (HFD; 20% carbohydrate, 60% fat, 20% protein; D12492; Research Diets Inc., New Brunswick, NJ, USA). Mice were maintained under a 12-h light-dark cycle and had free access to water in a specific pathogen-free barrier facility. Mice were randomly assigned. These procedures were approved by the Institutional Animal Care and Use Committee of Seoul National University (Permit Number: SNU-201004-14) in accordance with the Principles of Laboratory Animal Care (NIH publication no. 85–23, revised 1985).
Cell culture, reagents, and plasmids
Murine 3T3-L1 and C3H10T1/2 cells were kindly provided as a gift by Dr.
Jae Woo Kim (Yonsei University, Seoul, South Korea)(Bowers et al., 2006;
Lee et al., 2012a). Cells were differentiated into mature adipocytes as described (Bowers et al., 2006), with modifications. Flag-Ahnak (N-terminal, amino-acid residues 1-150) and HA-Smad1(Liu et al., 1996) expression vectors were purchased from GeneCopoeia (Rockville, MD, USA) and Addgene, respectively. C3H10T1/2 cells were transfected directly with total
of 4㎍ plasmid DNA using Lipofectamine LTX with Plus reagent (Invitrogen, Carlsbad, CA, USA) according to the manufacturer's protocol.
FlexiTube small interfering RNA (siRNA) directed against murine Ahnak mRNA (accession no. NM_001039959) was from Qiagen. siRNA transfections were performed with Lipofectamine RNAiMAX (Invitrogen), according to the manufacturer’s protocol. AllStars Negative Control siRNA was obtained from Qiagen (Hilden, Germany).
Isolation and expansion of adipose-derived stem cells (ADSCs)
The establishment of wild-type (WT) and AHNAK-KO ADSCs isolated from epididymal and inguinal WATs of 8–10-week-old mice was described previously (Rajkumar et al., 1999; Yamamoto et al., 2007). Briefly, adipose tissue was minced and digested with 0.75 mg/ml collagenase (Wako Pure Chemical Industries, Ltd., Osaka, Japan) for 2 h at 37°C. Cells were added to RBC lysis buffer (eBioscience, San Diego, CA) and filtered through a 100-m cell strainer (BD Falcon, Franklin Lakes, NJ, USA) to generate single-cell suspensions. Cells were diluted to 1 × 10⁵ cells/cm2 in DMEM/F12 medium (Gibco, pH 7.4) containing 10% FBS and maintained in 5% CO2 at 37°C.
Immunostaining
ADSCs were grown on chamber slides and exposed to BMP4 for 1 hour.
Cells were fixed and then permeabilized in 0.25% Triton-X 100 at room temperature for 10 min. After washing with PBS, the cells were blocked with 10% normal goat serum. For nuclear staining, the samples were coverslipped in mounting medium with DAPI (Immunobioscience). Images
were captured using a confocal microscope system (LSM 710, Carl Zeiss).
In situ proximity ligation assays
The interactions between AHANK and SMAD1 were determined by performing DuolinkTM in situ proximity ligation assays (PLAs; Sigma), according to the manufacturer's instructions. HEK293 and C3H10T1/2 cells were stimulated with BMP4 (25 ng/ml) or not stimulated and then fixed, permeabilized, and incubated with a mouse anti-AHNAK monoclonal antibody in combination with a polyclonal rabbit anti-SMAD1 antibody, followed by incubation with secondary antibodies conjugated to PLA probes.
Cellular viability assay
The cell viability was examined by using an EZ-Cytox Cell viability assay kit (Daeil Lab Service, Seoul, Korea). The relative cell viability was determined by measuring the absorbance at 450 nm using a Tecan microplate reader.
Immunoblotting and immunoprecipitation experiments
For immunoblot analysis, cells were lysed in PRO-PREP buffer (iNtRON Biotechnology Inc., Seoul, Korea) containing a phosphatase-inhibitor cocktail (GenDEPOT, Barker, TX, USA). Protein extracts were separated by sodium dodecyl sulfate-polyacrylamide gel electrophoresis, transferred to a polyvinylidene fluoride membrane (Millipore, Billerica, Massachusetts, USA), and subjected to immunoblot analysis. Cytosolic and nuclear fractions used in immunoblot analysis were prepared using the NE-PER Nuclear and Cytoplasmic Extraction Kit (Thermo Scientific, Rockford, IL, USA), according to the manufacturer's instructions. For
immunoprecipitation experiments, lysates were immunoprecipitated with an anti-HA antibody at 4ºC overnight. Immunocomplexes were washed three times with lysis buffer (1% Triton X-100, 20 mM HEPES at pH 7.5, 150 mM NaCl, 12.5 mM, 10% glycerol, 5 mM EDTA, proteinase inhibitor cocktail (GenDEPOT), and a phosphatase inhibitor), mixed with 2X sample buffer, and separated from the protein A/G agarose beads (Santa Cruz) by boiling. Immunoblot analysis was performed using the indicated antibodies.
Proteins were visualized by ECL chemiluminescence (AbClon, Seoul, Korea). GAPDH was detected as a loading control. Immunoreactive signals were detected through their enhanced chemiluminescence and recorded using the MicroChemi 4.2 system (DNR Bio-Imaging Systems, Jerusalem, Israel).
Antibodies
The primary antibodies used for western blot analysis were specific for:
pSMAD1/5, SMAD1, SMAD4, PPARγ, LAMIN B1, GAPDH (Cell Signaling Technologies), C/EBPβ, AHNAK (Abcam, Cambridge, UK), and GAPDH (all from Cell Signaling Technology, Beverly, MA, USA). The antibodies used for immunoprecipitation experiments were AHNAK (Abcam) and SMAD1 (Cell Signaling). A peroxidase-conjugated secondary antibody (Abclon) was also used. Anti-SMAD1/5 (Abcam) and anti- pSmad1/5 (Millipore) antibodies were used for immunostaining. Following secondary antibodies were used: Alexa Fluor 488- or 594-conjugated antibody. DAPI (ImmunoBioScience Co., Washington, USA) was used for nuclear staining.
Metabolic assays
For glucose-tolerance tests (GTTs), mice were fasted for 16 h and injected intraperitoneally with 1.5 mg of glucose/g of body weight. For insulin- tolerance tests (ITTs), mice were fasted for 6 h and injected intraperitoneally with insulin (Humulin R; Eli Lilly, Indianapolis, IN) at 1 unit/kg of body weight.
Basal study
A comprehensive animal metabolic monitoring system (CLAMS; Columbus Instruments, Columbus, OH) was used to evaluate activity, food consumption, and energy expenditure before and after HFD feeding. Energy expenditure and food intake data were normalized with respect to lean body weight. Energy expenditure and RQ were calculated from the gas exchange data.
Body composition
Fat and lean body masses were assessed by 1H magnetic resonance spectroscopy (Bruker BioSpin, Billerica, MA) before and after mice were subjected to an HFD.
Quantitative PCR (qPCR) analysis
Total RNA was extracted using a total RNA purification system (Invitrogen) following to the manufacturer’s protocol. Extracted mRNA was reverse- transcribed using AccuPower® CycleScript RT PreMix (Bioneer).
Quantitative PCR was performed with SYBR Green dye using the ABI Step One Real Time PCR instrument (Applied Biosystems, Cheshire, U.K.). For relative quantification of gene expression, we used the comparative Ct method (ΔΔCt). Results were normalized to the control gene (36B4). The
specific primers sequences used for PCR are listed in Supplementary Table 1.
Biochemical assay
Serum epinephrine was determined using a commercially available ELISA kit according to the manufacturer’s instructions (Abnova, Taipei, Taiwan).
Serum triglyceride, total cholesterol, HDL-cholesterol and LDL-cholesterol concentrations were analyzed by Cobas c111 (Roche). Adipokines, including adiponectin, leptin, IL-6, MCP1, PAI-1, and TNF-α were measured using MILLIPLEX™ MAP kits (Merck Millipore, Germany) according to the manufacturer’s instructions.
Oil red O staining
Oil red O staining was performed on day 8 following adipogenesis induction.
Cells were washed and fixed with 4% paraformaldehyde. The cells were then washed with 60% isopropanol, dried completely, and stained with oil red O (6 parts of 0.5% oil red O powder in isopropanol and 4 parts water) for 10 min and washed with phosphate-buffered saline.
GEO search for AHNAK expression
We used the GEO (Gene Expression Omnibus) database to assess AHNAK expression differences in obesity. In this study, we used only GEO dataset (GDS)- samples that were already curated. Those datasets contained normalized expression values for each gene from each sample. Total 30 GDS samples were searched in GEO. The differential expression of the Ahnak gene was identified by t-test method and a P value < 0.05.
Statistics
All values were expressed as the mean± SEM. Statistical analysis was performed using the Student’s t-test between two groups. P<0.05 was considered significantly.
1.3. Results
1.3.1. Requirement of AHNAK for adipocyte differentiation in vitro
To study the potential correlation between AHNAK expression and obesity in humans, we analyzed existing GEO data. AHNAK expression was significantly increased in both subcutaneous mature adipocytes (GDS 1495, P<0.01) and omental adipose tissues (GDS 3688, P<0.05) from obese subjects (Figure 1-3A). The AHNAK mRNA levels in normal (B6) and obese (Ob/Ob) mice markedly increased in the SVF of WAT, which contains multipotent mesenchymal stem cells (Figure 1-3B). AHNAK expression was also decreased during adipocyte differentiation in 3T3-L1 cells (Figure 1-3C), where fully differentiated cells contained mainly adipocytes.
C3H10T1/2 cells transfected with AHNAK-specific siRNA, were stained with oil red O to examine lipid accumulation (Figure 1-4A,B). We found that the expression of C/ebp family members Ppar2, aP2, and adiponectin significantly decreased during adipogenesis following AHNAK silencing, relative to that observed in control-siRNA transfectants (Figure 1-4C).
Consistently, ADSCs from KO mice showed significantly inhibited formation of lipid-containing adipocytes (Figure 1-4D). The adipogenic markers were significantly suppressed in AHNAK deficient ADSCs (Figure 1-4E). Formation of lipid-laden droplets was apparently reduced in fully differentiated 3T3-L1 cells by transfection with AHANK-specific siRNA (Figure 1-4F). Thus, AHNAK expression in the SVF in WAT may explain
the low efficiency of mature adipocyte differentiation observed in AHNAK- deficient mesenchymal stem cells and the reduced adiposity of AHNAK KO mice.
Figure 1-3. AHANK expression in adipose tissue.
(A) AHNAK expression of obese human subjects. (B) mRNA expression of AHNAK in the adipocyte fraction (Ad) and stromal vascular fraction (SVF) of eWATs (n=4). (C) mRNA expression of AHANK during adipogenesis in 3T3-L1 cells. The data shown are means±SEM, *P<0.05, **P<0.01, ***P<0.001 between WT and KOmice.
B C
F
Figure 1-4. AHNAK plays a role in adipogenesis in vitro.
(A) C3H10T1/2 cells were transfected with control siRNA and AHANK siRNA. (B) C3H10T1/2 cells underwent adipocyte differentiation, as determined by oil red O staining. (C) Expression levels of adipogenic genes were measured by qPCR. All genes were normalized to 36B4. (D) Representative pictures showing differentiated ADSCs stained with oil red O at day 8 after the induction of differentiation. (E) Immunoblot analysis of adipogenic proteins from differentiated cells. GAPDH was used as a loading control. (F) 3T3-L1 cells were transfected with siRNA before differentiation induction and subsequently stained with oil red O.
1.3.2. AHNAK is required for SMAD1/5 activation, which is essential for BMP4-dependent adipogenic differentiation
BMP signaling induces the commitment of mesenchymal stem cells into preadipocytes (Huang et al., 2009; Tang et al., 2004). SMAD1/5/8 phosphorylation is critical for BMP4-mediated transcriptional regulation and subsequent commitment to adipocyte differentiation. Thus, we examined whether AHNAK is required for BMP4 signaling. Control C3H10T1/2 cells and ADSCs treated with recombinant BMP4 showed increased SMAD1/5 phosphorylation in a time-dependent manner (Figure 1- 5A,B). However, in AHNAK-deficient C3H10T1/2 cells and ADSCs, BMP4-induced SMAD1/5 phosphorylation was repressed (Figure 1-5A,B).
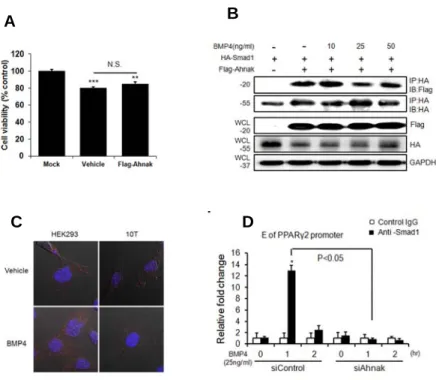
Importantly, nuclear pSMAD1/5 translocation occurred following BMP4 treatment in WT ADSCs, but not in KO ADSCs (Figure 1-5C,D). AHNAK protein is also translocated into nucleus following BMP4 stimulation (Figure 1-5E). In addition, the expression of SMAD4, a co-SMAD that binds to R-SMADs such as SMAD1/5/8 to form an active SMAD complex, was suppressed in AHNAK-KO ADSCs after BMP4 treatment, compared to that in WT ADSCs. The early adipogenic transcription factor C/EBPβ showed a similar trend in terms of expression (Figure 1-5C). Our data suggested that the AHNAK protein potentiates BMP4 signaling by interacting with SMAD1. To study this potential interaction, Flag-Ahnak and HA-Smad1 expression vectors were co-transfected into C3H10T1/2 cells and subjected to co-immunoprecipitation with an anti-HA antibody. The transfection of Flag-Ahnak expressed vector had no effect on cell viability (Figure 1-6A). These results indicated that AHNAK interacted with SMAD1
in a BMP4-independent manner (Figure 1-6B). Moreover, a proximity ligation assay (PLA) using AHNAK and SMAD1 probes showed that AHNAK-SMAD1 complexes were detected as fluorescent spots, both in BMP4-treated and vehicle-control cells (Figure 1-6C). BMP2/4-SMAD signaling induced adipogenic commitment, which regulates PPAR
expression (Hata et al., 2003; Huang et al., 2009). We thus evaluated the effects of AHNAK on SMAD1-dependent Ppar2 transcriptional regulation using a chromatin immunoprecipitation (ChIP) assay. The ChIP complex detected with an anti-SMAD1 antibody revealed significantly increased association with the Smad-binding element (SBE) in the Ppar2 promoter following BMP4 treatment in control siRNA-transfectants. However, Ahnak-downregulated cells did not exhibit a SMAD1-bound Ppar2 promoter DNA fragment (Figure 1-6D). These results indicate that AHNAK is required for SMAD1 activation and SMAD1 binding to the Ppar2 promoter.
Figure 1-5. AHNAK is required for SMAD1/5 activation, which is essential for adipogenic effects caused by BMP4 signaling. (A, B) Following BMP4 stimulation of C3H10T1/2 cells (A) and ADSCs (B) for the indicated times, the levels of indicated proteins were measured by immunoblotting. (C) Following BMP4 treatment for 1h, cell lysates from ADSCs were subjected to nuclear and cytoplasmic fractionation. Proteins from each fraction were studied by immunoblot
E
analysis. LAMIN B1 and GAPDH were used as nuclear and cytoplasmic markers, respectively. (D) Immunofluorescence staining showing the subcellular localizations of SMAD1/5 in ADSCs. DAPI was used for nuclear staining. (E) The subcellular localizations of Ahnak in C3H10T cells. DAPI indicates nuclear staining.
Figure 1-6. Effects of AHNAK on SMAD1-dependent Ppar2 transcriptional regulation.
(A) Cell viability following transfection of Flag AHANK expressed vector in C3H10T cells. *P<0.05, **P<0.01, ***P<0.001 vs Mock.(B) C3H10T1/2 cells were transfected with plasmids expressing Flag-AHNAK and HA-SMAD1, after which the cells were incubated without or with BMP4 for 60 min. (C) Interaction between AHANK and SMAD1. The AHNAK-SMAD1 complexes were detected as spots in situ Duolink PLA. (D) DNA-protein complexes from C3H10T1/2 cells were immunoprecipitated with an anti-SMAD1 antibody or a control IgG. Enrichment of the DNA fragment containing SMAD-binding sites on the Ppar2 promoter was evaluated by qPCR. The data shown are the mean values ± SEM, *P<0.05, **P<0.01, ***P<0.001 vs Mock.
A B
C D
1.3.3. AHNAK ablation attenuates adiposity in mice
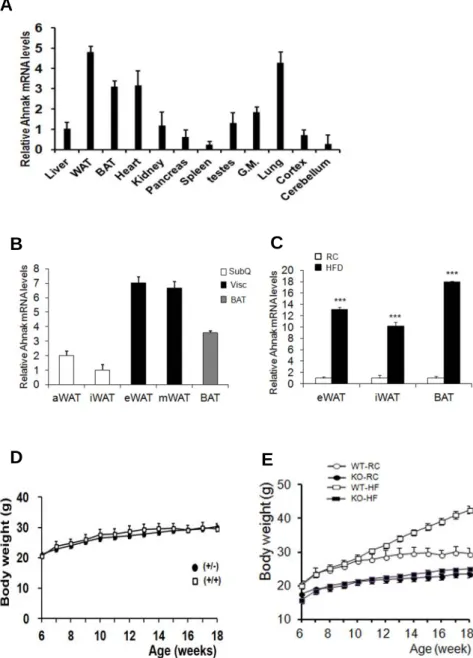
The tissue distribution of Ahnak was examined in C57BL/6 mice by qPCR analysis. AHNAK mRNA was abundantly expressed in white adipose tissue (WAT), brown adipose tissue (BAT), heart, and lung tissue (Figure 1-7A).
To determine the expression of AHNAK in different fat depots, multiple adipose tissues were classified as visceral (vis), subcutaneous (subQ) and brown fat (BAT). Notably, AHNAK was significantly increased in two visceral fat (epididymal, and mesenteric) compared to subQ and BAT (inguinal and axillary) (Figure 1-7B). AHNAK gene expression was significantly elevated in BAT, epididymal (eWAT) and inguinal (iWAT) fat depot in a high fat diet (HFD) fed mice compared to mice fed a regular chow (RC) diet (Figure 1-7C). To elucidate the physiological role of AHNAK in vivo, we maintained Ahnak-/- (KO), Ahnak+/- (hetero) mice, and WT littermates. No differences in body weights were observed between WT and hetero mice (Figure 1-7D). However, at 18 weeks of age, Ahnak KO mice had gained markedly less weight, compared to theWT controls fed either RC or an HFD (Figure 1-7E). Furthermore, AHNAK KO mice had significantly reduced body fat contents and major fat pads of KO mice were significantly smaller than those of WT mice (Figure 1-8A, B). Adipocytes in KO mice contained a higher frequency of small adipocytes and a lower frequency of mid- and large-sized adipocytes than their WT counterparts (Figure 1-8C). In agreement, the expression of adipogenic-related genes such as Pparγ2, a key regulator of adipogenesis; aP2, a late adipocyte differentiation marker; and adiponectin, were reduced in eWAT from HFD-
fed KO mice compared to WT mice. Furthermore, the expression of genes related to lipid metabolism, including Dgat2, Plin2, CD36, Lpl, and Hsl was significantly decreased in eWATs from HFD-fed KO mice (Fig. 1-8D).
Figure 1-7. Role of AHNAK in obesity. (A) AHNAK expression in various tissues from 6-week-old C57BL6 mice (n=4–6). Values were normalized to Gapdh.
(B) AHNAK mRNA expression by qPCR analysis from multiple adipose tissues A
B C
D E
from 10-to12-week old male wild-type mice(n= 4) and normalized to 36B4. (C) AHNAK mRNA in epididymal WAT, inquinal WAT and BAT from wild-type mice fed RC or HFD (n=5-7 per group). (D) Comparison of body weights from wild type (Ahnak+/+) and hetero( Ahnak+/-) mice (n=3). (E) Changes in body weights during 12 weeks of feeding on RC or an HFD; n = 3 for WT and KO mice on regular chow diet (RC), n = 4 for WT and KO mice on HFD.
Figure 1-8. Effect of AHNAK ablation in fat tissue.
D
A B
C
(A) Changes of body composition of WT and KO mice fed HFD analyzed by MRS (n=7-9). (B) Representative pictures of fat pads from mice fed an HFD. (C) H&E staining (left) of eWAT and distribution of adipocyte sizes (right); n=3 Scale bar, 200µm. (D) Relative mRNA levels of the indicated genes in WATs were measured by qPCR. Values were normalized to 36B4.
WT: n=5, KO: n=8 The data shown are the mean±SEM. *P<0.05, **P<0.01,
***P<0.001 between WT and KOmice. eWAT, epididymal white adipose tissue.
1.3.4. AHNAK KO mice are resistant to detrimental effect of
obesity
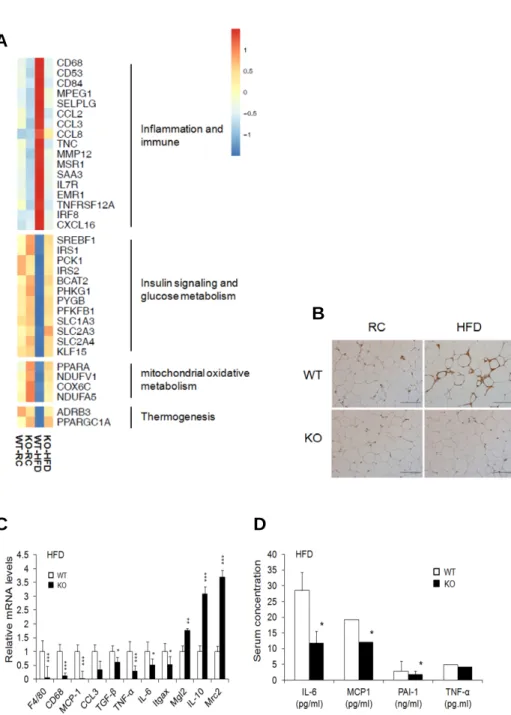
Gene profiling of eWAT from HFD fed AHNAK KO mice showed downregulation of inflammation mediated genes. On the other hands, insulin signaling, glucose metabolism, and thermogenic related genes are increased in AHNAK KO mice (Figure 1-9A). Consistent with gene profile analysis, macrophage infiltration in adipose tissue was evaluated by immunohistochemical staining using Mac-2 antibody. AHNAK KO mice showed less abundant macrophage infiltration (Figure 1-9B). To determine the source of this signal, we investigated inflammation related gene expression. Expression levels of inflammatory genes, such as CD68, F4/80, monocyte chemoattractant protein-1 (MCP1), IL6, and TNF-α were significantly down-regulated in eWAT of HFD-fed AHNAK KO mice with activation of M2 macrophage specific transcripts, including macrophage galactose N-acetyl-galactosamine specific lectin 2 (Mgl2), mannose receptor, C type 2 (Mrc2) and IL10 (Lumeng et al., 2007; Yadav et al., 2011)(Figure 1-9C). AHANK ablation was also accompanied by a significant reduction of proinflammatory mediators such as IL-6, MCP-1, and PAI-1 in serum, as observed for adipose tissues (Figure 1-9D).
To assess the systemic effect of reduced adiposity in AHNAK KO mice, we measured lipid metabolism parameters in serum. The triglyceride levels were reduced in KO mice, although the FFA levels remained unchanged (Figure 1-10A,B). The levels of total and LDL-cholesterol were substantially decreased in HFD-fed KO mice (Figure 1-10C,D). Next, we
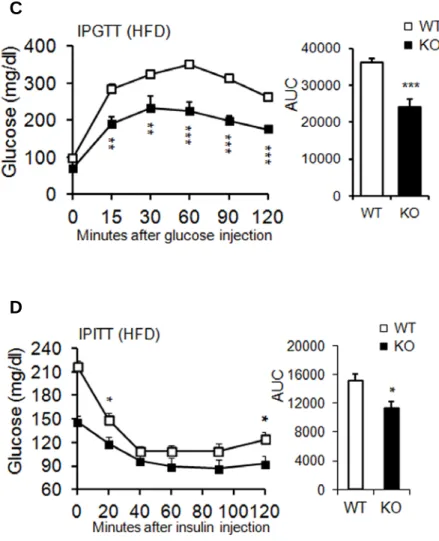
performed intraperitoneal GTT to determine the ability to clear glucose, with blood samples from RC- and HFD-fed mice. Glucose tolerance and insulin sensitivity were not significantly different in RC-fed mice (Figure 1- 11A,B). However, KO mice fed an HFD displayed lower blood glucose levels under fasting conditions and after glucose administration (Figure 1- 11C) than did WT mice. ITTs revealed that the blood-glucose lowering effect of insulin was slightly better in KO mice (Figure 1-11D). Key mediators of insulin signaling were examined to clarify the mechanisms of improved glucose metabolism in KO mice fed a HFD. The phospho-AKT levels in WAT, BAT, and gastrocnemius muscle, and phospho-IRb levels in liver increased in HFD-fed KO mice after insulin stimulation (Figure 1- 12A-D). Taken together, these results indicated that AHNAK-deficiency caused reduced adiposity and increased glucose tolerance and insulin sensitivity.
Figure 1-9. Resistance to detrimental effect of obesity in AHNAK KO mice.
(A) Representative gene expression profiles displaying differentially expressed A
C D
B
gene in eWAT from RC-or HFD-fed WT and KO mice (full dataset available online as NCBI GEO data set GSE37218). (B) Representative pictures of immunostaining of eWAT with antibody to Mac-2 (C) mRNA expression of inflammatory-related genes in mice fed HFD (n = 6-9). (D) Serum biochemistry of inflammatory profiles in overnight fasted mice fed HFD (n=5-9).
Figure 1-10. Serum lipid profiles from AHNAK KO mice.
(A) Serum triglyceride. (B) FFA. (C) Total cholesterol. (D) LDL-cholesterol in WT and KO mice on an HFD. Serum levels were measured after a 16-h fasting period;
n = 9/group (a-d). The data shown are the mean±SEM. *P<0.05, **P<0.01,
***P<0.001 between WT and KOmice.
A
B
Figure 1-11. AHNAK KO mice exhibit enhanced glucose tolerance and insulin sensitivity.
(A) Glucose tolerance after feeding on RC; WT: n=6, KO: n=4. (B) Insulin tolerance after of feeding on RC; WT: n=4, KO: n=6. (C) Glucose tolerance after an 8-week HFD; n = 9 for WT and n = 6 for KO mice. (D) Insulin tolerance after an 8-week HFD; n = 6 for WT and n = 6 for KO mice. The data shown are the mean values ± SEM, *P<0.05, **P<0.01, ***P<0.001 between WT and KOmice.
C
D
Figure 1-12. Insulin signaling pathway in AHNAK KO mice.
HFD fed AHNAK KO mice and WT littermates were fasted overnight and then administered insulin (1.5U/Kg fo body weight) intraperitoneally. (A) eWAT, (B) liver, (C) BAT, and (D) gastrocnemius muscle (GM) were removed 10min after insulin injection.
A B
C D
1.3.5. AHNAK KO mice show increased energy expenditure
Changes in body weights often correlate with energy-balance alterations.
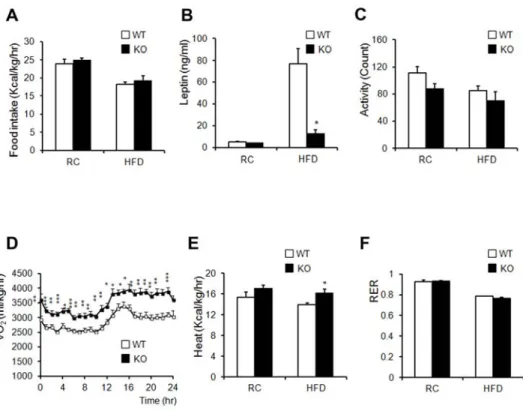
The amount of calorie uptake/h in both RC- and HFD-fed mice was unaltered when normalized to body weight (Figure 1-13A). Serum leptin levels decreased in HFD-fed KO mice, despite their similar food intake (Figure 1-13B). These data suggested that leptin sensitivity was enhanced in KO mice and that the reduction in leptin levels in KO mice resulted from a reduction in fat mass, as leptin levels are associated with fat mass (Maffei et al., 1995). Despite similar food intake levels between the two groups, KO mice showed greater leanness and resistance to HFD-induced obesity. We thus hypothesized that KO mice have an increased metabolic rate or physical-activity rate. KO mice showed a slightly decreased level of activity (Figure 1-13C). Oxygen consumption and heat generation in KO mice were significantly increased compared to those of WT controls (Figure 1-13D,E).
The RER remained unchanged in both groups (Figure 1-13F).
To confirm the effect of AHNAK ablation in WAT and BAT, we analyzed thermogenic gene expression profiles by qPCR. Thermogenic related genes, including Ucp1, Pgc-1, Cidea, Cpt2, and Adrb3, were significantly increased in eWAT and iWAT of HFD-fed AHNAK KO mice (Figure 1-14A,B). Notably, ablation of AHANK leads to upregulation of Adrb3 expression, which is essential for the regulation of adaptive thermogenesis and oxidative metabolism (Lowell and Bachman, 2003).
Furthermore, histologic evaluation of BAT displayed slightly reduced lipid- droplet accumulation in KO mice, compared to that in WT mice fed either
RC or an HFD (Figure 1-15A). However, the BAT weights between the two groups were comparable (Figure 1-15B). The expression of thermogenic genes was unaffected in BAT of KO mice fed a HFD, compared with that of WT mice (Figure 1-15C). These findings suggest that AHNAK ablation in WAT protects mice from obesity and its related complication accompanied by elevating energy expenditure.
Figure 1-13. AHNAK KO mice display increased energy expenditure.
(A) Food intake (WT: n = 6, KO: n = 5). (B) Serum leptin concentrations (n=4).
(C) Measurement of locomotor activity (WT: n=6, KO: n=5). (D) Whole-body oxygen consumption (VO2) over the course of 24 h (WT: n=6, KO: n=5). (E) Average value of heat generation (WT: n=6, KO: n=5). (F) The respiratory exchange rate was calculated as CO2 production/O2 consumption (WT: n=6, KO:
n=5). (G) Relative mRNA expression of genes involved in energy dissipation and in brown adipose-specific genes in WAT, as measured by qPCR (n=6). Values were normalized to 36B4 expression. The data shown are the mean±SEM; *P<0.05,
**P<0.01, ***P<0.001.
Figure 1-14. mRNA expression of thermogenic genes in eWAT (A) and iWAT (B) from HFD fed WT and KO mice (n=5). The data are presented as the means
± SEM. *P < 0.05, **P < 0.01, ***P < 0.001, wild-type (WT) versus Ahnak-/- (KO) mice.
A
B
Figure 1-15. Phenotypic characteristics of BAT in AHNAK KO mice.
(A) H&E staining of BAT. Scale bar, 200 µm; (B) Quantification of BAT mass (left) and BAT mass normalized by body mass (right); WT: n=5, KO: n=4. (C) Relative mRNA expression involved in energy dissipation and brown adipose specific genes in BAT measured by qPCR from mice fed an HFD for 12 weeks (n=5). Values were normalized to 36B4 expression. The data shown are means±SEM; *P<0.05, **P<0.01, ***P<0.001
B A
C
1.4. Discussion
The physiological functions of AHNAK in adipose tissues have been unclear, although AHNAK is highly expressed in WAT. Here, we provide evidence that AHNAK acts as a critical regulator of adipogenesis in vitro and in vivo. Studies on the role of Ahnak in adipose tissue have reported conflicting results. Alli and coworkers claimed that decreased AHNAK1 expression observed during adipocyte differentiation in 3T3-L1 cells indicated that AHNAK negatively regulates adipogenesis (Alli and Gower, 2009). In contrast, AHNAK gene expression was increased 6-fold in adipose tissue during early-phase obesity in rats (Li et al., 2002). Previous findings have demonstrated elevated AHNAK levels in WAT from mice with genetically or environmentally induced obesity (Li et al., 2002;
Ramdas et al., 2015). Consistent with previous murine-model studies, AHNAK expression significantly increased in the fat tissues of obese human subjects.
Loss of AHNAK resulted in lowered fat-cell formation due to suppressed SMAD1/5 phosphorylation and nuclear translocation. Our results indicated that AHNAK regulates adipocyte differentiation by modulating BMP-induced canonical SMAD signaling. SMAD1 inactivation in AHNAK-deficient ADSCs led to impaired Ppar2 transcription. Our data indicate that AHNAK is required for adipocyte differentiation via SMAD11 binding to the Ppar2 promoter following BMP4 stimulation. Similar to AHNAK, SCHNURRI-2 interacts with SMAD1 and controls adipogenesis
through Ppar2 transcriptional activation (Jin et al., 2006). Although additional studies are required to elucidate the function of AHNAK- dependent SMAD1 signaling in adipose hypertrophy in vivo, previous evidence has shown that BMP/SMAD signaling promotes adiposity by Tob2 expression in mice (Takahashi et al., 2012).
Adipose tissue is composed of adipocytes and the stromal vascular fraction, which contains preadipocytes, mesenchymal stem cells, endothelial cells, and macrophages (Riordan et al., 2009). Adipocyte precursor cells in the stromal vascular fraction are capable of differentiation into mature adipocytes (Rodeheffer et al., 2008). BMPs have crucial roles in cell fate- determinations of multipotent mesenchymal stem cells (Gesta et al., 2007).
BMPs regulate gene expression of Runx2, Ppar2, Sox9, and MyoD, which are master regulators of lineage determination that control embryogenesis and organogenesis (Blitz and Cho, 2009; Pan et al., 2008; Phimphilai et al., 2006; Reshef et al., 1998; Zehentner et al., 1999; Zhao, 2003). Together, these findings imply that AHNAK present in the stromal vascular fraction of adipose tissue may explain the decreased AHNAK levels observed during adipogenesis, as well as the restricted adipogenic commitment and differentiation in AHNAK-KO mice. However, it remains unclear how AHNAK controls BMP4/SMAD1 signaling during mesenchymal differentiation into other cell types, such as the osteogenic, chondrogenic, and myogenic lineages. Furthermore, it would be interesting to determine whether AHNAK regulates BMP4 signal transduction via other inhibitory mechanisms such as BMP receptors, I-SMAD (SMAD6/SMAD7), or ubiquitination.
Previous studies reported that AHNAK activates PLC-1-PKCa and contributes to mitogenic signaling in response to growth factors (Lee et al., 2008; Lee et al., 2004). The AHNAK protein controls cell cycle progression through c-MYC, which is highly expressed in AHNAK deficient MEF cells (Lee et al., 2014). Cell proliferation, arrest, cell-cycle re-entry, and differentiation by hormonal stimulation are crucial processes during adipogenesis (Fajas, 2003). Consistently, increased levels of c-MYC lead to the inhibition of adipocyte differentiation by blocking cell cycle arrest in 3T3-L1 cells (Reichert and Eick, 1999). Therefore, it would be interesting to uncover the link between AHNAK and c-MYC in 3T3-L1 cells, which are committed to an adipogenic lineage.
While we focused on the role of AHNAK in adipogenesis, our data also implicate AHNAK in energy and glucose homeostasis. Recent evidence showed that AHNAK expression inversely correlates with oxygen consumption (Parikh et al., 2008b). Whole-body oxygen consumption and energy expenditure were significantly elevated in HFD-fed KO mice accompanied by increased levels of thermogenesis-related genes (Ucp1, Dio2, and Adrb3) and oxidation-related genes (Pparα and Pparβ/δ) in WAT, but no difference was found in BAT, which mainly controls heat generation.
Adiposity influences systemic insulin resistance (Griffith et al., 2010). Here, we demonstrated that AHNAK KO mice are protected against HFD-induced insulin resistance, with reduced fat accumulation. A recent study showed that mice lacking AHNAK were glucose intolerant (Ramdas et al., 2014), and we also found that HFD-fed AHNAK-KO mice displayed markedly lower fasting insulin levels (Fig. 5G). This reduction suggests that the
increased glucose tolerance in AHNAK-KO mice was attributable to insulin sensitivity. Furthermore, our hyperinsulinemic/euglycemic clamp experiments revealed that HFD-fed AHNAK-KO mice displayed increased insulin-mediated suppression of hepatic glucose output, with higher glucose uptake in the peripheral tissues (Shin et al., 2015). In this regard, AHNAK deficiency also resulted in significantly improved glucose-disposal rates with a robust increase in insulin signaling in target tissues. These results may have been due to a difference in the fat contents of the diets. The authors performed their experiments with a lower fat-containing diet than was employed in the current study. Another possibility is that the mice had a different genetic background, which can influence metabolism in mice (Vaillant et al., 2014). While our mutant mice were derived from a C57BL/6 background, their mice originated from BDF1, a cross between female C57BL/6 and male DBA/2. Our mutant mice could display better glucose tolerance and greater responsiveness to insulin, because BDF1 mice are prone to develop obesity-induced diabetes more than B6 mice (Karasawa et al., 2011).
Results from this study demonstrated that AHNAK downregulation protects mice from obesity, hepatosteatosis, and insulin resistance.
Furthermore, although AHNAK is implicated in the regulation of energy metabolism and glucose homeostasis, further studies are needed to determine the molecular mechanism whereby AHNAK regulates energy metabolism. We cannot exclude the possibility that AHNAK may influence other tissues or mouse development because we used mice carrying the null mutation. In particular, studying tissue-specific AHNAK inactivation will
likely be useful in that indirect effects may be involved in the overall regulation of adiposity and energy metabolism. Moreover, it should be determined whether AHNAK overexpression contributes to aggravated obesity and metabolic homeostasis.
Chapter II
Increased levels of eosinophils and type II
cytokines in WAT mediates the browning and
thermogenensis in AHNAK KO mice
2.1. Introduction
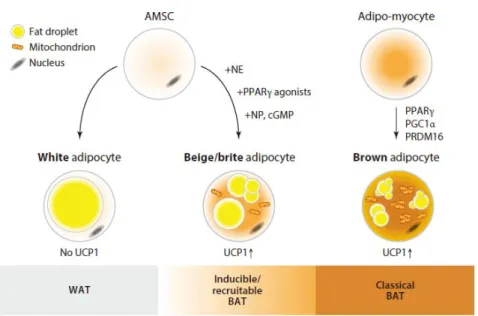
Figure 2-1. Types of adipose tissue. (Pfeifer et al. Annu. Rev. Pharmacol. 2015)
Obesity is associated with several metabolic disorders including type 2 diabetes, cardiovascular disease (Despres and Lemieux, 2006; Eckel et al., 2005; Grundy, 2006). Mammalian adipose tissue has been traditionally divided into two distinct types. WAT stores excessive energy in unilocular adipocytes. On the other hands, brown adipose tissue (BAT) dissipates energy through nonshievering thermogenesis in multilocular adipocytes (Cinti, 2001; Harms and Seale, 2013; Rosen and Spiegelman, 2014). Brown adipocytes generate heat and conteract obesity due to
containing abundant mitochondria and UCP1. Recently, alternative type of fat cell termed “beige adipocyte” or “browning” is emerging from several studies (Figure 2-1) (Bartelt and Heeren, 2014; Ishibashi and Seale, 2010;
Wu et al., 2012). These beige fat cells exist within white adipose depots and share common morphological and functional features with classical brown adipocytes. Thus, there has been emerging interest in beige fat as an anti- obesity therapeutic potential (Harms and Seale, 2013; Pfeifer and Hoffmann, 2015; Yoneshiro et al., 2013).
Several secreted factors, such as Irisin, BMP8b, T4, natriuretic peptides and noradrenalin that induce browning in WAT have been reported (Figure 2-2) (Bordicchia et al., 2012; Bostrom et al., 2012; de Jesus et al., 2001; Harms and Seale, 2013; Hondares et al., 2011; Nguyen et al., 2011a;
Whittle et al., 2012). Previous studies suggest that b-adrenergic signals including noradrenalin and b-adrenergic agonist enhance lipolysis and adaptive thermogenesis (Atgié et al., 1998; Bachman et al., 2002;
Granneman et al., 2005; Himms-Hagen et al., 1994). Three adrenergic receptors mediate thermogenesis via sympathetic nerve activation. Of these receptors, especially, 3 specific adrenergic receptors (Adrb3) alleviated obesity and diabetes (Arch and Wilson, 1996; Kim et al., 2006). Adrb3 are abundant in rodent adipose tissue (Lowell and Bachman, 2003; Nahmias et al., 1991). CL316243, 3 adrenergic receptor agonist has been utilized to mimic the effect of browning (Himms-Hagen et al., 2000; Schulz et al., 2013). CL-316243 in adipocytes stimulates cyclic AMP (cAMP) production, which binds to the protein kinase A (PKA). Activation of PKA has been considered as a mediator for UCP1 and PGC1 expression for
thermogenesis (Cao et al., 2001; Collins et al., 2010).
We recently reported that AHANK KO mice exhibit enhanced insulin sensitivity and higher energy expenditure under high fat diet (Shin et al., 2015). This was accompanied by reduction of whole body fat accumulation. The levels of Ucp1 mRNA were increased in eWAT from HFD fed AHNAK KO mice, compared with that of wild-type control mice.
Although AHNAK is highly expressed in adipose tissue and increased obese murine models (Li et al., 2002; Ramdas et al., 2014), thermogenic function of AHNAK in adipose tissue has not been determined.
In the present study, we demonstrated that AHNAK ablation results in activation of eosinophils and type 2 cytokines which contribute to browning of WAT depot and promotes energy expenditure by ADRB3 agonist (CL- 316243) treatment.
Figure 2-2. Secreted factors that recruit beige adipocytes. (Harms et al. Nat Med. 2013)
2.2. Materials and Methods
Animals
AHNAK-KO (Ahnak-/-) mice were maintained under a 12-h light-dark cycle and had free access to water in a specific pathogen-free barrier facility. Mice were randomly assigned. To stimulate the browning of white adipose depots, 2-3 month-old mice were treated with daily intraperitoneal injections of 1mg/kg bodyweight CL-316,243 (Sigma-Aldrich) dissolved in PBS. The experiments were performed according to the “Guide for Animal Experiments” (Edited by Korean Academy of Medical Sciences) and approved by the Institutional Animal Care and Use Committee (IACUC) of the Seoul National University (Permit Number: SNU-130903-1).
Core body temperature measurement
Body temperature was measured with telemetry transmitters (TSE Systems).
A transmitter was implanted into peritoneal cavity under anesthetics.
Indirect calorimetry study
Oxygen consumption (VO2), carbon dioxide production (VCO2), respiratory exchange ratios (RER) and heat production were measured using an indirect calorimetry system (TSE) installed. Mice in each chamber were maintained under 12h light/dark cycle with a constant environmental temperature (22 °C) and free access to food and water.
Immunostaining
Adipose tissue samples were fixed in 4% paraformaldehyde and embedded in paraffin, sectioned and stained. Primary antibodies were incubated overnight at 4℃. Images were captured using a confocal microscope system (LSM 710, Carl Zeiss).
Immunoblotting
For immunoblot analysis, cells were lysed in PRO-PREP buffer (iNtRON Biotechnology Inc., Seoul, Korea) containing a phosphatase-inhibitor cocktail (GenDEPOT, Barker, TX, USA). Protein extracts were separated by sodium dodecyl sulfate-polyacrylamide gel electrophoresis, transferred to a polyvinylidene fluoride membrane (Millipore, Billerica, Massachusetts, USA), and subjected to immunoblot analysis. Immunoblot analysis was performed using the indicated antibodies. Proteins were visualized by ECL chemiluminescence (AbClon, Seoul, Korea). GAPDH was detected as a loading control. Immunoreactive signals were detected through their enhanced chemiluminescence and recorded using the MicroChemi 4.2 system (DNR Bio-Imaging Systems, Jerusalem, Israel).
Antibodies
The primary antibodies used for western blot analysis were specific for:
UCP1, PGC1α, CPT2, PPARα, AHNAK, and OXPHOS (oxidative phosphorylation) complexes (all from Abcam); GAPDH (Cell Signaling Technology, Beverly, MA, USA); PDGFRa (R&D Systems, UK); and Tyrosine hydroxylase (Millipore).
DAPI (ImmunoBioScience Co., Washington, USA) was used for nuclear staining.
Cell preparations and flow cytometric analysis
Epididymal white adipose tissues were chopped with scissors for 4 minutes.
These are added 2mL Collagenase II (SIGMA C6885, 400U/mL) and incubated at 37℃ for 8 minutes. After digestion, single-cell suspensions were treated with 20μL of 0.5M EDTA and filtered using 70 μm meshes.
The cells were centrifuged 385g for 10 minutes at 4℃ to remove floated adipocytes, and red blood cells were lysed by 1X RBC lysis buffer (eBioscience 00-4300-54) for 2 minutes on ice. After blocking Fc receptors using TruStain FcXTM (Biolegend 101320), the cells were stained with the indicated fluorochrome conjugated antibodies. We used an LSRFortessa™
(BD) or FACSCanto™ II (BD), and analyzed flow cytometric data with FlowJo (Tree Star Inc). The antibody used in flow cytometry were PE conjugated PDGFRα (eBioscience 12-1401-81), PE conjugated IgG2a,κ (Biolegend, 400507), PerCP conjugated CD45 (Biolegend, 103130), PE/cy7 conjugated CD11c (Biolegend, 117318), APC conjugated CD11b (Biolegend, CD11b), APC conjugated CD44 (Biolegend, 103012), and BV421 conjugated siglecF (BD HorizonTM, 562681).
Statistics
All values were expressed as the mean± SEM. Statistical analysis was performed using the Student’s t-test between two groups. The Kruskal- Wallis Test was used for Flow cytometric analysis. P<0.05 was considered significantly.
2-3. Results
2.3.1 AHNAK ablation promotes thermogenic gene program and browning in WAT but not in BAT via -adrenergic stimulation
To evaluate cold-induced adaptive thermogenesis in AHNAK KO mice, they were exposed to an ambient temperature of 4°C for 3 days and compared to the animals kept at thermoneutral conditions (30°C). AHNAK expressioin was selectively downregulated in eWAT and iWAT (p<0.07) (Figure 2-3A).
Similary, the decrease of AHNAK mRNA was observed in fully differentiated 3T3-L1 after 6h exposure to 30°C compared with cells kept at 37°C (Figure 2-3B). At 30°C, AHNAK KO mice had few UCP1-positive adipocytes and their morphology was similar to that of the wild-type mice.
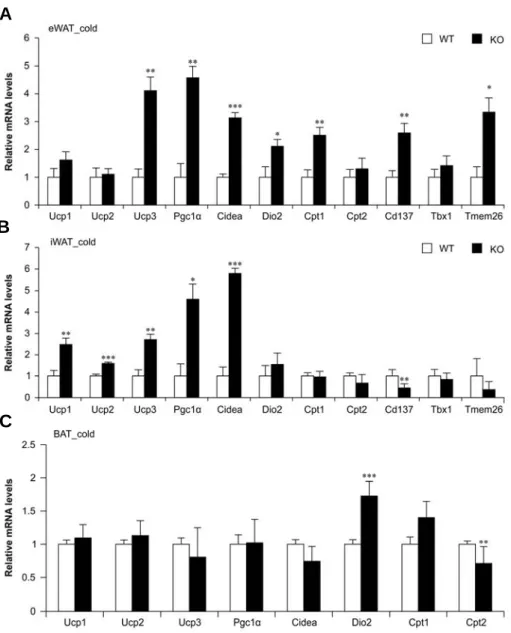
However, after cold exposure, AHNAK KO mice demonstrated an increase in multilocular UCP1-expressing adipocytes in eWAT and inguinal iWAT (Figure 2-4). Both eWAT and iWAT but not BAT from AHNAK-deficient cold-exposed mice tended to have higher mRNA levels of thermogenic genes (Pgc1, Cidea, Dio2, Cpt1); in addition, eWAT in these mice was enriched in beige adipocyte markers (CD137, Tmem26) compared to the wild-type mice after cold exposure (Figure 2-5A–C). These results suggest that AHNAK genetic ablation promotes adaptive browning of WAT under environmental stimulation.
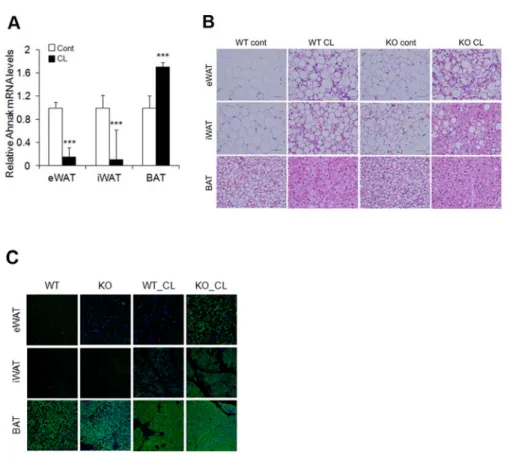
The sympathetic nervous system (SNS) plays a critical role in BAT activation and adaptive thermogenesis mediated by -adrenergic receptors (Lowell and Bachman, 2003; Robidoux et al., 2004). To examine whether - adrenergic signaling influenced thermogenesis in AHNAK KO mice, they were administered CL-316243 (CL), an ADRB3 agonist. We found significantly lower expression of AHNAK in the eWAT and iWAT under CL treatment, but not BAT (Figure 2-6A). Histological analysis revealed that CL induced WAT of AHNAK KO mice resulted in morphological transformation of unilocular adipocytes to multilocular UCP1-expressing adipocytes, compared with that of wild-type controls. (Figure 2-6B,C). At the mRNA level, the expression of both brown adipocyte related genes (Ucp1, Cidea, Dio2 and Pgc1) and mitochondrial genes (Cpt1, Cpt2 and Cox8b) was higher in the CL-stimulated eWAT and iWAT of AHNAK KO mice than WT mice (Figure 2-7A,B). Immunoblot analysis showed that UCP1, PGC1α and CPT2 were significantly elevated both in eWAT and iWAT from CL-stimulated AHNAK KO mice compared to that from WT mice (Figure 2-8A,B). However, there were no obvious changes in the histological morphology and activity of BAT between WT and AHNAK KO mice (Figure 2-6A, 2-7C, 2-8C). Furthermore, AHNAK KO mice exhibited higher core body temperature than wild-type mice after CL injection (Figure 2-9). Consistent with a previous report (Parikh et al., 2008a), oxygen consumption (VO2) and energy expenditure were significantly elevated in AHNAK KO mice compared to WT mice after CL stimulation (Figure 2- 10A,B). These results suggest that 3-adrenergic stimulation mediates the formation of multilocular adipocytes and enhances adaptive thermogenesis
through upregulation of thermogenic genes in the AHNAK deficient WAT depots, leading to increased energy expenditure.
Figure 2-3. AHNAK mRNA expression by qPCR during cold chanllege.
(A) Expression levels of AHANK gene in fat depots (n=5). (B) 3T3-L1 cells were differentiated and maintained in for 10d (day 0–10) qPCR analysis of differentiated 3T3-L1 cells following maintaining in 37 °C or 30 °C for 6h (n=4). Values were normalized to 36B4. Data are means ± SEM; *P<0.05, **P<0.01, ***P<0.001.
B A
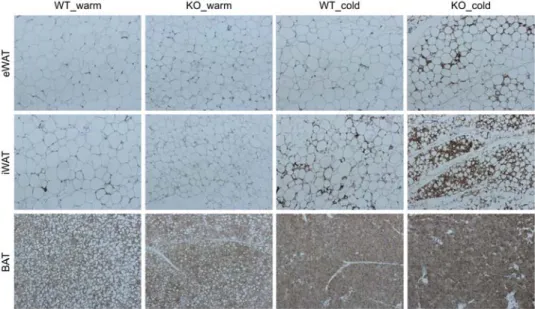
Figure 2-4. Browning phenotype of WAT in AHNAK KO mice under cold exposure. Representative pictures of UCP1 immunostaing in adipose tissues from mice maintained at 30°C (warm) or 4°C (cold) for 3 days. by cold exposure for 3days at 4°C.
Figure 2-5. Expression of thermogenic related genes in AHNAK KO mice under cold exposure.
qPCR analysis in eWAT (A), iWAT (B) and BAT(C) from mice (n=5-6). Values were normalized to 36B4. Data are means ± SEM; *P<0.05, **P<0.01,
***P<0.001 between WT and KOmice.
A
B
C
Figure 2-6. Ablation of AHANK induces white to brown fat transition.
(A) AHNAK mRNA expression of fat depot in control or CL treated mice (n=4-9 per group) and normalized to 36B4. (B) Representative hematoxylin and eosin staining of adipose tissues from mice treated with CL316243 (CL) for 3 days. (C) Immunofluorescence staining of UCP1 in adipose tissues of mice treated or not with CL CL-316243.
Figure 2-7. Expression of thermogenic related genes in AHNAK KO mice under CL-challenges.
(A-C) qPCR analysis of thermogenic related genes in eWAT (A), iWAT (B), and BAT (C) of mice (n=5). The data are presented as the means ± SEM. *P < 0.05,
B A
C
**P < 0.01, ***P < 0.001, wild-type (WT) versus Ahnak-/- (KO)mice.
Figure 2-8. Thermogenic gene expression in AHNAK KO mice.
(A-C) Immunoblot analysis of eWAT (A), iWAT (B), and BAT (C) from mice treated with 3-day CL316243. The data are presented as the means ± SEM. *P <
0.05, **P < 0.01, ***P < 0.001, wild-type (WT) versus Ahnak-/- (KO)mice.
A
B
C
Figure 2-9. Measurement of body temperature in AHNAK KO mice after CL challege.
Core body temperature measured for WT and KO mice after CL injection at room temperature (n=12). The data are presented as the means ± SEM. *P < 0.05, **P <
0.01, ***P < 0.001, wild-type (WT) versus Ahnak-/- (KO)mice.
Figure 2-10. Enhanced thermogenesis in AHNAK KO mice after CL challenge.
(A) Oxygen consumption (VO2<