저작자표시-비영리-변경금지 2.0 대한민국 이용자는 아래의 조건을 따르는 경우에 한하여 자유롭게
l 이 저작물을 복제, 배포, 전송, 전시, 공연 및 방송할 수 있습니다. 다음과 같은 조건을 따라야 합니다:
l 귀하는, 이 저작물의 재이용이나 배포의 경우, 이 저작물에 적용된 이용허락조건 을 명확하게 나타내어야 합니다.
l 저작권자로부터 별도의 허가를 받으면 이러한 조건들은 적용되지 않습니다.
저작권법에 따른 이용자의 권리는 위의 내용에 의하여 영향을 받지 않습니다. 이것은 이용허락규약(Legal Code)을 이해하기 쉽게 요약한 것입니다.
Disclaimer
저작자표시. 귀하는 원저작자를 표시하여야 합니다.
비영리. 귀하는 이 저작물을 영리 목적으로 이용할 수 없습니다.
변경금지. 귀하는 이 저작물을 개작, 변형 또는 가공할 수 없습니다.
2019년 2월 석사학위논문
한국 폐경후 여성에서 근감소성 비만의 유병률과 위험요인 분석
2009-2010국민건강영양조사
조선대학교 대학원
의 학 과
류 영 상
[UCI]I804:24011-200000267336
한국 폐경후 여성에서 근감소성 비만의 유병률과 위험요인 분석
2009-2010 국민건강영양조사
The Prevalence of Sarcopenic Obesity and Risk Factors in Korean Postmenopausal Women
2019년 2월 25일
조선대학교 대학원
의 학 과
류 영 상
한국 폐경후 여성에서 근감소성 비만의 유병률과 위험요인 분석
2009-2010국민건강영양조사
지도교수 김 진 화
이 논문을 의학 석사학위신청 논문으로 제출함
2018년 10월
조선대학교 대학원
의 학 과
류 영 상
류영상의 석사학위논문을 인준함
위원장 조선대학교 교수 김 상 용 (인) 위 원 조선대학교 교수 김 진 화 (인) 위 원 조선대학교 교수 최 동 현 (인)
2018년 11월
조선대학교 대학원
목차
표목차‥‥‥‥‥‥‥‥‥‥‥‥‥‥‥‥‥‥‥ 2
ABSTRACT ‥‥‥‥‥‥‥‥‥‥‥‥‥‥‥‥‥‥ 3
I. Introduction ‥‥‥‥‥‥‥‥‥‥‥‥‥‥‥‥‥‥ 5
II. Research design and methods ‥‥‥‥‥‥‥‥‥‥ 6
III. Results ‥‥‥‥‥‥‥‥‥‥‥‥‥‥‥‥‥‥‥ 10
IV. Discussion ‥‥‥‥‥‥‥‥‥‥‥‥‥‥‥‥‥‥ 12
V. Conclusion ‥‥‥‥‥‥‥‥‥‥‥‥‥‥‥‥‥‥ 16
References ‥‥‥‥‥‥‥‥‥‥‥‥‥‥‥‥‥‥‥ 17
표목차
Table 1. Characteristics of the study population ‥‥‥‥‥ 21
Table 2. Characteristics of the study population according to age at first childbirth ‥‥‥‥‥‥‥‥‥‥‥‥‥‥‥‥‥‥ 23
Table 3. Association of variables with sarcopenic obesity in
postmenopausal women ‥‥‥‥‥‥‥ 25
ABSTRACT
The Prevalence of Sarcopenic Obesity and Risk Factors in Korean Postmenopausal Women
Lyu Young Sang
Advisor : Prof. Kim Jin Hwa M.D.
Department of Medicine,
Graduate School of Chosun University
Introduction
Sarcopenic obesitycarries the cumulative risk of functional abnormality, metabolic,
cardiovascular risk, and mortality compared to either sarcopenia or obesity alone. Sarcopenic obesity is a complex condition interplaying hormonal, biological, nutrition, and physical activity mechanisms. Postmenopauseis related to an increase in visceral adiposity and is associated with the risk of sarcopenic obesity.
The objective of the present study was to identify the prevalence of sarcopenic obesity and associated risk factors in Korean in postmenopausal women.
Research Design and Methods
This study was based on data from the Korean National Health and Nutrition Examination Survey (KNHANES), conducted by the Korean Ministry of Health and Welfare, from 2009 to 2010. This cross-sectional and nationally representative survey of non-institutionalized
civilians used a stratified, multistage, clustered probability sampling design. Out of 19,491 participants, the analysis included data for 2,196 postmenopausal women. Multivariate logistic regression analyses were used to determine an independent associated risk factors with sarcopenic obesity in postmenopausal women.
Results
The prevalence rates of nonsarcopenicnonobesity, nonsarcopenic obesity,
sarcopenicnonobesity, and sarcopenic obesity were 48.6%, 16.1%, 15.0%, and 20.3%, respectively. Sarcopenic obesity prevalence differed significantly between the subgroups and increased with earlier age at first childbirth, with 11.7% in subjects ≥ 30 years at first
childbirth and 30.7% in subjects ≤ 19 years at first childbirth.
Age at first childbirth≤ 19 years(OR 1.719 [95% confidence interval (CI) 1.091–2.711]), known hypertension (OR 1.976 [1.478–2.642]), known arthritis (OR 1.941 [1.529–2.465]), diastolic blood pressure (OR 1.027 [1.008–1.046]), vitamin D level (OR 0.962 [0.942–
0.982]), and history of hormone replacement therapy(OR 0.596 [0.406-0.875])were significant associated factors with sarcopenic obesity.
Conclusions
Women’s age at first childbirth and chronic disease influenced the sarcopenic obesity risk in postmenopausal women. The postmenopausal women ≤ 19 years at first childbirthwas
independently associated with a higher risk of sarcopenic obesity. The vitamin D level and hormone replacement therapy were significantly associated with reduction of sarcopenic obesity risk.
Introduction
Sarcopenic obesity is a double burden for older people because it carries the cumulative risk of functional abnormality, metabolic, cardiovascular risk, and mortality compared to either sarcopenia or obesity alone(1,2). Identifying individuals at risk and precise, early intervention to prevent sarcopenic obesity can greatly improve public health in today’s aging society.
Pregnancy induces dramatic alterations in a woman’s physiology and metabolism(3).
Although childbearing is a time-limited condition, that has been implicated in healthy consequences for women later in life (4,5),it has been suggested that the timing of childbearing is associated with women’s health later in life. Self-reported health among women aged 55–74 years was negatively associated with childbirth before the age of 23(6), and women who gave birth before the age of 20 had a higher mortality risk than other parous women at ages 50–85 years (7). Women who were teenage mothers were at a higher risk of dying from diabetes at 45–74 years(8), and adolescent pregnancy was independently associated with a higher risk of diabetes in postmenopausal women(9).
However, to our knowledge, no reports have investigated the influence that age at first childbirth has on sarcopenic obesity on women later in life, particularly during
postmenopause. Postmenopause is related to an increase in visceral adiposity and is associated with the risk of sarcopenia(10).
The objective of the present study was to identify the prevalence of sarcopenic obesity and associated risk factors in Korean in postmenopausal women, especially focusing on age at first childbirth.
Research design and methods
Study population
This study was based on data from the KNHANES, which was conducted by the Korean Ministry of Health and Welfare from 2009 to 2010. This cross-sectional and nationally representative survey of non-institutionalized civilians used a stratified, multistage, clustered probability sampling design. The sampling units are defined based on data from household registries, including geographical area, sex, and age groups. The KNHANES is composed of a health interview survey, a nutrition survey, and a health examination survey conducted by trained investigators. All participants provided signed informed consent. From the 19,491 participants in the 2009–2010 survey, we used data collected from 3,136 women who were naturally postmenopausal. Menopause was defined as the absence of menses for 12
consecutive months. We excluded women who experienced the onset of menopause when they were younger than 40 years old (n= 135). We also excluded women with no history of childbirth (n= 45), no data for reproductive factors (n= 185), no data for dual-energy X-ray absorptiometry (n= 157), any malignancy (n= 126),and missing or incomplete data for analysis (n= 292). Finally, data for 2,196 postmenopausal women were retained for analysis.
Measurement and classification of variables
Height was measured to the nearest 0.1 cm using a portable stadiometer while the
participants were in an upright position. Body weight was measured to the nearest 0.1 kg on a balanced. Body mass index (BMI) was calculated as weight in kilograms divided by the
square of the height in meters. Waist circumference (WC) was measured midway between the costal margin and the iliac crest at the end of a normal expiration. Blood pressure (BP) was measured from the right arm using a standard mercury sphygmomanometer after 5 minutes of rest in a sitting position. The mean value of two separate BPs was used for analysis. Venous blood samples were obtained after a minimum fasting time of 8 hours. The plasma level of fasting glucose was measured using a Hitachi Automatic Analyzer 7600 (Hitachi, Tokyo, Japan). Serum 25-hydroxyvitamin D (25[OH]D) concentration was measured by
immunoradiometric assay using 1470 WIZARD gamma-counter (PerkinElmer, Finland).
Appendicular skeletal muscle mass (ASM) was measured using whole-body, dual-energy X- ray absorptiometry (DXA; Discovery-W, Hologic, Inc., Waltham, MA, USA). ASM was calculated as the sum of skeletal muscles in the arms and legs, assuming that all non-fat and none-bone tissue was skeletal muscle. We defined sarcopenia using ASM as a percentage of body weight (ASM/Wt), modified from the report of Janssen et al.(11). Sarcopenia was defined as ASM/Wt of 1 standard deviation (SD) below the sex-specific mean value for the young reference group aged 20–39 years from the same 2009–2010 KNHANES database(12).
The cut-off value for sarcopenia was 24.65% (ASM/Wt).
Obesity was defined according to the criteria recommended by the Korean Society for the Study of Obesity, defining a BMI≥25.0 kg/m2as obese(13).
Sarcopenic obesity was defined when a subject satisfied the criteria for both sarcopenia and obesity.
Self-reported questionnaires were administered to determine smoking status, alcohol use, family income, education level, residential area, and regular exercise, as well as intake of total energy, carbohydrates, proteins, and fats. Residential area was categorized according to the Korean administrative district as urban and rural areas. Regular exercise is indicated as
“yes” if the subject does moderate exercise on a regular basis (for more than 30 minutes at a time, more than 5 times per week). Diabetes was defined as having a fasting plasma glucose (FPG) ≥ 126 mg/dL, using insulin or antidiabetic medication, or being diagnosed as diabetic by a physician. Known hypertension was defined as undergoing treatment for hypertension or being diagnosed with hypertension by a physician. Subjects were also asked to recall
reproductive factors, including age at menarche, age at menopause, number of pregnancies, age at first childbirth, oral contraceptive use, and hormone replacement therapy.
Statistical analysis
The complex sample analysis was used for the KNHANES data for weighting all values following the guidance of statistics from the Korea Centers for Disease Control and
Prevention. Continuous variables were reported as mean ± SD, and categorical variables were reported as weighted percentages. The comparisons among groups were performed using t- tests for continuous variables, and a chi-squared test was used for categorical variables.
For data analysis, subjects were subdivided into four groups according to the women’s age at first childbirth as follows: ≤ 19 years, 20–24 years, 25–29 years, and ≥ 30 years.
Multivariate logistic regression analyses were used to identify the association between age at first childbirth subgroups and sarcopenic obesity. This was conducted by evaluating the OR after adjusting for confounding factors associated with an increased risk of sarcopenic obesity.
Analyses were adjusted for potential confounders in a series of models. Covariates were added to the model in the following order: age, chronic disease (stroke, cardiovascular disease, diabetes, hypertension, and arthritis), systolic and diastolic blood pressure, lifestyle behaviors (smoking status, alcohol use, and regular exercise, as well as intake of total energy,
carbohydrates, proteins, and fats), sociodermographic factors (residential area, family income, and education), serum 25(OH)D levels, and reproductive factors (age at menarche, age at menopause, number of pregnancies, oral contraceptive use, and hormone replacement therapy).
Statistical analyses were performed using SPSS software (version 18.0), and a P-value of <
0.05 was considered statistically significant.
Results
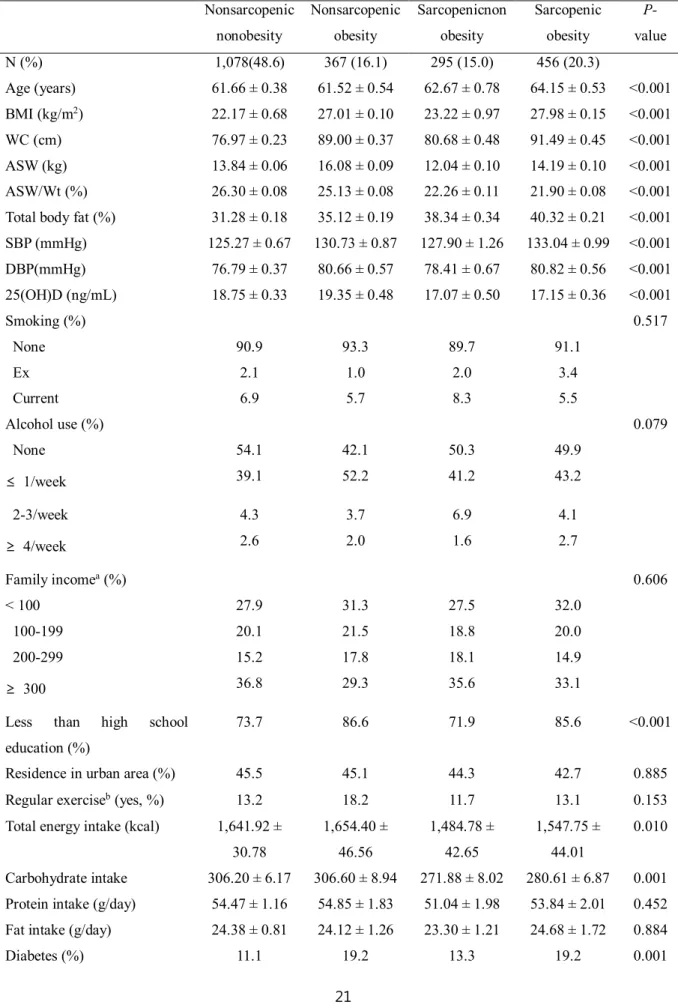
Table 1 presents the subjects’ clinical and biochemical characteristics according to the presence of sarcopenia and obesity. The prevalence rates of nonsarcopenicnonobesity, nonsarcopenic obesity, sarcopenicnonobesity, and sarcopenic obesity were 48.6%, 16.1%, 15.0%, and 20.3%, respectively.
Among the subgroups, significant differences were found regarding variables, such as age, systolic and diastolic blood pressure, body composition parameters, education, and diet pattern. Chronic diseases, such as diabetes, known hypertension, known arthritis, previous stroke, and reproductive factors (such as number of pregnancies and hormone replacement therapy) also differed between groups. Lower levels of 25(OH)D were more common among subjects with sarcopenia.
The mean age of women at first childbirth differed significantly between the subgroups and was more likely to be lower in subjects with sarcopenic obesity. In addition, distribution of the age group at first childbirth differed significantly between the subgroups, and the proportion of earlier age at first childbirth increased in the sarcopenic obesity group.
Comparison of clinical characteristics and prevalence of sarcopenic obesity among age at first childbirth subgroup
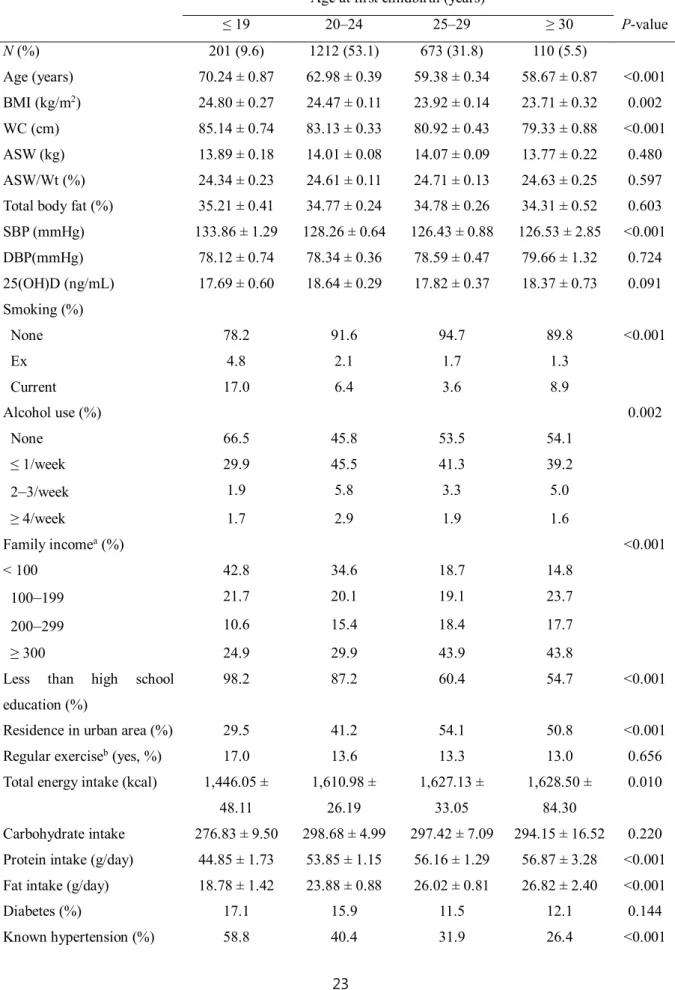
Table 2 shows characteristics of the subjects stratified into four groups by age at first childbirth. Subjects with an earlier age at first childbirth were older and had higher BMIs, WCs, systolic blood pressures, and had higher number of pregnancies than those with a later age at first childbirth. In addition, subjects with an earlier age at first childbirth were more
likely to have a lower family income and education level and to reside in rural areas.
Smoking, alcohol use, known hypertension, known arthritis, and reproductive factors (such as age at menarche, age at menopause, and oral contraceptive use) differed between subgroups.
The prevalence of sarcopenia was more likely to increase with earlier age at first childbirth (31.4% in subjects ≥ 30 years and 46.8% in subjects ≤ 19 years, respectively). Sarcopenic obesity prevalence differed significantly between the subgroups and increased with an earlier age at first childbirth, with 11.7% in subjects ≥ 30 years at first childbirth and 30.7% in subjects ≤ 19 years at first childbirth.
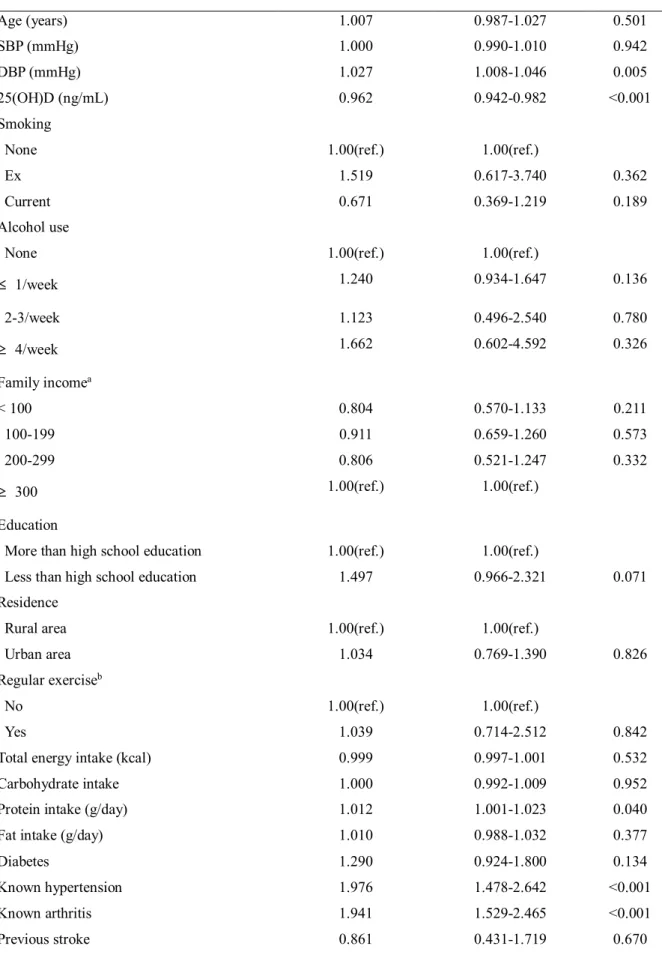
Associated risk factors of sarcopenic obesity in postmenopausal womens
Table 3 presents the results of the logistic regression analyses designed to examine the association between variables and sarcopenic obesity. Age at first childbirth≤ 19 years(OR 1.719 [95% confidence interval (CI) 1.091–2.711]), known hypertension (OR 1.976 [1.478–
2.642]), known arthritis (OR 1.941 [1.529–2.465]), diastolic blood pressure (OR 1.027 [1.008–1.046]), vitamin D level (OR 0.962 [0.942–0.982]), and history of hormone replacement therapy(OR 0.596 [0.406-0.875])were significant associated factors with sarcopenic obesity.
Discussion
In the current study, we found p ositivesignificant association between chronic disease and sarcopenic obesity risk in postmenopausal women. The age of women at first childbirth was significantly associated with sarcopenic obesity in postmenopausal women.Postmenopausal women with adolescent pregnancy (age at first childbirth ≤ 19 years) had a higher risk of sarcopenic obesity after adjusting for multiple conditions potentially affecting the results. To our knowledge, this is the first large, population-based study that investigated the association between age at first childbirth and sarcopenic obesity in postmenopausal women. Our results indicate long-term effects of age at first childbirth on incidental sarcopenic obesity. The vitamin D level and hormone replacement therapy were negatively associated with sarcopenic obesity risk.
Sarcopenic obesity is a complex condition interplaying hormonal, biological, nutrition, and physical activity mechanisms(14). This study has a cross-sectional design; therefore, it was not possible to establish pathophysiological mechanisms that connect adolescent pregnancy and an increased risk of sarcopenic obesity. Several possibilities may be suggested.
First, pregnancy can affect the physiology of women depending on a given age(3). Pregnancy during adolescence is a significant challenge to the organisms that is not physiologically prepared(15,16). Insulin resistance is associated with the augmentation of intramyocellular fat mass and loss of muscle function(17), and pregnancy is related to increased insulin
resistance(3). These early exposures to biologically immature organs may induce subtle and deleterious outcomes in physiology and metabolism, including muscle, which is still
growing,that might be sustained and susceptible to an increased risk of sarcopenic obesity later in life when facing vulnerable and not compensated period such as postmenopause.
Postmenopauseis related to an increase in visceral adiposity, as well as a decrease in muscle mass and muscle strength(10).
Second, obesity, especially postpartum weight retention and the development of obesity, may act as an intermediating or provoking factor between adolescent pregnancy and the risk of sarcopenic obesity later in life. Several studies suggested that excess gestational weight gain contributes to an increased risk of being overweight during subsequent life, and
adolescent pregnancies result in higher weight gain compared with adult pregnancies(18-20).
Moreover, a teenage mother may encourage unhealthy lifestyle habits, such as less physical activities, adding to an increased risk of obesity later in life (21). In obesity, high circulating levels of lipids accumulate in skeletal muscle, and these intramyocellular lipids may alter muscle morphology, size, and function, leading to a reduced muscular renewal capacity(22).
An increase in obesity also expression of myostatin, which is a muscle growth factor regulating muscle growth, suppressing differentiation and proliferation of myocytes, and inversely correlating with skeletal muscle mass(23). In addition, visceral fat produces more pro-inflammatory adipokines, leading to a low-grade inflammatory status, which is related to a loss of skeletal mass by triggering muscle proteolysis and myocyte apoptosis(24).
Longstanding and cumulative exposure to obesity seems to create a vicious cycle of fat gain and muscle loss, which could contribute to the development of sarcopenia. Chronic exposure to high amounts of fat induces de-differentiation of myotube progenitor cells to mesenchymal adipocyte-like default cells. This process could decrease the regeneration capacity of the skeletal muscle with aging(25). However, information is not available on gestational weight gain, postpartum weight retention, and lifetime weight change for the current study.
Additional studies are needed to explore the exact causal relationships in more detail.
Third, women who are pregnant during adolescence may have higher parity, as early age at
first childbirth was correlated with increasing parity(26). In our study, women with who were younger at first childbirth had more pregnancies than those who were older at first childbirth.
Each pregnancy permanently resets ovarian function, and increasing pregnancies can lead to a reduced lifetime exposure to estrogen(27). A decline in estrogen may lead to increased pro- inflammatory cytokines, such as tumor necrosis factor alpha (TNF-α) or interleukin-6 (IL-6), which contribute to muscle catabolism(28). In addition, IL-6 and TNF-α could lower the anabolic hormone insulin-like growth factor-1 (IGF-1), leading to a catabolic state(29). These activities may be associated with developing sarcopenia later in life. Moreover, skeletal muscle has estrogen beta-receptors(30). Although further studies are needed, there is a potential direct effect of low estrogen levels on a decrease in protein synthesis. In the present study, the association of adolescent pregnancy with sarcopenic obesity remained after
adjusting for the number of pregnancies. These results suggest that adolescent pregnancy may itself influence sarcopenic obesity via pathophysiological mechanisms other than the number of pregnancies.
Fourth, a pregnant teenager experiences several role changes relating to childcare. These changes can lead to the mother becoming more and more prone to an impaired nutrition status and lower physical performance(21), leading to the deterioration of muscle quantity and quality.
Fifth, socioeconomic status can affect both adolescent pregnancy and the risk of sarcopenic obesity as selection effects. In the present study, education, family income, and residential area are considerable confounders. After these variables are added to the multivariable models, the magnitude of the association between subjects≤ 19 years at first childbirth and sarcopenic obesity attenuated but continued to be statistically significant. These results should be interpreted carefully because our data on socioeconomic factors reflect the status at
enrollment but not during the adolescent or lifetime period.
The strength of this study is that it was a large, population-based national representative study that considered a comprehensive range of possible confounding and mediating factors, including chronic disease, sociodemographic influences, lifestyle differences, serum
25(OH)D levels, and reproductive factors. Recently, a possible role of vitamin D in sarcopenia has been postulated, suggesting vitamin D deficiency as a risk factor for sarcopenia(31). In the currentstudy, we added a serum 25(OH)D level to the multivariable models; a magnitude of association between subjects ≤ 19 years age at first childbirth and sarcopenic obesity attenuated but continued to be statistically significant.
This study had several limitations. The measurements were performed at a certain time in a cross-sectional design; thus, a causal relationship could not be clearly determined. We also applied measurements of muscle mass only to define sarcopenia because the KNHANES did not examine muscle strength or performance, although the European Working Group on Sarcopenia in Older People developed diagnostic criteria for sarcopenia, including low muscle function(32). However, we used muscle mass as an index in which ASM was calculated as a percentage of body weight, which has been known to be associated with metabolic parameters(12).Another limitation was that age at first childbirth, age at menopause, and age at menarche were based on self-report, which is prone to recall bias.
However, the recall of reproductive factors is expected to be valid and reliable(33). Finally, these results can be potentially less generalized to today’s women because the adolescent environmental conditions of this study population were different from those of today’s adolescents.
Conclusion
In conclusion, age at first childbirth and chronic diseases influenced sarcopenic obesity in postmenopausal women, and adolescent pregnancy was independently associated with a higher risk of sarcopenic obesity in postmenopausal women. The vitamin D level and hormone replacement therapy influence on the reduction of sarcopenic obesity risk.
Our data propose that adolescent pregnancy may contribute to the development of sarcopenic obesity later in life and should be considered a risk factor. Therefore, to
effectively prevent sarcopenic obesity in postmenopausal women, more precise consideration should be focused on women who are pregnant during adolescence. A prospective study is needed to explore the possible causal relationship between adolescent pregnancy and the risk of subsequent sarcopenic obesity later in life.
References
1. Zamboni M, Mazzali G, Fantin F, et al.Sarcopenic obesity: a new category of obesity in the elderly. NutrMetabCardiovasc Dis 2008;18:388-395
2. Choi KM. Sarcopenia and sarcopenic obesity. EndocriniolMetab (Seoul) 2013;28:86- 89
3. Yen SS. Endocrinology of pregnancy. In: Creasy RK, Resnik R, editors. Maternal- Fetal Medicine: Principles and practice. 3rd ed. Philadelphia, PA: Saunder;
1994.p.382-412
4. Beral V. Long term effects of childbearing on health. J Epidemiol Community Health 2985;39:343-346
5. Fowler-Brown AG, de Boer IH, Catov JM, et al. Parity and the association with diabetes in older women. Diabetes Care 2010;33:1778-1782
6. Grundy E, Holt G. Adult life experiences and health in early old age in Great Britain.
SocSci Med 2000;51:1061-1074
7. Doblhammer G. Reproductive history and mortality later in life: a comparative study of England and Wales and Austria. Popul Stud 2000;54:169-176
8. Vandenheede H, Deboosere P, Gadeyne S, et al. The associations between nationality, fertility history and diabetes-related mortality: a retrospective cohort study in the Brussels-Capital Region (2001-2005). J Public Health (Oxf) 2012;34:100-107 9. Kim JH, Jung Y, Kim SY, et al. Impact of age at first childbirth on glucose tolerance
status in postmenopausal women: the 2008-2011 Korean National Health and Nutrition Examination Survey.Diabetes Care 2014;37:671-677
10. Messier V, Rabasa-Lhoret R, Barbat-Artigas S, et al. Menopause and sarcopenia: A potential role for sex hormones.Maturitas 2011;68:331-336
11. Janssen I, Heymsfield SB, Ross R. Low relative skeletal muscle mass (sarcopenia) in older persons is associated with functional impairment and physical disability. J Am GeriatrSoc 2002;50:889-896
12. Lim S, Kim JH, Yoon JW, et al. Sarcopenic obesity: prevalence and association with metabolic syndrome in the Korean Longitudinal Study on Health and Aging
(KLoSHA). Diabetes Care2010;33:1652-1654
13. Oh SW. Obesity and metabolic syndrome in Korea. Diabetes Metab J. 2011;35:561- 566
14. Stenholm S, Harris TB, Rantanen T, et al.Sarcopenic obesity: definition, cause and consequences. Curr Opin Clin Nutr Metab Care. 2008;11:693-700
15. Fraser AM, Brockert JE, Ward RH. Association of young maternal age with adverse reproductive outcomes. N Engl J Med 1995;332:1113-1117
16. Gibbs CM, Wendt A, Peters S, et al. The impact of early age at first childbirth on maternal and infant health. Paediatr Perinat Epidemiol 2012;26:259-284
17. Vincent HK, Raiser SN, Vincent KR. The aging musculoskeletal system and obesity- related considerations with exercise. Ageing Res Rev 2012;11:361-373
18. HaieK L, Lederman SA. The relationship between maternal weight for height and term birth weight in teens and adult women. J Adolesc Health Care 1989;10:16-22 19. Perry RL, Mannino B, Hediger ML, et al. Pregnancy in early adolescence: are there
obstetric risks? J Matern Fetal Med 1996;5:333-339
20. Howie LD, Parker JD, Schoendorf KC. Excessive maternal weight gain patterns in adolescents. J Am Diet Assoc 2003;103:1653-1657
21. Elfenbein DS, Felice ME. Adolescent pregnancy. PediatrClin North Am 2003;50:781-800
22. Dubé J, Goodpaster BH. Assessment of intramuscular triglycerides: contribution to metabolic abnormalities. CurrOpinClinNutrMetab Care 2006;9:553-559
23. McCroskery S, Thomas M, Maxwell L, et al. Myostatin negatively regulates satellite cell activation and self-renewal. J Cell Biol 2003;162:1135-1147
24. Jensen GL. Inflammation: roles in aging and sarcopenia. J Parenter Enteral Nutr 2008;32:656-659
25. Sepe A, Tchkonia T, Thomou T, et al. Aging and regional differences in fat cell progenitors - a mini-review. Gerontology 2011;57:66-75
26. Lao XQ, Thomas GN, Jiang CQ, et al. Parity and the metabolic syndrome in older Chinese women: the Guangzhou Biobank Cohort Study. ClinEndocrinol (Oxf) 2006;65:460-469
27. Bernstein L, Pike MC, Ross RK, et al. Estrogen and sex hormone-binding globulin levels in nulliparous and parous women. J Natl Cancer Inst 1985;74:741-745 28. Maltais ML, Desroches J, Dionne IJ. Changes in muscle mass and strength after
menopause. J Musculoskelet Neuronal Interact 2009;9:186-197 29. Roubenoff R.Catabolism of aging: is it an inflammatory
process?CurrOpinClinNutrMetab Care2003;6:295-299
30. Brown M. Skeletal muscle and bone: effect of sex steroids and aging. Advances in Physiology Education. Vol. 32. No. 2; 2008.p.120-126
31. Kim MK, Baek KH, Song KH, et al. Vitamin D deficiency is associated with
sarcopenia in older Koreans, regardless of obesity: the Fourth Korea National Health and Nutrition Examination Surveys (KNHANES IV) 2009.J ClinEndocrinolMetab 2011;96:3250-3256
32. Cruz-Jentoft AJ, Baeyens JP, Bauer JM, et al.; European Working Group on Sarcopenia in Older People. Sarcopenia: European consensus on definition and diagnosis: Report of the European Working Group on Sarcopenia in Older People.
Age Ageing 2010;39:412-423
33. Must A, Phillips SM, Naumova EN, et al. Recall of early menstrual history and menarcheal body size: after 30 years, how well do women remember? Am J Epidemiol 2002;155:672-679
Table 1. Characteristics of the study population Nonsarcopenic
nonobesity
Nonsarcopenic obesity
Sarcopenicnon obesity
Sarcopenic obesity
P- value
N (%) 1,078(48.6) 367 (16.1) 295 (15.0) 456 (20.3)
Age (years) 61.66 ± 0.38 61.52 ± 0.54 62.67 ± 0.78 64.15 ± 0.53 <0.001 BMI (kg/m2) 22.17 ± 0.68 27.01 ± 0.10 23.22 ± 0.97 27.98 ± 0.15 <0.001 WC (cm) 76.97 ± 0.23 89.00 ± 0.37 80.68 ± 0.48 91.49 ± 0.45 <0.001 ASW (kg) 13.84 ± 0.06 16.08 ± 0.09 12.04 ± 0.10 14.19 ± 0.10 <0.001 ASW/Wt (%) 26.30 ± 0.08 25.13 ± 0.08 22.26 ± 0.11 21.90 ± 0.08 <0.001 Total body fat (%) 31.28 ± 0.18 35.12 ± 0.19 38.34 ± 0.34 40.32 ± 0.21 <0.001 SBP (mmHg) 125.27 ± 0.67 130.73 ± 0.87 127.90 ± 1.26 133.04 ± 0.99 <0.001 DBP(mmHg) 76.79 ± 0.37 80.66 ± 0.57 78.41 ± 0.67 80.82 ± 0.56 <0.001 25(OH)D (ng/mL) 18.75 ± 0.33 19.35 ± 0.48 17.07 ± 0.50 17.15 ± 0.36 <0.001
Smoking (%) 0.517
None 90.9 93.3 89.7 91.1
Ex 2.1 1.0 2.0 3.4
Current 6.9 5.7 8.3 5.5
Alcohol use (%) 0.079
None 54.1 42.1 50.3 49.9
≤ 1/week 39.1 52.2 41.2 43.2
2-3/week 4.3 3.7 6.9 4.1
≥ 4/week 2.6 2.0 1.6 2.7
Family incomea(%) 0.606
< 100 27.9 31.3 27.5 32.0
100-199 20.1 21.5 18.8 20.0
200-299 15.2 17.8 18.1 14.9
≥ 300 36.8 29.3 35.6 33.1
Less than high school education (%)
73.7 86.6 71.9 85.6 <0.001
Residence in urban area (%) 45.5 45.1 44.3 42.7 0.885
Regular exerciseb(yes, %) 13.2 18.2 11.7 13.1 0.153
Total energy intake (kcal) 1,641.92 ± 30.78
1,654.40 ± 46.56
1,484.78 ± 42.65
1,547.75 ± 44.01
0.010
Carbohydrate intake 306.20 ± 6.17 306.60 ± 8.94 271.88 ± 8.02 280.61 ± 6.87 0.001 Protein intake (g/day) 54.47 ± 1.16 54.85 ± 1.83 51.04 ± 1.98 53.84 ± 2.01 0.452 Fat intake (g/day) 24.38 ± 0.81 24.12 ± 1.26 23.30 ± 1.21 24.68 ± 1.72 0.884
Diabetes (%) 11.1 19.2 13.3 19.2 0.001
Known hypertension (%) 29.7 46.5 35.1 56.8 <0.001
Known arthritis (%) 27.8 41.7 35.8 49.5 <0.001
Previous stroke (%) 2.3 4.8 1.0 3.1 0.033
Previous CVD (%) 3.1 3.2 3.2 3.7 0.962
Age at menarche (years) 15.87 ± 0.07 15.70 ± 0.12 15.82 ± 0.14 15.90 ± 0.10 0.620 Age at menopause (years) 49.62 ± 0.13 50.36 ± 0.26 49.80 ± 0.28 49.68 ± 0.21 0.115 Pregnancies (n) 4.80 ± 0.08 5.27 ± 0.15 4.75 ± 0.14 5.35 ± 0.12 <0.001
OC (ever, %) 21.5 25.7 22.9 23.2 0.561
HRT (ever, %) 16.0 16.1 17.6 10.0 0.044
Age at first childbirth (years) 23.96 ± 0.13 23.53 ± 0.21 24.04 ± 0.29 22.90 ± 0.17 <0.001 Age group at first childbirth
(%)
0.011
≤ 19 8.0 7.5 10.3 14.5
20–24 51.7 56.7 49.0 56.6
25–29 33.9 31.6 33.4 25.7
≥ 30 6.4 4.1 7.3 3.2
Data are expressed as mean ± SD for continuous variables and as weighted percentages for categorical variables. Body mass index (BMI), cardiovascular disease (CVD), diastolic blood pressure (DBP), hormone replacement therapy (HRT), oral contraceptive (OC), systolic blood pressure (SBP), waist circumference (WC), body weight. (Wt).
aUnit is thousands Korean won/month.
bRegular exercise is indicated as “yes” when the subject does moderate exercise on a regular basis (for more than 30 minutes at a time, more than 5 times per week).
Table 2. Characteristics of the study population according to age at first childbirth Age at first childbirth (years)
≤ 19 20–24 25–29 ≥ 30 P-value
N(%) 201 (9.6) 1212 (53.1) 673 (31.8) 110 (5.5)
Age (years) 70.24 ± 0.87 62.98 ± 0.39 59.38 ± 0.34 58.67 ± 0.87 <0.001 BMI (kg/m2) 24.80 ± 0.27 24.47 ± 0.11 23.92 ± 0.14 23.71 ± 0.32 0.002 WC (cm) 85.14 ± 0.74 83.13 ± 0.33 80.92 ± 0.43 79.33 ± 0.88 <0.001
ASW (kg) 13.89 ± 0.18 14.01 ± 0.08 14.07 ± 0.09 13.77 ± 0.22 0.480
ASW/Wt (%) 24.34 ± 0.23 24.61 ± 0.11 24.71 ± 0.13 24.63 ± 0.25 0.597 Total body fat (%) 35.21 ± 0.41 34.77 ± 0.24 34.78 ± 0.26 34.31 ± 0.52 0.603 SBP (mmHg) 133.86 ± 1.29 128.26 ± 0.64 126.43 ± 0.88 126.53 ± 2.85 <0.001 DBP(mmHg) 78.12 ± 0.74 78.34 ± 0.36 78.59 ± 0.47 79.66 ± 1.32 0.724 25(OH)D (ng/mL) 17.69 ± 0.60 18.64 ± 0.29 17.82 ± 0.37 18.37 ± 0.73 0.091 Smoking (%)
None 78.2 91.6 94.7 89.8 <0.001
Ex 4.8 2.1 1.7 1.3
Current 17.0 6.4 3.6 8.9
Alcohol use (%) 0.002
None 66.5 45.8 53.5 54.1
≤ 1/week 29.9 45.5 41.3 39.2
2–3/week 1.9 5.8 3.3 5.0
≥ 4/week 1.7 2.9 1.9 1.6
Family incomea(%) <0.001
< 100 42.8 34.6 18.7 14.8
100–199 21.7 20.1 19.1 23.7
200–299 10.6 15.4 18.4 17.7
≥ 300 24.9 29.9 43.9 43.8
Less than high school education (%)
98.2 87.2 60.4 54.7 <0.001
Residence in urban area (%) 29.5 41.2 54.1 50.8 <0.001
Regular exerciseb(yes, %) 17.0 13.6 13.3 13.0 0.656
Total energy intake (kcal) 1,446.05 ± 48.11
1,610.98 ± 26.19
1,627.13 ± 33.05
1,628.50 ± 84.30
0.010
Carbohydrate intake 276.83 ± 9.50 298.68 ± 4.99 297.42 ± 7.09 294.15 ± 16.52 0.220 Protein intake (g/day) 44.85 ± 1.73 53.85 ± 1.15 56.16 ± 1.29 56.87 ± 3.28 <0.001 Fat intake (g/day) 18.78 ± 1.42 23.88 ± 0.88 26.02 ± 0.81 26.82 ± 2.40 <0.001
Diabetes (%) 17.1 15.9 11.5 12.1 0.144
Known hypertension (%) 58.8 40.4 31.9 26.4 <0.001
Known arthritis (%) 41.6 39.0 29.5 28.7 0.003
Previous stroke (%) 4.2 2.8 2.2 1.8 0.609
Previous CVD (%) 7.0 2.9 3.1 2.0 0.053
Age at menarche (years) 15.65 ± 0.12 16.14 ± 0.07 15.51 ± 0.10 15.24 ± 0.24 <0.001 Age at menopause (years) 49.02 ± 0.36 49.70 ± 0.13 50.09 ± 0.15 49.99 ± 0.38 0.020 Pregnancies (n) 6.33 ± 0.22 5.30 ± 0.08 4.33 ± 0.09 3.35 ± 0.17 <0.001
OC (ever, %) 14.8 26.8 19.9 13.4 0.001
HRT (ever,%) 9.8 14.0 16.8 23.8 0.054
Sarcopenia (%) 46.8 35.5 32.1 31.4 0.013
Sarcopenic obesity (%) 30.7 21.6 16.4 11.7 <0.001
Data are expressed as mean ± SD for continuous variables and as weighted percentages for categorical variables. Body mass index (BMI), cardiovascular disease (CVD), diastolic blood pressure (DBP), hormone replacement therapy (HRT), oral contraceptive (OC), systolic blood pressure (SBP), waist circumference (WC), body weight. (Wt).
aUnit is thousands Korean won/month.
bRegular exercise is indicated as “yes” when the subject does moderate exercise on a regular basis (for more than 30 minutes at a time, more than 5 times per week).
Table 3. Association of variables with sarcopenic obesity in postmenopausal women
Odds ratio 95% CI P-value
Age (years) 1.007 0.987-1.027 0.501
SBP (mmHg) 1.000 0.990-1.010 0.942
DBP (mmHg) 1.027 1.008-1.046 0.005
25(OH)D (ng/mL) 0.962 0.942-0.982 <0.001
Smoking
None 1.00(ref.) 1.00(ref.)
Ex 1.519 0.617-3.740 0.362
Current 0.671 0.369-1.219 0.189
Alcohol use
None 1.00(ref.) 1.00(ref.)
≤ 1/week 1.240 0.934-1.647 0.136
2-3/week 1.123 0.496-2.540 0.780
≥ 4/week 1.662 0.602-4.592 0.326
Family incomea
< 100 0.804 0.570-1.133 0.211
100-199 0.911 0.659-1.260 0.573
200-299 0.806 0.521-1.247 0.332
≥ 300 1.00(ref.) 1.00(ref.)
Education
More than high school education 1.00(ref.) 1.00(ref.)
Less than high school education 1.497 0.966-2.321 0.071
Residence
Rural area 1.00(ref.) 1.00(ref.)
Urban area 1.034 0.769-1.390 0.826
Regular exerciseb
No 1.00(ref.) 1.00(ref.)
Yes 1.039 0.714-2.512 0.842
Total energy intake (kcal) 0.999 0.997-1.001 0.532
Carbohydrate intake 1.000 0.992-1.009 0.952
Protein intake (g/day) 1.012 1.001-1.023 0.040
Fat intake (g/day) 1.010 0.988-1.032 0.377
Diabetes 1.290 0.924-1.800 0.134
Known hypertension 1.976 1.478-2.642 <0.001
Known arthritis 1.941 1.529-2.465 <0.001
Previous stroke 0.861 0.431-1.719 0.670
Previous CVD 0.936 0.498-1.761 0.838
Age at menarche (years) 0.981 0.919-1.046 0.554
Age at menopause (years) 0.987 0.854-1.022 0.454
Pregnancies (n) 1.012 0.957-1.070 0.669
OC (ever) 0.995 0.761-1.301 0.970
HRT (ever) 0.596 0.406-0.875 0.008
Age group at first childbirth
≤ 19 1.719 1.091-2.711 0.020
20–24 1.209 0.893-1.638 0.219
25–29 1.00(ref.) 1.00(ref.)
≥ 30 0.748 0.359-1.559 0.437
Cardiovascular disease (CVD), diastolic blood pressure (DBP), hormone replacement therapy (HRT), oral contraceptive (OC), systolic blood pressure (SBP).
aUnit is thousands Korean won/month.
bRegular exercise is indicated as “yes” when the subject does moderate exercise on a regular basis (for more than 30 minutes at a time, more than 5 times per week).