저작자표시-비영리-변경금지 2.0 대한민국 이용자는 아래의 조건을 따르는 경우에 한하여 자유롭게
l 이 저작물을 복제, 배포, 전송, 전시, 공연 및 방송할 수 있습니다. 다음과 같은 조건을 따라야 합니다:
l 귀하는, 이 저작물의 재이용이나 배포의 경우, 이 저작물에 적용된 이용허락조건 을 명확하게 나타내어야 합니다.
l 저작권자로부터 별도의 허가를 받으면 이러한 조건들은 적용되지 않습니다.
저작권법에 따른 이용자의 권리는 위의 내용에 의하여 영향을 받지 않습니다. 이것은 이용허락규약(Legal Code)을 이해하기 쉽게 요약한 것입니다.
Disclaimer
저작자표시. 귀하는 원저작자를 표시하여야 합니다.
비영리. 귀하는 이 저작물을 영리 목적으로 이용할 수 없습니다.
변경금지. 귀하는 이 저작물을 개작, 변형 또는 가공할 수 없습니다.
[UCI]I804:24011-200000241089
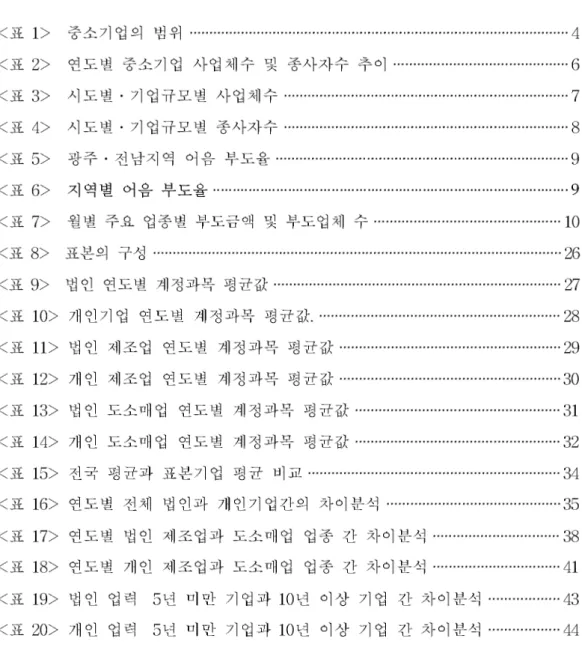
表 目 次
Min-Kyung, Choi Advisor : Prof. Kae-Won Lee, ph. D.
Department of Business Administration Graduate School of Business Administration, Chosun University
This research is for finding out financial affairs of small and medium enterprises in Gwangju, Chonnam Provinces and see if there are any differences from analyze financial ratio from different kind of companies and suggest to make better financial structure.
According to report, there are differences on financial ratio from different kind of companies and corporate companies were higher than self-employee companies on debt ratio, interest coverage ratio, static long-term suitability.
The self-employee(private)companies were higher than corporate companies on the ratio of operating profit to the net sales, the ratio of net profit to net sales, the turnover of net ratio from the ratio of total assets business profit. It shows that there were high efficiency.
These results show the significant difference on the accounting of an individual enterprise and incorporated enterprise.
Statistically, In the financial ratios of the type of business did not show significant results. The efficiency of capital is higher Wholesale and retail businesses corporation than high manufacturing business.
Private manufacturing companies on reliance of debt and ability to use the interest payments on debt is higher than Wholesale and retail businesses corporation.
On business might in financial ratio each year did not show similar results.
A solid corporate have a high profit margin and a ability to cope with crisis situations and the ability to overcome.
Through the analysis of financial ratios such as the following four kinds of ways to improve the financial structure proposed.
First, It should enhance financial flexibility.
Second, It should create high rate of profit by sales as well as the cost reduction.
Third, It should enlarge equity capital. Fourth, It should improve the quality of loans.
제 절 1 연구의 목적
제 절 중소기업의 특성 1
1) 독립성기준 소유와 경영의 실질적인 독립성이 다음 모두에 해당하는 기업: 가 상호출자제한 기업집단에 속하지 아니하는 회사일 것. .
나 자산총액이 천 억원 이상인 법인이 발행주식 의결권 없는 주식 제외. 5 ( .) 총수의100분의 30 이상 을 직접 또는 간접적으로 소유하고 있는 기업이 아닐 것.
다 관계회사에 속하는 기업의 경우에는 상시 근로자 수 자본금 매출액 자기자본 또는 자산총액이. , , , 졸업기준을 초과하는 기업이 아닐 것.
지역
분류 전체
(A+B+C)
중소기업 대기업
소기업(A) 중기업 (C)
(B) 소계
(A+B) 소상공인
전 국 13,070,424
(100.0) 5,194,991
(39.7) 7,835,068
(59.9) 3,632,645
(27.8) 11,467,713
(87.7) 1,602,711 (12.3) 서 울 3,346,046
(100.0) 1,141,878
(34.1) 1,662,015
(49.7) 1,054,165
(31.5) 2,716,180
(81.2) 629,866 (18.8)
부 산 948,057
(100.0) 406,378
(42.9) 603,559
(63.7) 275,141
(29.0) 878,700
(92.7) 69,357 (7.3)
대 구 591,308
(100.0) 287,456
(48.6) 409,320
(69.2) 149,589
(25.3) 558,909
(94.5) 32,399 (5.5)
인 천 626,762
(100.0) 256,360
(40.9) 402,826
(64.3) 177,029
(28.2) 579,855
(92.5) 46,907 (7.5)
광 주 365,690
(100.0) 152,586
(41.7) 231,070
(63.2) 101,146
(27.7) 332,216
(90.8) 33,474 (9.2)
대 전 330,088
(100.0) 141,643
(42.9) 202,074
(61.2) 94,541
(28.6) 296,615
(89.9) 33,473 (10.1)
울 산 344,287
(100.0) 105,081
(30.5) 158,172
(45.9) 101,538
(29.5) 259,710
(75.4) 84,577 (24.6) 경 기 2,848,961
(100.0) 1,102,935
(38.7) 1,803,646
(63.3) 758,767
(26.6) 2,562,413
(89.9) 286,548 (10.1)
강 원 332,852
(100.0) 178,391
(53.6) 244,927
(73.6) 69,121
(20.8) 314,048
(94.4) 18,804 (5.6)
충 북 392,529
(100.0) 157,275
(40.1) 240,191
(61.2) 110,145
(28.1) 350,336
(89.3) 42,193 (10.7)
충 남 501,319
(100.0) 200,435
(40.0) 300,499
(59.9) 131,442
(26.2) 431,941
(86.2) 69,378 (13.8)
전 북 368,089
(100.0) 176,072
(47.8) 250,435
(68.0) 92,225
(25.1) 342,660
(93.1) 25,429 (6.9)
전 남 385,088
(100.0) 190,195
(49.4) 265,124
(68.8) 88,719
(23.0) 353,843
(91.9) 31,245 (8.1)
경 북 661,612
(100.0) 281,421
(42.5) 416,046
(62.9) 158,049
(23.9) 574,095
(86.8) 87,517 (13.2)
경 남 898,949
(100.0) 350,129
(38.9) 549,656
(61.1) 241,963
(26.9) 791,619
(88.1) 107,330 (11.9)
제 주 128,787
(100.0) 66,756
(51.8) 95,508
(74.2) 29,065
(22.6) 124,573
(96.7) 4,214 (3.3)
한국은행홈페이지(http://www.bok.or.kr 지역본부 광주전남> >
2) 이의영 외, “중소기업의 경제분석”, 도서출판 해남, 2003, p47
제 절 재무비율 분석 2
할
제 절 선행연구의 검토 3
제 절 1 주요 재무비율
유동부채 유동자산
×
유동부채
당좌자산
×
자기자본 부채
×
총자본
부채
×
지급이자와할인률 영업이익
자기자본
비유동부채 비유동자산
고정자산×
매출액
영업이익
×
매출액 당기순이익
×
총자본
평잔순이익
× 매출액
순이익
총자본
매출액
총자산 매출액
자기자본
매출액
제 절 분석결과 및 해석 2
구 분 기업 수
수집된 자료 250개
자료 결측 값 25개
건 설 업 17개
기타 업종 21개
예외 값 19개
최종 표본 제조 도소매( , ) 168개 기업 / 년간
구 분 2007년 2008년 증 감 2009년 증 감
유동자산 36,530 48,895 33.85 60,738 24.22
비유동자산 102,826 106,367 3.44 117,984 10.92
자산총계 139,731 155,262 11.76 178,723 15.05
유동부채 10,961 15,855 44.65 31,835 100.79
비유동부채 35,208 42,709 21.30 48,847 14.37
부채총계 46,169 58,564 26.85 82,808 41.40
자본금 93,560 111,575 19.26 95,952 △14.02
매출액 459,124 554,047 20.67 569,479 2.79
영업이익 26,255 29,571 12.63 30,312 2.51
지급이자와할인료 1,711 2,020 18.06 1,754 △13.17
당기순이익 23,444 27,520 17.39 28,488 3.52
구 분 2007년 2008년 증 감 2009년 증 감
유동자산 570,979 590,036 3.34 639,263 8.34
비유동자산 661,450 686,774 3.83 713,297 3.86
자산총계 1,232,429 1,276,810 3.60 1,352,957 5.96 유동부채 361,687 286,848 △20.69 313,461 9.28
비유동부채 468,734 515,727 10.03 535,726 3.88
부채총계 830,421 802,575 △3.35 849,188 5.81
자본금 220,012 222,012 - 222,012 -
매출액 2,040,623 2,293,581 12.40 2,086,827 △9.01
영업이익 90,475 102,146 12.90 93,003 △8.95
지급이자와할인료 24,363 36,393 49.38 34,919 △4.05
당기순이익 62,945 72,517 15.21 61,835 △14.73
구 분 2007년 2008년 증 감 2009년 증 감
유동자산 553,489 603,005 8.95 788,883 30.83
비유동자산 148,557 167,640 12.85 244,444 45.81
자산총계 702,046 770,645 9.77 1,033,328 34.09 유동부채 420,155 284,763 △32.22 336,542 18.18
비유동부채 66,120 172,768 162.29 343,285 98.70
부채총계 486,276 457,532 △5.91 679,827 48.59
자본금 95,000 110,000 15.79 110,000 -
매출액 1,802,366 2,748,947 52.52 3,251,814 18.29
영업이익 44,013 87,577 98.98 105,897 20.92
지급이자와할인료 4,102 13,200 221.79 20,402 54.56
당기순이익 37,592 73,372 95.18 73,354 △0.02
구 분 2007년 2008년 증 감 2009년 증 감
유동자산 37,327 52,920 41.77 75,256 42.21
비유동자산 67,449 67,843 0.58 69,189 1.98
자산총계 104,793 120,742 15.19 144,446 19.63
유동부채 8,481 18,688 120.32 38,719 107.18
비유동부채 21,389 21,680 △0.04 32,733 50.98
부채총계 29,870 40,369 35.15 71,452 76.99
자본금 74,921 80,374 7.28 72,994 △9.18
매출액 509,791 623,442 22.29 648,627 4.04
영업이익 22,484 25,264 12.36 27,006 6.90
구 분 업력형태 2007년 2008년 2009년
평 균 t 평 균 t 평 균 t
유동비율 5년 미만 204.29 1.057 (0.302)
348.16 .628 (0.536)
362.3 1.074 (0.294) 년 이상
10 102.24 214.58 249.8
당좌비율 5년 미만 189.22 1.033 (0.313)
179.67 .615 (0.544)
285.6 .829 (0.416) 년 이상
10 86.50 125.79 205.4
부채비율 5년 미만 159.66 -.715 (0.482)
153.17 -.514 (0.612)
150.7 -.436 (0.667) 년 이상
10 170.54 159.17 155.6
이자보상비율 5년 미만 19.11 .733 (0.471)
3.98 -.099 (0.922)
15.3 .723 (0.477) 년 이상
10 2.15 4.44 3.6
비유동장기적합률 5년 미만 98.32 -.489 (0.630)
83.32 -.910 (0.372)
83.3 -.805 (0.430) 년 이상
10 129.52 122.26 119.3
매출액영업이익률 5년 미만 3.34 .588 (0.562)
4.21 .662 (0.515)
4.4 .103 (0.919) 년 이상
10 2.51 2.99 4.2
매출액순이익률 5년 미만 3.21 1.178 (0.251)
3.70 .684 (0.501)
3.6 .193 (0.849) 년 이상
10 1.96 2.87 3.4
총자산영업이익률 5년 미만 7.40 .489 (0.630)
8.76 1.011 (0.322)
10.4 1.970 (0.062) 년 이상
10 5.52 4.79 6.2
총자산순이익률 5년 미만 7.43 .764 (0.453)
9.09 2.734 (0.096)
9.3 2.389 (0.026) 년 이상
10 4.49 4.02 4.6
총자산회전률 5년 미만 2.23 -.778 (0.445)
3.07 .756 (0.457)
3.01 1.389 (0.126) 년 이상
10 3.22 2.21 2.14
자기자본회전율 5년 미만 7.13 -2.796 (0.011)
8.07 -2.254 (0.034)
7.79 -1.446 (0.163) 년 이상
10 9.73 10.51 11.67
구 분 업력형태 2007년 2008년 2009년
평 균 t 평 균 t 평 균 t
유동비율 5년 미만 202.87 .823 (0.414)
230.52 1.150 (0.255)
196.71 .920 (0.363) 년 이상
10 327.06 366.90 295.82
당좌비율 5년 미만 139.46 -.869 (0.388)
127.32 -.556 (0.581)
112.45 -.405 (0.688) 년 이상
10 159.56 126.92 106.04
부채비율 5년 미만 186.06 -1.025 (0.309)
223.81 -.455 (0.651)
224.13 -.891 (0.378) 년 이상
10 252.69 267.25 312.09
이자보상비율 5년 미만 4.56 .767 (0.446)
1.01 .016 (0.987)
0.09 -1.324 (0.193) 년 이상
10 0.69 1.00 1.90
비유동장기적합률 5년 미만 59.72 -2.017 (0.048)
130.73 .939 (0.352)
92.23 .459 (0.649) 년 이상
10 77.73 57.71 82.42
매출액영업이익률 5년 미만 6.96 .759 (0.451)
5.85 -.054 (0.957)
4.84 -.806 (0.425) 년 이상
10 6.03 5.90 5.66
매출액순이익률 5년 미만 6.35 .686 (0.495)
5.72 .491 (0.626)
4.34 -.944 (0.351) 년 이상
10 5.33 5.28 5.38
총자산영업이익률 5년 미만 69.63 2.537 (0.014)
62.21 1.975 (0.054)
28.52 -.199 (0.843) 년 이상
10 29.80 26.40 31.27
총자산순이익률 5년 미만 69.38 2.511 (0.015)
62.22 1.957 (0.056)
28.88 -.194 (0.847) 년 이상
10 29.73 26.28 31.61
총자산회전률 5년 미만 2.76 1.997 (0.051)
3.77 2.359 (0.022)
4.35 .420 (0.677) 년 이상
10 6.83 5.01 5.54
자기자본회전율 5년 미만 8.42 1.700 (0.094)
6.28 .982 (0.330)
8.23 -.623 (0.536) 년 이상
10 9.24 7.40 9.87
학 과 경 영 학 번 20099028 과 정 석사 성명 한글 최 민 경: 한문: 崔 珉 境 영문: Min-Kyung, Choi
주소 광주광역시 남구 진월동 하늘연가아파트 102동 206호
연락처 E-mail : [email protected]
논문제목
한글 : 광주 · 전남 중소기업의 패널별 재무적 특성에 관한 연구 영문 : A Study on the Financial Properties in Panel data
of Small and Medium Industries in Gwangju, Chonnam