As a criterion for choosing a suitable solvent, not only the reduction of carbon dioxide, but also the recirculation of collected carbon dioxide was observed. Water was used as a basic comparison of the experiments and pure solvents were used to increase the dissolved amount of carbon dioxide.
Introduction
12] Biogas is generated by anaerobic digestion of anaerobic organisms, and methane and carbon dioxide are the main components. 18] We have investigated the possibility of exploiting the structural properties of acetone, which is commonly used in everyday life, to capture carbon dioxide.
Background
- Absorption method
- Water scrubbing
- Amine absorption / scrubbing
- Organic solvent sorption / scrubbing
- Membrane separation method
- Adsorption method
- Objective of this research
Adsorption technology using solid adsorbents for carbon dioxide capture is one of the best technologies for CCS. In a temperature swing system, the temperature of the system increases as carbon dioxide is adsorbed from the adsorbent.
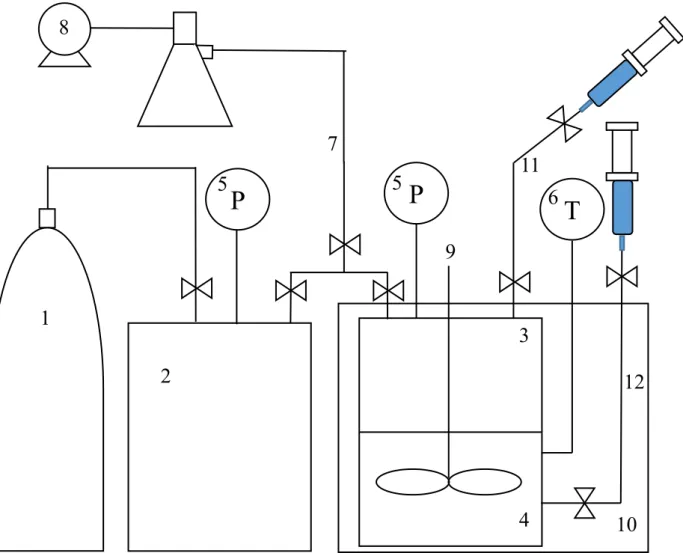
![Fig. 2 Gas absorption process schematic diagram [21]](https://thumb-ap.123doks.com/thumbv2/123dokinfo/10513707.0/15.892.232.648.121.548/fig-2-gas-absorption-process-schematic-diagram-21.webp)
Materials and methods
Materials
Therefore, to solve this drawback, experiments were carried out on solvents with a high solubility of carbon dioxide. Carbon dioxide is known to be relatively highly soluble in solvents containing ether and carbonyl groups. Experiments were performed in the same way using solvents with ether bond and carbonyl groups, and experiments were also performed using solvents such as alcohols and glycol with hydroxyl groups.
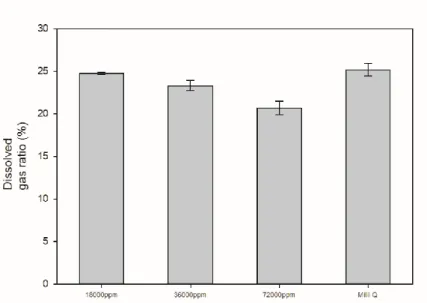
Experiments were conducted under artificial seawater conditions to determine whether seawater could be used without degrading performance by exploiting water's high selectivity for carbon dioxide and methane. It was an experiment aimed at confirming the possibility of using sea water for carbon dioxide absorption process. Composition of artificial seawater condition was prepared with concentration of and 72000ppm respectively by reference.
The solution was prepared taking into account the volume of the reactor and the density of the solution, and the experiment was carried out. Mixing of acetone and solvent, mixing of acetone and NaI salt as well as experiments with acetone/water/NaI were carried out.
Experimental method
Under the given experimental conditions, the dissolved gas ratio was calculated by the following equation according to the pressure reduction ratio. Close the syringe with parafilm and measure the composition of the sampled gas by gas chromatography. A small amount of liquid in which the gas is dissolved in the syringe is sampled through a valve connected to the liquid layer.
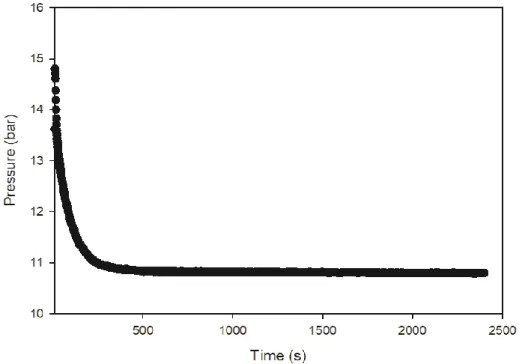
Similarly, the composition of the degassed AD gas was measured by gas chromatography (Agilent 7820A) and the volume of the degassed AD gas was measured using a. To compare the volume of degassed AD gas of the solutions used in the experiments, the following equation was used. The experimental conditions were as follows: the internal temperature of the reactor was 15℃ and the initial pressure was 15 bar.
The volume ratio of the solution to the gas was 1:1, and the experiment was conducted by varying the volume ratio in the experiment to determine the influence on the volume ratio. The composition of the solutions used in the experiments is described in the description of each result.
Results
Water section
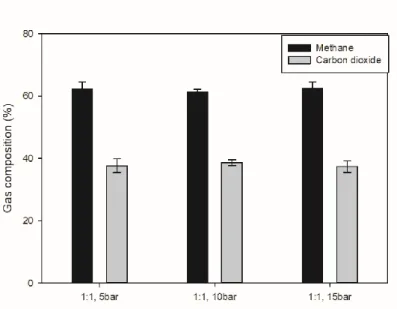
- Effect of initial pressure
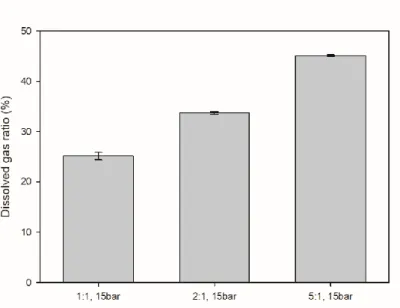
- Effect of gas/water volume ratio
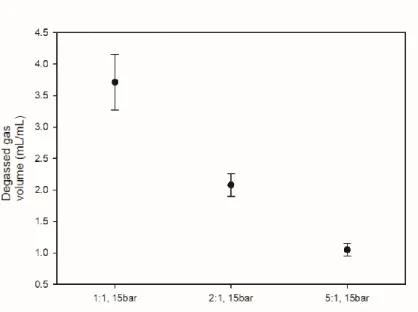
The initial pressure of the gas was set at 15 bar and the volume ratio in the gas and water reactor was used as an experiment. The initial pressure was set at 15 bar and the experiment was carried out using the volume ratio of water and gas as parameters. As the volume of water increased, the proportion of dissolved gas in the reactor tended to increase.
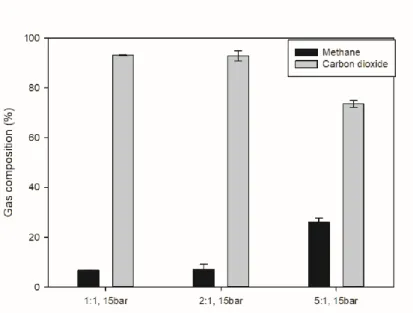
15 shows the composition of the residual gas after the reaction when the volume ratio between water and gas is used as a parameter. 16 shows the composition of the degassed AD gas when the volume ratio of water to gas is used as a parameter. As the amount of water increased, the proportion of methane in the degassed AD gas increased and the proportion of carbon dioxide decreased relatively.
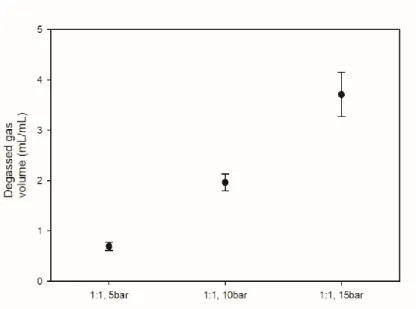
17 shows the amount of degassed AD gas volume according to the volume ratio of water and gas at the same initial pressure. As the amount of water increases, the volume of dissolved gas decreases with the amount of water, so the volume of degassed AD gas decreases.
Aqueous solution section
- Effect of functional group
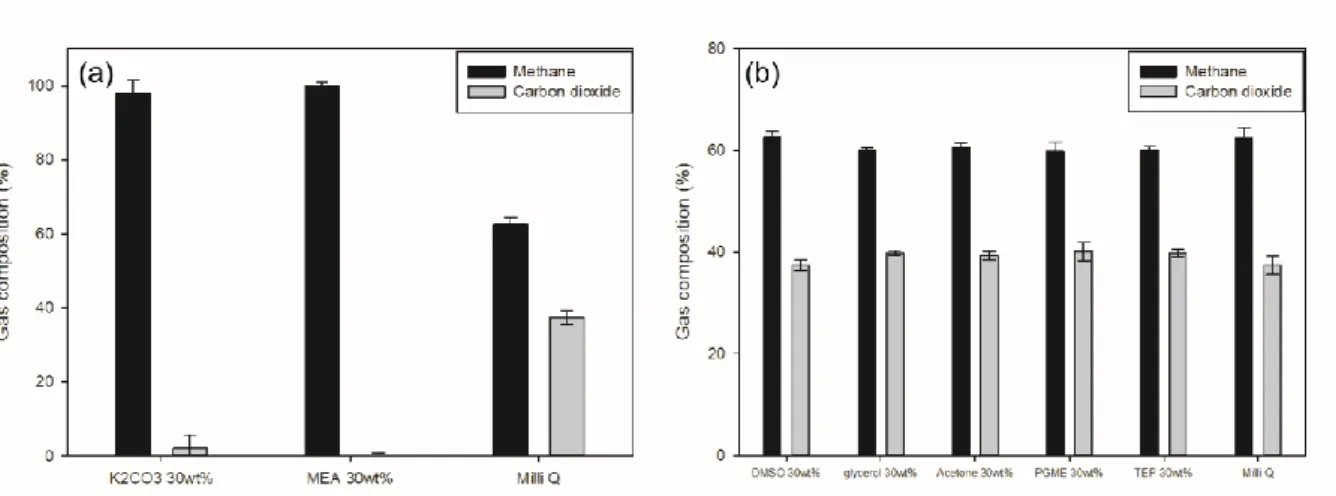
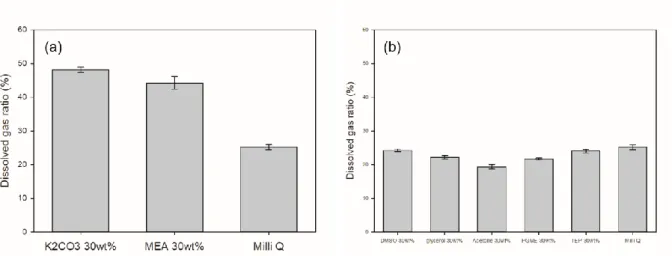
In the case of the aqueous solution, except for the strong base, the dissolved gas ratio was lower than that of pure water, but the removal rate of the carbon dioxide in the aqueous solution was similar to that of the previous case. Based on these experimental data, the aqueous solution also appeared to have no benefit. 19 (a) Aqueous solution with strong base (K2CO3, MEA), (b) Aqueous solution with organic solvent. DMSO, Glycerol, Acetone, PGME, TEP) Residual gas composition in aqueous solution at an initial pressure of 15 bar, 1:1 ratio of solution: gas volume.
From this experiment it was also found that the aqueous solution has no other benefit. 20 Organic solvent aqueous solution (DMSO, Glycerol, Acetone, PGME, TEP) degassed AD gas composition in aqueous solution at the initial pressure of 15 bar, 1:1 ratio of solution: gas. 21 (a) Strong base aqueous solution (K2CO3, MEA) (b) organic solvent aqueous solution (DMSO, Glycerol, Acetone, PGME, TEP) degassed AD gas volume in aqueous solution at the.
The aqueous solution under pressure was collected from the reactor and the volume of the collected gas was measured using the water exchange method. It has been confirmed that reuse of an aqueous solution of a strong base requires heating due to high energy consumption.
Pure solvent section
- Effect of functional group
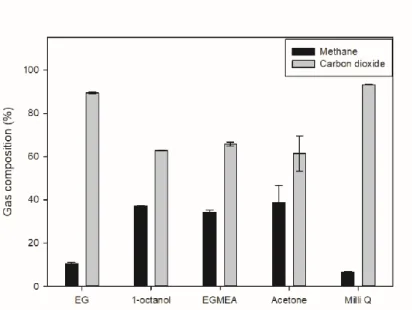
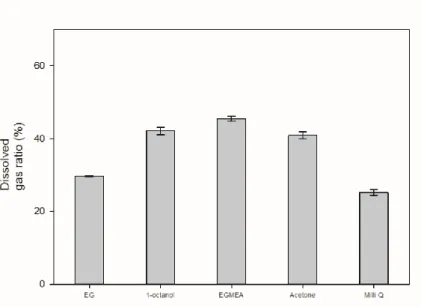
Ethylene glycol and 1-octanol showed similar results to water, while EGMEA showed a residual composition of methane and carbon dioxide of about 70:30. Based on the above dissolved gas ratio results, the results were similar due to the low solubility of ethylene glycol and water in carbon dioxide itself, and the dissolution rates of 1-octanol and EGMEA were much higher in comparison with water, it was judged that the above results were obtained because the solubility in methane was high relative to the observed somewhat higher composition. Acetone showed a high amount of carbon dioxide removal compared to the other solvents and a residual composition of methane and carbon dioxide of about 80:20 was observed.
24, the composition of degassed AD gas was measured from the solvent decompression process. The solubility of water and ethylene glycol was lower than that of the other solvents, but the solubility of methane was lower than that of carbon dioxide. Therefore, it was confirmed that the ratio of carbon dioxide in the composition of degassed AD gas was high.
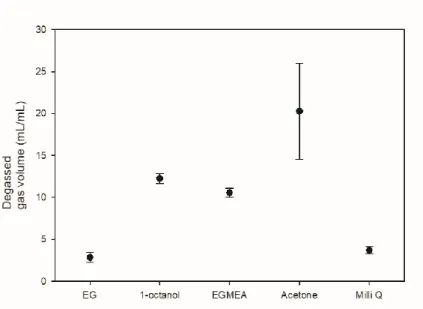
By combining the above four figures, we have determined that acetone is suitable for the purpose of the experiment and conducted experiments to solve the disadvantage of acetone which is the low selectivity of carbon dioxide/methane of degassed AD gas. The results for all pure solvents used in the experiments are summarized in the table.
Artificial sea water section
- Effect of salt concentration in artificial sea water
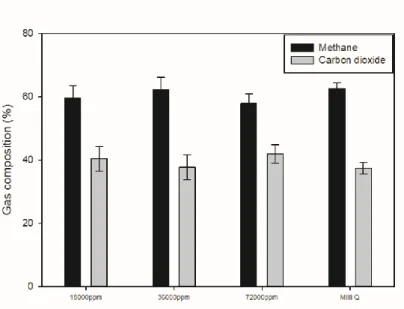
It was observed that the ratio of degassed carbon dioxide increased from pure water under the conditions of salt-added artificial seawater. Although the increase in numerical value is not large, the rate at which the selectivity of carbon dioxide and methane increases is high. This result is due to the fact that the salt has the effect of pushing out the carbon dioxide dissolved in the water due to the salting out effect while it is present in the water.
Therefore, it was concluded that the addition of salt may have advantages in terms of degassing for carbon dioxide recycling, which is the purpose of this experiment. The artificial seawater condition was found to be slightly lower than the pure water condition, but overall there was no significant difference. Based on these data, it was confirmed that the addition of salt could play a positive role in the purpose of the experiment.
Acetone base solution section
- Effect of gas/liquid ratio in pure acetone
- Effect of salt concentration in acetone solution
- Effect of gas/liquid ratio, initial gas composition in NaI 20 wt% acetone
- Effect of water addition in NaI/acetone solution
- Effect of water/acetone ratio in tertiary system solution
- Results trend by simulation in tertiary system solution
After the reaction reached equilibrium, the composition of the residual gas was measured in Fig. In the water experiment, the residual carbon dioxide composition tended to decrease with increasing water volume ratio. It was observed that the dissolved gas ratio in the 20 wt% acetone solution was decreased.
After the completion of the reaction, the composition of the residual gas was confirmed in Fig. Finally, the degassed AD gas volume results were confirmed for this experiment in Fig. Then, the composition of degassed AD gas was confirmed in a 20 wt% acetone solution of NaI concentration.
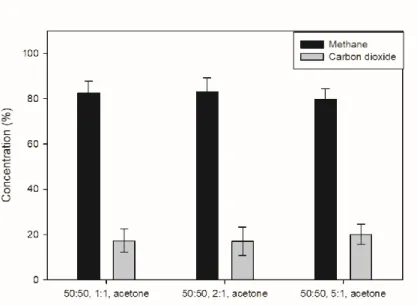
It was observed that the volume of the degassed AD gas decreased as the volume ratio of the solution increased under the condition of the composition of 50:50. However, the proportion of methane in the composition of the degassed AD gas was still high after addition of NaI salt. When the composition of the degassed AD gas was observed, the trend of the composition of the residual gas after the reaction was reversed.
51(b) shows the trend of the composition of degassed carbon dioxide by simulating the same method.
Conclusions
Orr, J.C., et al., Anthropogenic ocean acidification over the twenty-first century and its impact on calcifying organisms. Hy, Y.F., et al., Physicochemical characterization of rice straw pretreated with sodium hydroxide in the solid state for enhancing biogas production. Ramdin, M., et al., Solubility of CO2 and CH4 in ionic liquids: ideal CO2/CH4 selectivity.
Park, S.H., et al., The quantitative evaluation of two-stage pre-combustion CO2 capture processes using the physical solvents with different design parameters. Chung, T.S., et al., Mixed matrix membranes (MMMs) comprising organic polymers with dispersed inorganic fillers for gas separation. Carcia, P.F., et al., Ca testing of Al2O3 gas diffusion barriers grown by atomic layer deposition on polymers.
Li, J.F., et al., Effect of TiO2 nanoparticles on surface morphology and performance of microporous PES membrane. Wu, G., et al., High-Performance Electrocatalysts for the Reduction of Oxygen Derived from Polyaniline, Iron, and Cobalt.