Voltage and Frequency Ranges for Some Important Parameters That Are Measured in the Human Body
Electro---Grams
ElectroCardioGram
Cardiac Conduction System
The Action potential that started from the SA (sinoatrial) node (동방결절) propagates down to atrium to reach the Atrioventricular node (심방결 절).
The separation between the atrium and ventricle is called the Atirioventrical Ring (방실환) and acts as an insulation (with only 0.05 m/sec conduction velocity). This has a critical function of allowing a delay about 0.1 sec which is enough to finish atrial contraction before ventricular contraction starts.
(The conduction velocity is about 1m/sec within the atrium and ventricle)
The AP travels from the AV node through His’
bunble at a speed of 4m/sec to arrive at the
Purkinje network in the right and left branches of the central septum. Here the conduction is at
The Einthoven Triangle
Pacemaker voltage: The
repetitive depolarization state in the SA node.
The propagation of the AP in the heart can be presented as a dipole vector that moves
within the Einthoven Triangle drawn by him to record the
ECG by the standard limb lead method(사지유도방식).
1
Lead Connections
Standard Line Lead: Bipolar measurement
Augmented Lead: Unipolar measurement
Heart as a Dipole Vector (at lead 2)
- (P) The AP that started from SA node propagates to the atrium then reaches to the AV node. The direction of the vector is bottom left.
- (QRS) The AP in the ventricle starts from the interventricular septum at the center and propagates to both left and right. The direction of vector is bottom right. (Q phase, phase 1)
The depolarization continues to propagate from center to outside of the ventricle.
Vector direction is to the bottom left. (R, phase 2)
The last place to be excited is the top and posterior side of the septum. The vector points to top and right. (S, phase 3)
- (T) The repolarization in the ventricle propagates from the outer wall to the inner wall. This is opposite to the direction of R wave but considering the polarity of the dipole, the vector directs to bottom and left.
Right Left
Precordial lead and Standard 12 lead
Precordial lead(or chest lead)
records the ECG by looking at the heart from the transverse plane and records the ECG with larger magnitude.
Including the standard line leads,
augmented leads, and precordial
leads, there are 12 leads total and
the system is called the Standard
12 lead system.
ECG dependency on leads
• Lead II: sees the main vector almost in parallel → largest positive P,R,T waves, very small negative Q, S waves.
• Lead I & aVF: not parallel to the main vector → mostly positive but, small
• Lead III: faces the main vector at almost right angle→ small QRS wave,
• aVL: slightly opposite direction → negative QRS wave.
• aVR: truly opposite direction → large negative R wave, small negative P & T waves
• Lead I: RA (-) to LA (+)
• Lead II: RA (-) to LL (+)
Normal ECG
Diagnosis
Diagnosis parameter: heart output, output under stress, anatomy electrical conductivity, blood pressure, valve leakage...
For example)
If, QRS duration is too long
• Incomplete right or left bundle branch block (SAAV bundle fiber)
• Inverted T (repolorization problem; shorter AP at ventricular apex than at ventricular base)
Normal variability in 12 lead ECG
Measurements
– Heart rate: 60 - 90 bpm
– PR interval: 0.12 - 0.20 sec
– QRS duration: 0.06 - 0.10 sec
– QT interval: QTc ≤ 0.40 sec
Fibrillation and Defibrillation
Fibrillation(
세동): In normal, once an action potential is initiated, a new action potential cannot be initiated for the refractory period. But, in arrhythmia (
부정맥) patients, there is uncoordinated contraction of the cardiac muscle of the ventricles in the heart, making them quiver rather than
contract properly. Ventricular fibrillation is especially a cause of cardiac arrest (
심장마비; Do not get confused with Heart Attack (
심장발작,
경색)) . The condition can often be
reversed by the resuscitation (
소생술) or an electrical defibrillator (
제세동기).
For BiVentricular Degibrillator Implantation see from 10 minute point of or-live.com video:
Implantable cardioverter-defibrillator (ICD)
A small battery-powered electrical impulse generator
implanted in patients who are at risk of sudden cardiac death due to ventricular fibrillation.
The device is programmed to
detect cardiac arrhythmia and
correct it by delivering a jolt of
electricity
Defibrillator
Other Biopotentials
EMG EEG
Visually Evoked Potentials
Auditorily Evoked Potentials
EEG
• EEG configuration
21 electrodes, z~10k Ω max Top view
Each electrode can detect circles of 1cm diameter.
Intensity of the signal α ∝ 1/r
2Nose
. . . . . . . . .
20
20 10
32 channel
EEG
EEG
Dead Epilepsy
Awake
Deep sleep Light sleep 50uV
100ms
Wave δ θ α β γ
0 ~ 4 ~ 8 ~ 13 ~ 22 ~ 30
EEG source
Scalp EEG measures summated activity of post-synaptic currents.
While it is post-synaptic potentials that generate the EEG signal, it is not possible to determine the activity within a single dendrite or neuron from the scalp EEG. Rather, surface EEG is the summation of the synchronous activity of thousands of neurons that have similar spatial orientation, radial to the
scalp. Currents that are tangential to the scalp are not picked up by the EEG.
The EEG therefore benefits from the parallel, radial arrangement of apical dendrites in the cortex. Because voltage fields fall off with the fourth power of the radius, activity from deep sources is more difficult to detect than currents near the skull.
Scalp EEG activity is composed of multiple oscillations. These have different characteristic frequencies, spatial distributions and associations with different states of brain functioning (such as awake vs. asleep). These oscillations represent synchronized activity over a network of neurons. The neuronal network underlying some of these oscillations are understood (such as the thalomocortical resonance underlying sleep spindles), while many others are not (e.g., the system that generates the posterior basic rhythm still defies
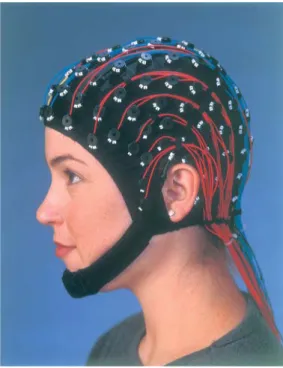
Electroencephalography (EEG) and magnetoencephalography (MEG) are non-invasive techniques for detecting and localizing electrical activities of the central nervous system. EEG systems measure the electric potentials induced on the surface of the scalp using electrodes (see Fig. 1). MEG systems measure the magnetic fields emanating from the brain with SQUID biomagnetometers (SQUID is a Superconducting QUantum Interference Device.)(see Fig. 2).
Both EEG and MEG are non-invasive, have good temporal resolution, and directly yield information about neurologic functions. Compared with EEG, MEG is more robust to modeling inaccuracy, more comfortable, has a
smaller procedural cost (shorter preparation time), but is also more expensive.
EEG and MEG can be used in clinical applications such as seizure source localization in epilepsy, fatal medicine, psychiatry, or in neuroscience to
EEG and MEG
Fig. 1: 128 channel EEG system (courtesy of Electrical Geodesics).
Fig. 2: (a) 143 channel MEG system. (b) Illustration of the MEG sensor array. The contours correspond to the
magnitude of the field induced by the source. (courtesy of VSM MedTech Ltd.)
Biopotentials related with Vision
• EOG : E ye battery Measurement
Record Resting Potential of Retina while
allowing subject to see two points with fixed distance alternately
• ERG : electrical response of retina to optical stimulation
• Visually Evoked Potential (VEP) and
EEP (from retina prosthesis)
Electro-Oculogram
Surface electrode on the temple Surface electrode
on the nose
EOG Amplifier+filter
EOG
• Emil du Bois-Reymond (1848): First observation that the cornea of the eye is electrically positive relative to the back of the eye.
• Elwin Marg named the electrooculogram in 1951
• Geoffrey Arden (Arden et al. 1962) developed
EOG
• behaves as if it were a single dipole oriented from the retina to the cornea.
• well established and are in the range of 0.4 - 1.0 mV .
• Eye movements thus produce a moving (rotating) dipole source.
• Can be used for the measurement of eye movement.
EOG
Clinical EOG
Measuremant of the clinical
EOG
Measuremant of the clinical EOG
A ground electrode is attached usually to either the forehead or earlobe.
Either inside a Ganzfeld, or on a screen in front of the patient, small red fixation lights are place 30 degrees apart .
The distance the lights are separated is not
critical for routine testing.
Ganzfeld used
in Clinical EOG
The standard EOF method
The standard EOG method
BEST’s Disease
• Initially a recording of eye movements and eye position identifies abnormal electrical potential.
• At the second stage (usually between 10-25 years of age), typical yellow spots, sometimes accompanied by material leaking into a space by the retina, can be observed; an observation called "egg-yolk" lesion.
• When part of the lesion becomes absorbed this is identified as stage three.
• At the fourth stage, when the "egg-yolk" breaks up, in a process referred to as "scrambled-egg", sight will probably be affected.
• The fifth and final stage is when the condition causes the most severe
sight loss.
Fundus photo:
BEST’s Disease
Electroretinogram & Visual
Evoked Potential
ERG
The global or full-field electroretinogram (ERG) is a mass electrical response of the retina to photic stimulation.
The intense flash of light elicits a biphasic
waveform recordable at the cornea.
ERG Parameters and Major Components
a b
C d
The ERG of a cat in response to a 2 sec light stimulus.
Retina layer
ERG measures
Two principal measures of the ERG waveform are taken: 1) The amplitude of the a-wave from the baseline to the negative trough of the a-wave, and the amplitude of the b-wave measured from the trough of the a-wave to the following peak of the b-wave;
and 2) the time from flash onset to the
trough of the a-wave and the time from
The ERG Parameters
Measured in the Ophthalmic Clinic
ERG Responses from
Different Species
ERG recording electrodes
There are a number of corneal ERG electrodes that are in common use.
Some are speculum structures that hold the eye open and have a contact lens with a wire ring that "floats" on the cornea supported by a small spring .
Some versions use carbon, wire or gold foil to
record electrical activity.
Typical ERGs as Recorded with
Different Electrodes
Typical ERGs as Recorded with
Different Electrodes
ERGs from Normal Subject and RP Patient
Fundus Photo of Human Retina
ERG & EERG (Electrically Evoked ERG)
(a) (b) (c)
(d) (e)
1.2J Flash
480uA, 1 segment 480uA, 2 segment
480uA, 1 segment 1800uA, 1 segment
Lb: 48mS;
Vb:125 uV
Lb: 24mS;
Vb:25 uV
Lb: 24mS;
Vb:31.2 uV
Lb: 24mS;
Vb:156 uV Lb: 24mS;
Vb:68.7 uV 20mS/DIV
100uV/DIV High Cut: 30Hz Low Cut: 0.5Hz
Recording Condition
(a) (b) (c)
(d) (e)
1.2J Flash
480uA, 1 segment 480uA, 2 segment
480uA, 1 segment 1800uA, 1 segment
(a) (b) (c)
(d) (e)
1.2J Flash
480uA, 1 segment 480uA, 2 segment
480uA, 1 segment 1800uA, 1 segment
Lb: 48mS;
Vb:125 uV
Lb: 24mS;
Vb:25 uV
Lb: 24mS;
Vb:31.2 uV
Lb: 24mS;
Vb:156 uV Lb: 24mS;
Vb:68.7 uV 20mS/DIV
100uV/DIV High Cut: 30Hz Low Cut: 0.5Hz
Recording Condition
Visual Evoked Potential
The Retina and Visual System
VEP Recording
Electrode Location A normal flash VEP
A Pattern Reversal VEP
Electrically Evoked Potentials
EEP, 1 mA EEP, 2.5mA
Subretinal Electrical Stimulation
Biopotentials
related with Hearing
Auditory Pathway
(Electrically Evoked)
Compound Action Potential (ECAP)
Electrically evoked potentials of auditory neurons.
- Very short latency ( 0.2 to 0.5msec)
-Artifact removal is the most important techniques for successful ECAP measure
Cochlear stimulating electrodes are used as recording electrodes
Every Cochlear Implant Manufacturers offer functions for ECAP measure/analysis
(1) Cochlear Corp.
– “NRT(Neural Response Telemetry)”
(2) Advanced Bionics
- “NRI (Neural Response Imaging)”
(3) Med-El
- “ART(Auditory nerve Response Telemetry)”
Artifact Removal in ECAP measure
Alterating stimulus polarity (Brown et al.,1990)
- relatively simple approach (used by Advanced Bionics Corp.)
- underlying assumption : “the neural response is identical either anodic or cathodic leading pulses.”
( but not always true (Van den Honert and Stypulkowski, 1987, Miller et al., 1998)
Template subtraction (Miller et al., 1998)
- use subthreshold response as a template (very linear and acurate amplifier is needed) - can be used with wide range of stimulus duration.
Two-pulse subtraction (Brown et al., 1990, Abbas et al., 1999)
- the most commonly used (Ineraid Cochlear Corp., Advanced bionics) - uses forward masking paragigm (refractory characteristic of neurons) - need careful optimization of amplifier gain and another parameters
Auditory Evoked Potential (AEP)
ABR, AMLR, LLAEP, etc.
Tests are far field recordings of neurophysiological responses to auditory stimulation…in a bioelectric background!
Can be measured using acoustic sound or electrical stimulation (C.I.) Used to identify auditory dys-synchrony (auditory neuropathy), a dysfunction of neural pathways
AEP Measure
AEP can be measured non-invasively
- scalp electrode is used.
Setup for AEP measure
(1) Recording electrode – scalp electrode (2) Stimulator
- for acoustic stimulation : speaker
(click or tone-burst sound) - for electrical stimulation : C.I. or other stimulator (3) Acquisition hardware
- Amplification, filtering - data recording/analysis
+ -
GND
AEP
Auditory Brainstem Response (ABR)
Most well known AEP
- Primarily used to evaluate neurological disorders at level of auditory nerve and brainstem
ABR (first described by Jewett and Williston, 1971) - Short latency (~10msec) evoked potential
- ABR measure can access lower part of the auditory system - Amplitude ranges a few uV
ABR consists of 7 peaks
Wave I - compound action potential of cochlear nerve Wave II – proximal region of cochlear nerve
Wave III – cochlear nucleus
Wave IV – superior olivery complex Wave V – lateral lemniscus
Wave VI and VII – inferior colliculus
(Presence of Wave V found to be reliable estimate of hearing ability in 2K-4K Hz range)
ABR vs. EABR
EABR (Electrically evoked ABR)
: ABR evoked by electrical stimulation (such as C.I.)
EABR has similar characteristic to ABR - same auditory processes are used.
Some importane differences (1) WaveeI is usually obscured.
- due to stimulation artifact (2) Shorter latency
- EABR arise 1.0~1.5msec earlier than ABR - Electrical stimulus bypasses the transmission process of sound.
Typical response wave forms for