Gold nanoporous thin films on various substrates were prepared by the co-sputtering method and used for electrochemical applications. Optimization of the composition and porosity of the gold nanoporous palladium was done by adjusting each power of the sputtering targets. Our nanoporous gold palladium exhibited high current density and great stability towards ethanol oxidation reaction in alkaline media.
INTRODUCTION
Nanoporous gold
- Introduction
- Fabrication method: Dealloying
- Parting limit and percolation
- Dealloying by free corrosion
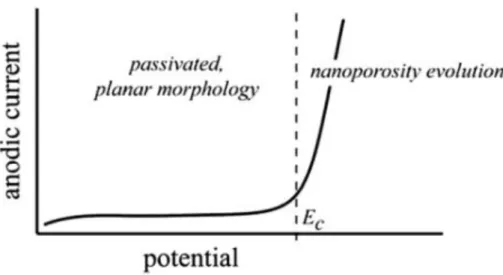
- Dealloying using electrochemical cell and critical potential
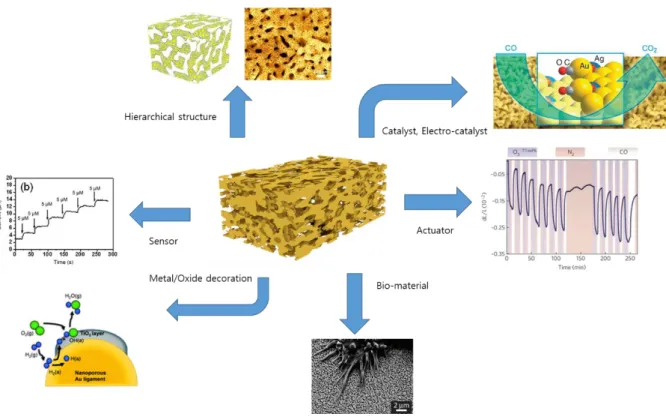
- Applications of nanoporous gold
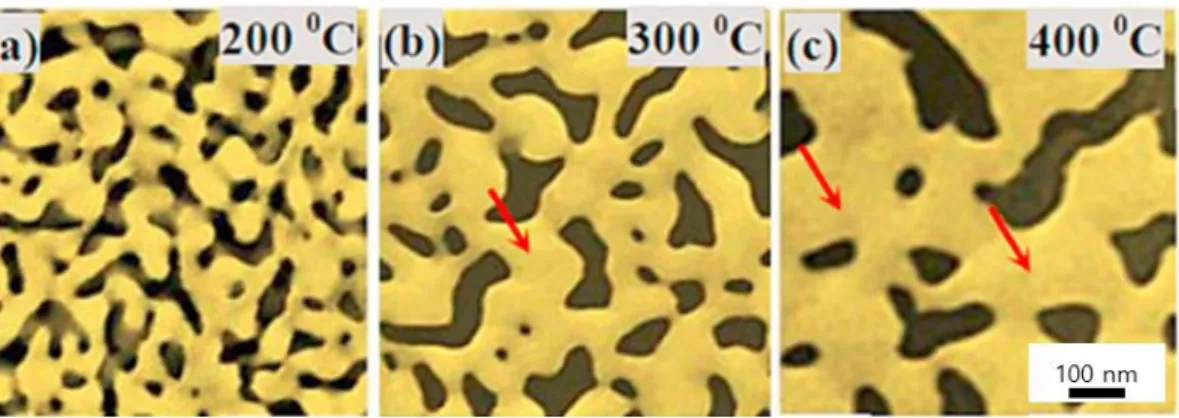
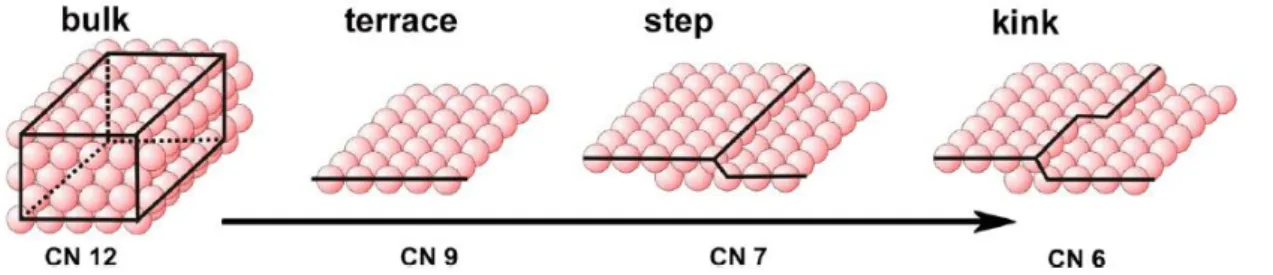
The number of neighboring atoms called coordination number (CN) is reduced in surface atoms (figure 1.2) and the low-coordinated atoms are chemically unstable than normal atoms so they play a very important role in chemical reactions. The annealing causes the diffusion of gold atoms and low-coordinated atoms located in step or kink sites to move and coalesce so that the size of ligaments increases. In contrast, in figure 1.6 (b), the silver atoms are much less than figure 1.6 (a) and are not connected to each other.
Basic of electrochemistry
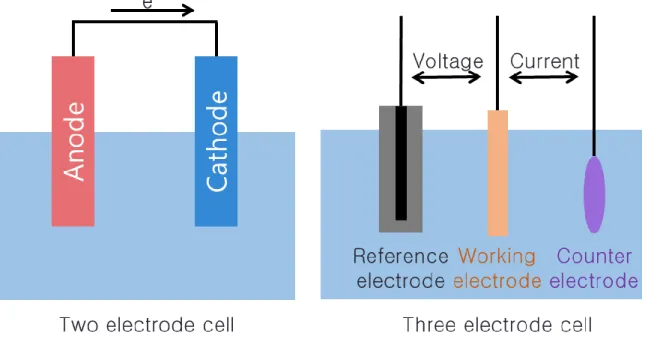
- Electrochemical systems
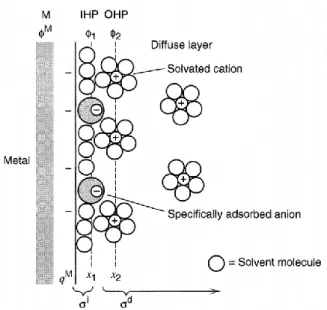
- Nature of electrode/electrolyte interface
- Current in electrochemistry
- Nernst equation
- Electrochemical oxidation/reduction depending on energy of electrons
- Electrode kinetics
- Electrochemical methods
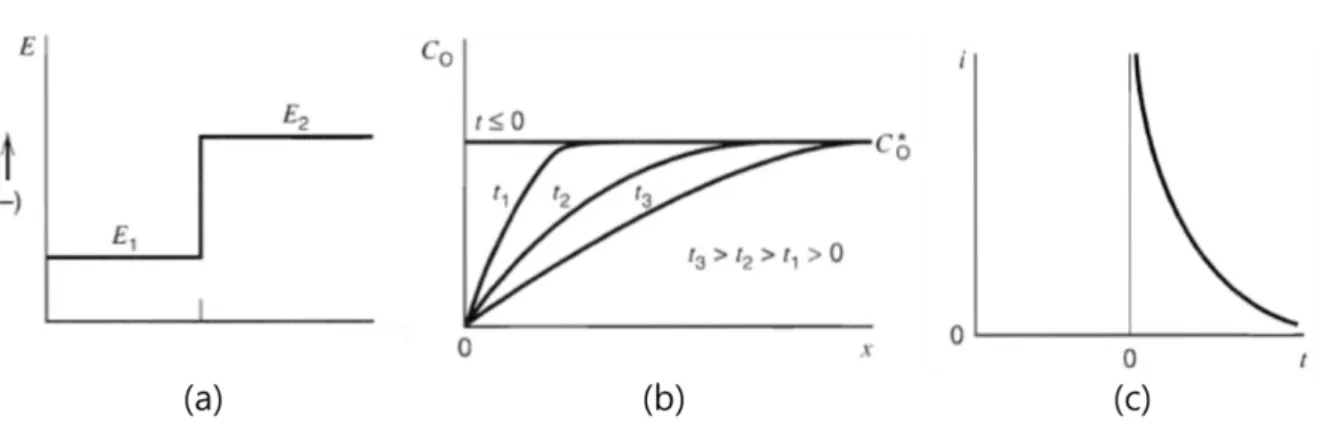
When the negative potential is applied to the electrode, the energy of electrons is increased (figure 1.12 (b)). Similarly, when the positive potential is applied to the electrode, the energy of electron is lowered. The mass transfer concerns with a phenomenon active molecules come from the bulk electrolyte to the electrode.
In nanoporous gold: from an ancient technology to a high-tech material, The Royal Society of Chemistry: 2012; pp. 11-29.
EQUIPMENT AND EXPERIMENTAL
Sputtering
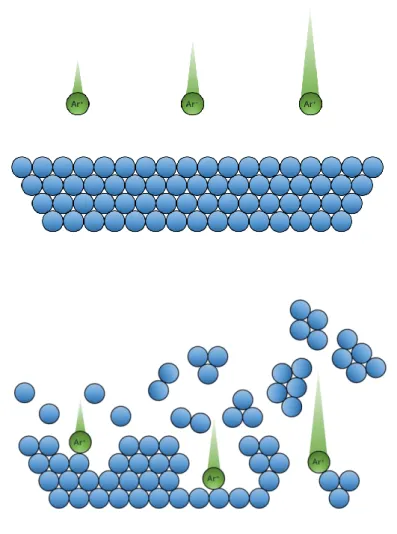
- Introduction
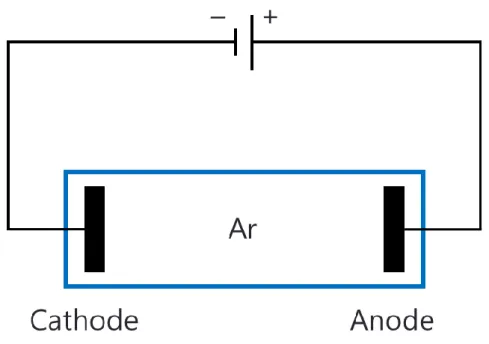
- Glow discharge and plasma
- The cathode region
- Magnetron sputtering
- Reactive sputtering
- Radio frequency (RF) sputtering
- Sputtering equipment
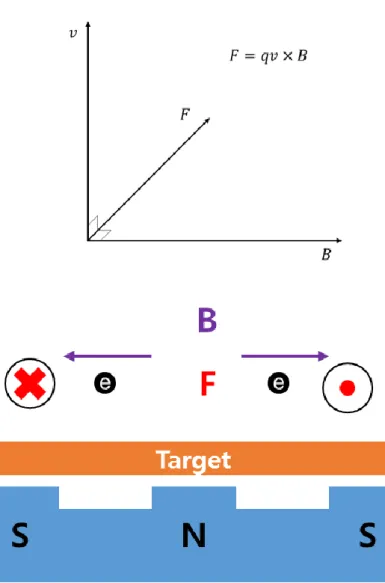
A magnetic field is applied at right angles to the electric field by placing large magnets behind the target (figure 2.5). It traps electrons near the target surface and causes them to move in a spiral motion until they collide with an argon atom (figure 2.6). Only the electrons will be affected; the ions are too massive.5 The orbital motion of electrons increases the probability that they will collide with natural species and create ions.
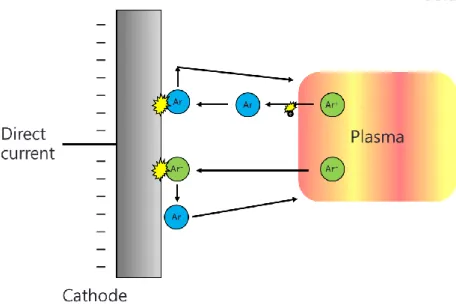
If the material is a single pure chemical element, the atoms are simply ejected from the target and deposited in that form. The ionized reactive gas can react chemically with the target material and produce a compound that then becomes the deposited film (figure 2.7). If the target is insulating, the plasma is not prevented by direct current glow charging process because the cation will accumulate on the target surface (figure 2.8).
When the direct current is applied to the insulating target - argon ions accumulate on the target surface. RF sputtering technique uses alternating current supply which causes cations to continuously collide with the target. Therefore, the RF current system makes the target as negative for an increased influx of cations (Figure 2.11).
Under the target there are magnets to increase the yield of sputtering, but figures of magnets are omitted.
Analytical equipment
- X-ray diffraction (XRD)
- X-ray photoelectron spectroscopy (XPS)
- Auger electron spectroscopy (AES)
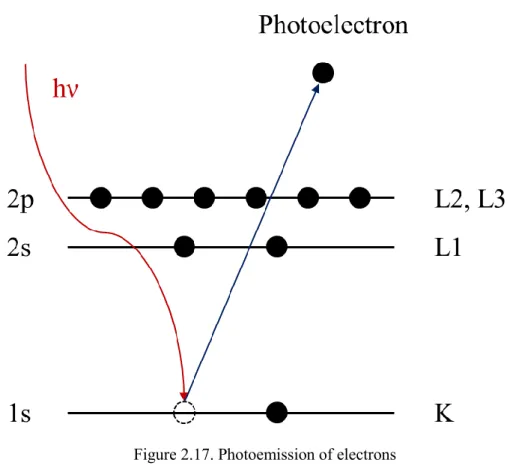
It is based on the photoelectric effect which is the release of an electron or other carriers when the light is emitted to the material (figure 2.17). When the electron is ejected from the surface by x-ray irradiation, the kinetic energy of electron is expressed as equation (2.1). Where, KE is kinetic energy of emitted electron, hν is energy of x-ray, BE is the binding energy of electron, and ф is the work function. A photoelectron spectrum is obtained by counting photoelectrons over a range of kinetic energies.
The energies and intensities of the photoelectron peaks can be used to quantify and identify surface elements. By measuring the kinetic energy, the binding energy of the electron could be calculated and information about the chemical state obtained. AES is the most commonly used technique for analyzing the chemical composition of a surface by recording Auger electron energies 22 , 23 .
Since the atom is unstable, the vacancy can be filled by an electron from the L shell falling down without x-ray radiation. The excess energy can be removed by removing the outer shell electron if the energy is greater than the binding energy (figure 2.18). As it can be seen that the kinetic energy of the Auger electron is independent of the primary electron bunch, therefore the kinetic energies of the Auger electron are characteristic of the elements.
The yield of Auger emission is higher for light elements while x-ray yield is higher for higher atomic numbers.
A.; Sytchkova, A.; Dimaio, D.; Cappello, A.; Rizzo, A., Deposition of silicon nitride thin films by RF magnetron sputtering: a material and growth process study. Ljungcrantz, H.; Helmersson, U., Growth of Ti-C nanocomposite films by reactive high-power pulsed magnetron sputtering under industrial conditions. Qamar, A.; Mahmood, A.; Sarwar, T.; Ahmed, N., Synthesis and characterization of SiC porous crystalline thin films prepared by radio frequency reactive magnetron sputtering technique.
NANOPOROUS GOLD FOR SENSOR
- Introduction
- Experimental
- Results and discussions
- Conclusion
- References
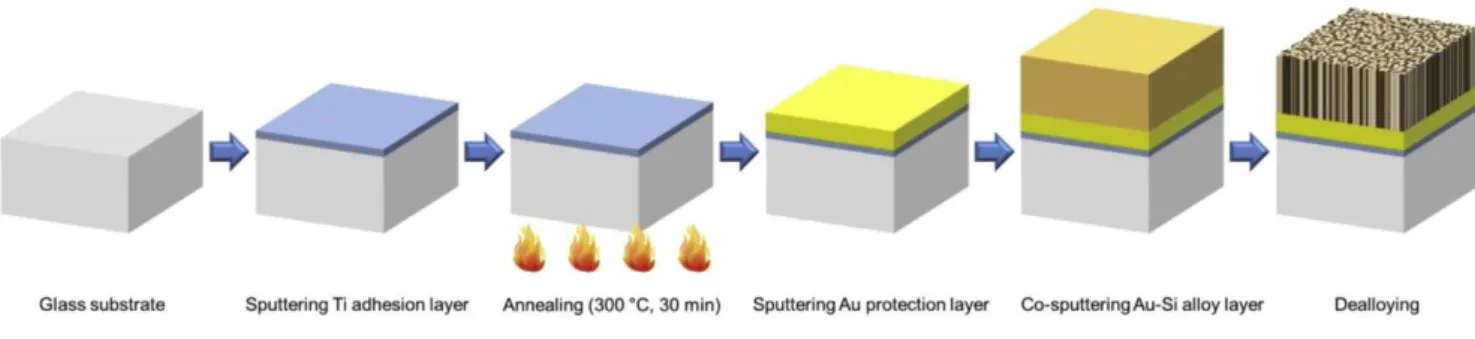
After deposition of the Ti layer, we annealed the samples for 30 min at 300 °C with a heating rate of 10 °C/min. Sample A was prepared with the same annealing conditions as for Figure 3.2 (a), that is, only the Ti layer was annealed, followed by deposition of the Au and the Au–Si layers. The other sample (sample B) was annealed after the deposition of the Ti and the Au layers, and then the Au–Si layer was grown.
We believe that this is one of the reasons for the poor performance of these sensors. In addition, the thickness of the alloy layer was unchanged (∼300 nm) after delegation, indicating that there was no loss of Au. The CV experiment is performed in 0.5 M H2SO4 solution at a scan rate of 100 mV s−1 from −0.25 to 1.8 V, and the roughness factor (actual area/geometric area) of the NPG films was calculated from the reduced CV area.
As a result, the thickness of the NPG layer is reduced by 33% compared to the Au-Si layer by the partial dissolution of Au, because the diffusion of Au is not fast enough to reach the dissolution rate of Si atoms. We also performed the amperometric sensor experiments in tap water to test the performance of the NPG sensor under more general conditions. With the optimized annealing treatment that reduces the residual stress in the films, we can solve the delamination of NPG films from glass substrates.
The roughness factor of the NPG surface etched with KOH was much larger than that of NPG structures fabricated by fast HF dealloying.
NANOPOROUS GOLD FOR SUPERCAPACITOR
- Introduction
- Experimental
- Results and discussions
- Conclusion
- Calculation
- References
Here, we have fabricated PANI/NPG polymer-metal hybrid structures designed for a highly stable supercapacitor with high capacitance. After electrodeposition of PANI, the PANI/NPG samples were cleaned with deionized water and dried in an oven at 110 oC for 1 day. PANI/NPG films were used as the working electrode in a conventional three-electrode system (Versastat 3, Princeton Applied Research).
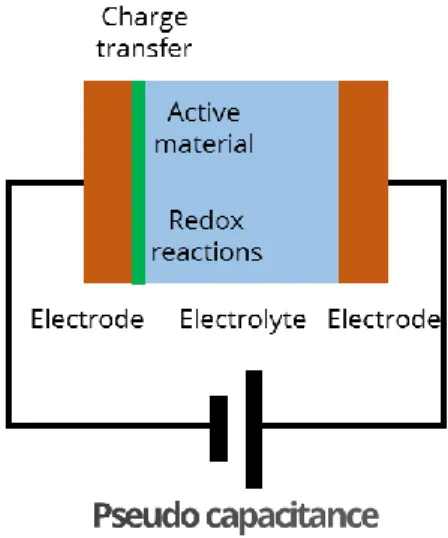
We fabricated PANI/NPG films in both sulfuric acid and perchloric acid and compared their stability. With longer deposition time up to 120 min, the PANI/NPG structures became very weak and peeled off from the substrate. Our PANI/NPG sample showed pseudo-capacitor characteristics even at a high scan rate of 100 mV/s.
Our PANI/NPG supercapacitors had a peak energy density of 9.11 mWh/cm3 at a power density of 1.56 W/cm3. This extraordinary high capacitance PANI/NPG supercapacitor is based on the combination of rational thickness PANI and highly conductive NPG with three-dimensional open pore structures, which is effective for fast ion diffusion. Regarding the stability of our supercapacitors, Figure 4.11 shows the cycle life plot of PANI/NPG at a current density of 1.2 mA for 500 cycles.
The much longer cycle life of PANI/NPG prepared in perchloric acid was mainly due to the formation of the compact PANI layer on the NPG structure that was made possible by the optimized mild chrono-potentiometry.
NANOPOROUS GOLD PALLADIUM FOR FUEL CELL 72
- Experimental
- Results and discussions
- Conclusion
- References
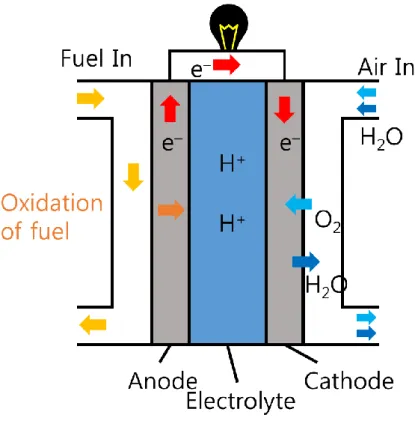
Herein, NP-AuPd thin films were used for the electrochemical ethanol oxidation reaction (EOR) in alkaline media of a direct ethanol fuel cell (DEFC). The fine structure of our NP-Aupd was further investigated using transmission electron microscopy (TEM). The Au:Pd:Mg composition ratio in the ternary alloy and the Au:Pd ratio in NP-AuPd are around 20:25:55 and 40:60, respectively.
Microstructures and elements distribution of NP-AuPd (a) top view SEM image, (b) cross-sectional TEM image and (c) corresponding TEM EDS map. Accordingly, we evaluated how the Au and Pd composition of NP-AuPd affects catalytic activity. We compared the catalytic activities of the A and P samples with the NP-AuPd sample described previously (D sample, Au:Pd ratio = 40:60); The CVs for the three samples are shown in Figure 5.6 (c).
We also checked the porosity of our NP-AuPd by controlling the amount of Mg used. Electrochemical results of NP-AuPd. a) Cyclic voltammogram of NP-AuPd, NP-Au and NP-Pd electrodes. The remarkable electrocatalytic activity of NP-AuPd toward ethanol oxidation in alkaline media is based on two factors.
We optimized the Au/Pd composition and porosity; the optimal NP-AuPd sample showed outstanding electrocatalytic activity towards the electrooxidation of ethanol in an alkaline medium.
SUPPLEMENTARY IMFORMATION
- Nanoporous gold from Au-Ag, Au-Si, and Au-Mg
- Cyclic voltammetry for nanoporous structures
- Tuning the facet of nanoporous gold
- References
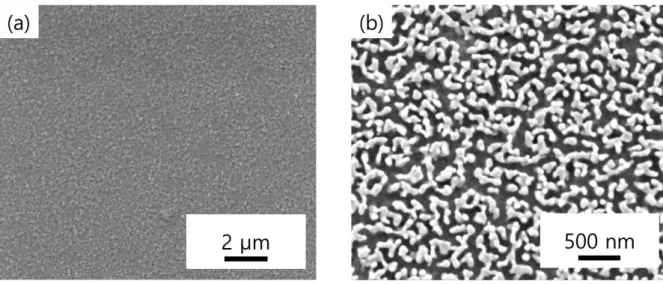
The Au-Si alloy and NPG from Au-Si are shown in Figure 6.2 (a) and (b), respectively. The Au-Ag system is a solid solution, the Au-Si system is a simple eutectic, while the Au-Mg system has a number of solid phases. In the case of Au-Ag and Au-Si, the sacrificial elements are atomically dissolved from the alloy, however, grains in the Au-Mg system will be dissolved, so that NPG from Au-Mg has angled ligaments.
In the case of Au-Mg system, although there are more intermetallic compounds in the Au-Mg phase diagram, magnesium was always easily dissolved in dilute acetic acid (Part 4, Part 5). We took SEM images of these samples (Figure 6.8), but we could not find any significant difference in features. The CV results in alkaline media (Figure 6.9 (b)) show that the slow CV sample has the highest current density, while the annealed sample has the lowest current density.
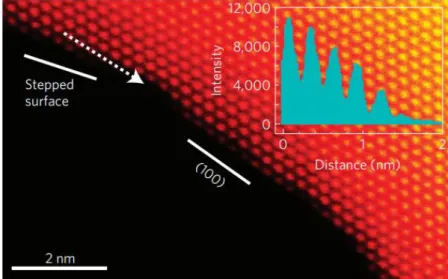
In the case of NPG from Au-Mg (figure 6.10), high peak at (100) facet and little peak at KS sites are observed in as-dealloyed sample. It is noteworthy that NPG of Au-Mg has a number of (100) facets without any treatment while NPG of Au-Ag has (100) facet after slow CV. Electrochemical properties of NPG of Au-Ag. a) UPD profiles, (b) CV, and (c) CA results of electrooxidation of ethanol.
Electrochemical properties of Au-Mg NPG. a) UPD profiles, (b) CV, and (c) CA results of ethanol electrooxidation.
CONCLUSION AND SUGGESTIONS
We suggest that the combination of the nanoporous gold with other functional nanoparticles (eg TiO2, CoOx, etc.) will be an interesting topic to improve the potential of nanoporous gold. Since gold is a very expensive material, it can be a good topic to find an alternative material (copper, silver, etc.). Furthermore, the various combinations of binary alloy with nanoporous structures can be easily produced and this will be a fascinating topic.