Macroscopic observations of the inner surface of the test section after the quenching experiments: (a) water, (b) SiC/water nanofluid, and (c) GO/water nanofluid. SEM observations of the inner surface of the test section after the quenching experiments: (a) water, (b) SiC/water nanofluid, and (c) GO/water nanofluid.
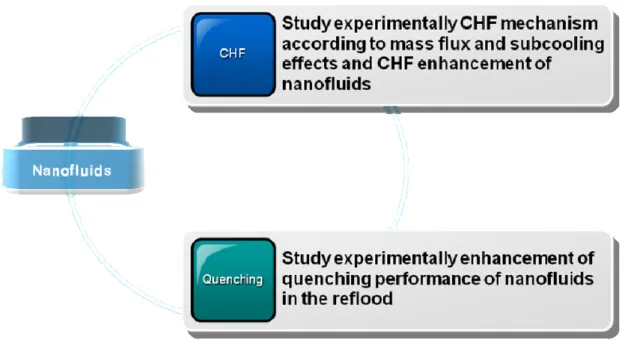
Research Objectives and Scopes
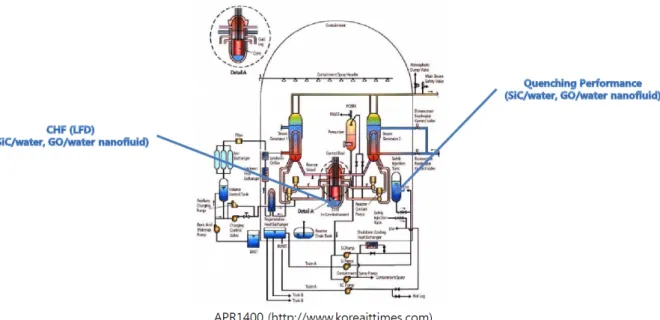
CHF experiment using nanofluids Al2O3/water, SiC/water, and GO/water are included in the CHF experiment using nanofluids. Quenching experiment using nanofluids SiC/water and GO/water are included in the quenching experiment using nanofluids.
Thesis Structure
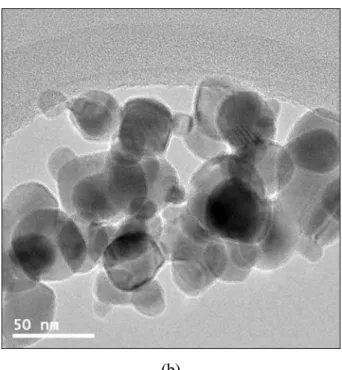
Shape and Size of Nanoparticles
Fabrication of Nanofluids
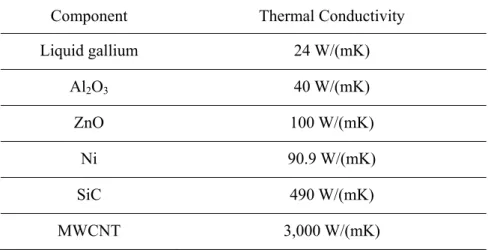
These values are calculated using the following conversion formula and this conversion formula is used conventionally as it is very difficult to measure the exact amount of nanoparticles.
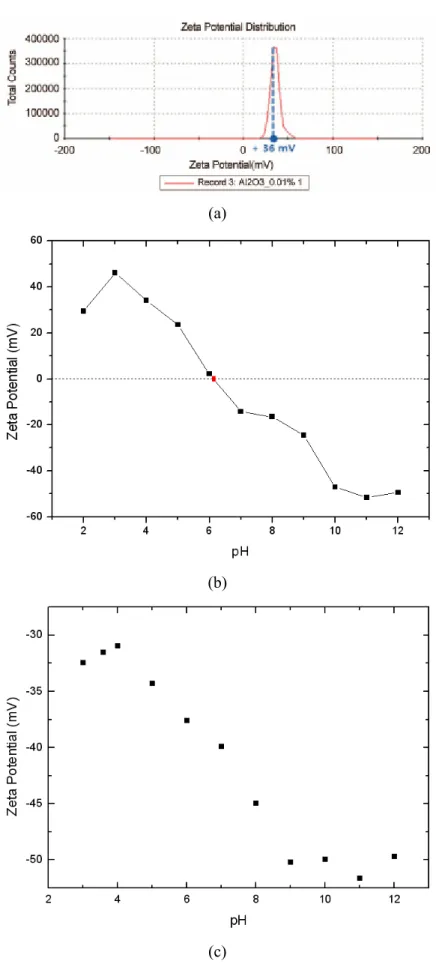
Dispersion Stability
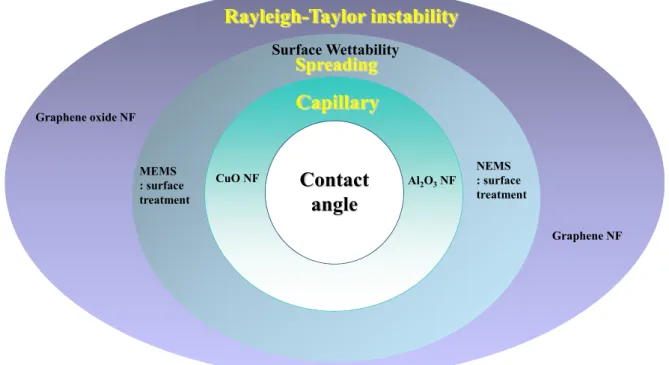
Application of Nanofluids
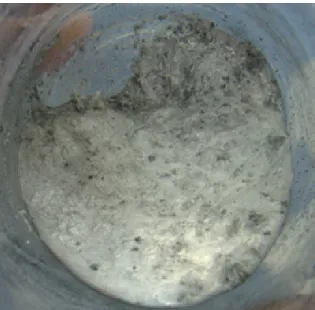
Macroscopic observation: (a) pure liquid gallium, (b) Al2O3/liquid gallium mixture, (c) ZnO/liquid gallium mixture and (d) Ni/liquid gallium mixture. Macroscopic observation of nanoparticles/liquid gallium mixture (at 450°C, for 24 h): (a) Al2O3/liquid gallium mixture, (b) ZnO/liquid gallium mixture and (c) Ni/liquid gallium mixture.
Dispersion of Nanoparticles in Liquids
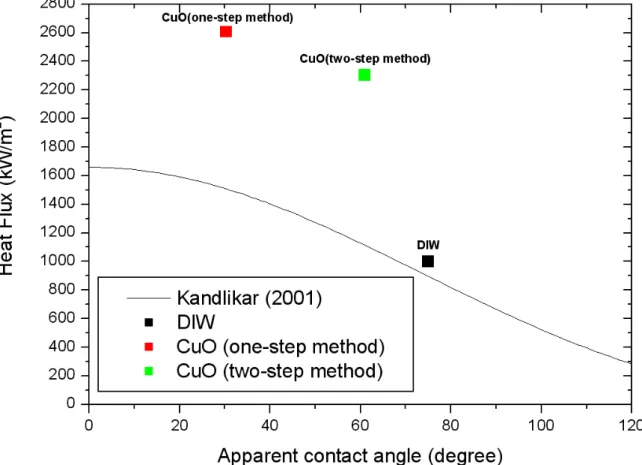
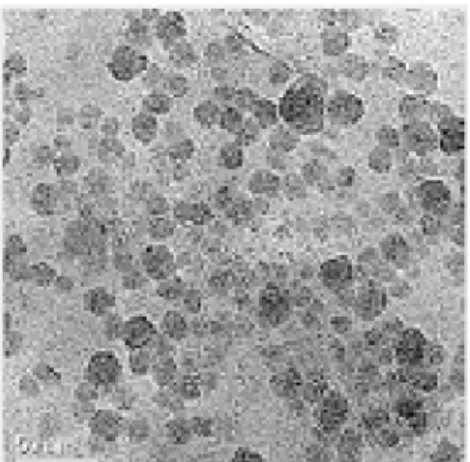
As shown in Table 2-7, the dispersion stability of CuO/DIW nanofluid prepared by the one-step method of PLAL is much better than that prepared by the two-step method. TEM images of CuO nanoparticles according to preparation methods: (a) one-step method and (b) two-step method. The CHF value of CuO/DIW nanofluid prepared by the one-step method in PLAL is ~300 kW/m2 larger than that prepared by the two-step method.
The contact angle of CuO/DIW nanofluid made by the one-step method of the PLAL was smaller than that of CuO/DIW nanofluid made by two-step method.
Introduction
Macroscopic observations on the inner surface of the test section after CHF experiments: (a) water, (b) Al2O3/water nanofluid, (c) SiC/water nanofluid, and (d) GO/water nanofluid. SEM observations on the inner surface of the test section after CHF experiments: (a) water, (b) Al2O3/water nanofluid, (c) SiC nanofluid/water, and (d) GO nanofluid/water. Temperature changes of the test section wall during reflooding of water and sea salt solution (injection flow rate: 3 cm/s).
Macroscopic observations of the inner surface of the test section after tempering experiments: (a) water and (b) sea salt solution. SEM observations of the inner surface of the test section after quenching experiments: (a) water and (b) sea salt solution. SEM-EDS results of the inner surface of the test section after sea salt solution quenching experiments.
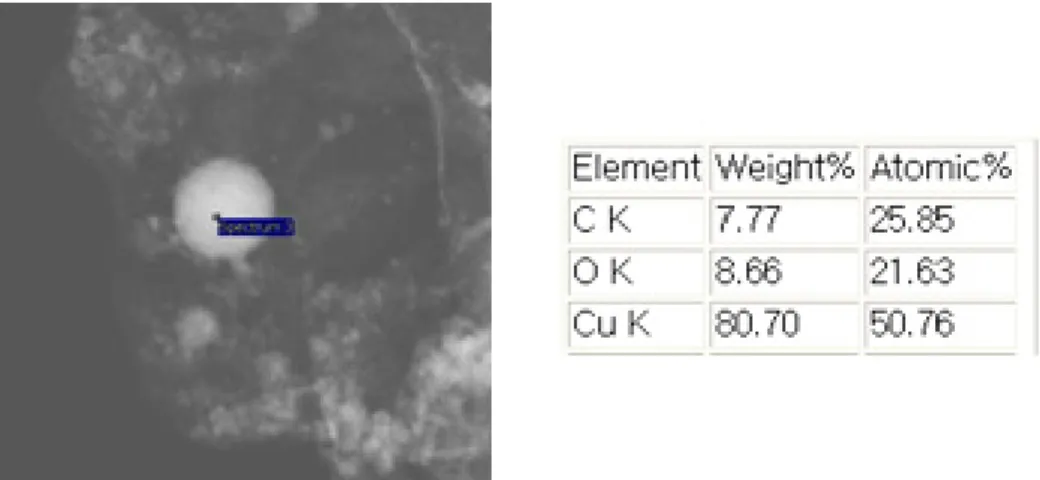
SEM-EDS results of the inner surface of the test section after the SiC/water nanofluid quenching experiments. SEM-EDS results of the inner surface of the test section after the GO/water nanofluid quenching experiments.
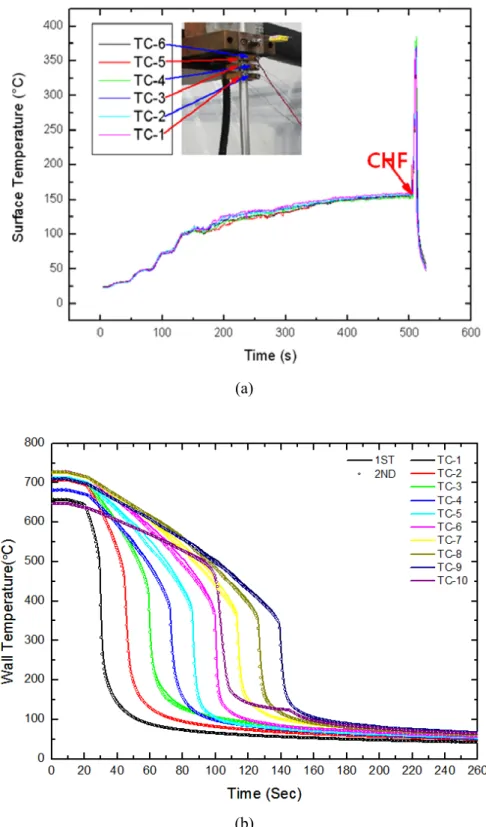
CHF Experiment
Results and Discussion
Hewitt and Roberts Flow Regimes Map (1969)
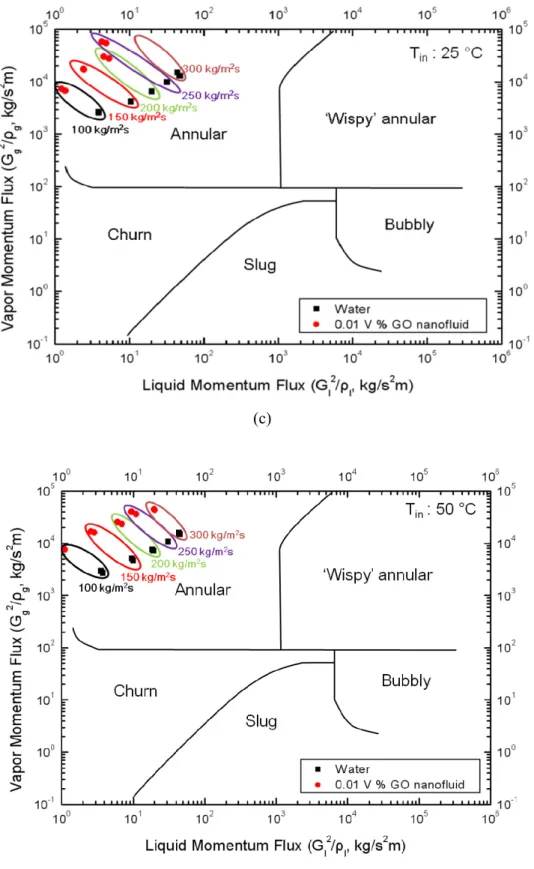
As the quality is gradually increased from zero, the common flow regimes for vertical vertical flow, where both phases flow upward in a circular tube, are bubble flow, plug flow, bifurcation flow, and annular flow. Annular flow is such that the liquid moves as an annular film on the inner surface of the tube and the small droplets dispersed in the gas move to the center of the tube. The mechanism occurring in CHF is liquid film drying (LFD) in the annular flow regime23.
For the case of annular flow in a round tube, as shown in Figure 3-4, the liquid film at the wall, the vapor core, and the vapor entrained droplets are each considered a “fluid”41.
CHF Condition
CHF Results of Nanofluids
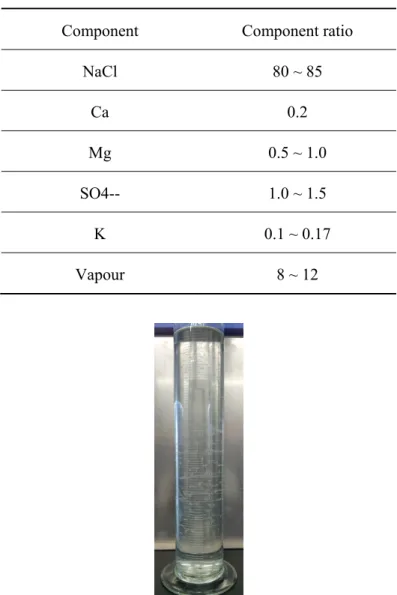
Contact angles of the inner surface of the test section after CHF experiments: (a) water, (b) Al2O3/water nanofluid, (c) SiC/water nanofluid, and (d) GO/water nanofluid. The surface morphology on the inner surface of the test section after the CHF experiments is almost the same. The procedure for preparing the sea salt solution is as follows: (1) weigh the mass of sea salt with a digital electronic scale; (2) add sea salt to weighed deionized water and prepare a sea salt solution (Figure 4-12).
Wall temperature variations in the test section for repeated runs during refilling of sea salt solution (injection flow rate: 3 cm/s). We have observed a more improved cooling performance in the case of sea salt flooding. The macroscopic observations show the deposition of SiC and GO nanoparticles on the inner surface of the test section.
SEM observations show in more detail the inner surface of the test section after the water, SiC/water nanofluid, and GO/water nanofluid quenching experiments. The contact angles in the inner surface of the test section after the quenching experiment with water, SiC/water nanofluid and GO/water nanofluid are 43.1°.
Cause of CHF Enhancement
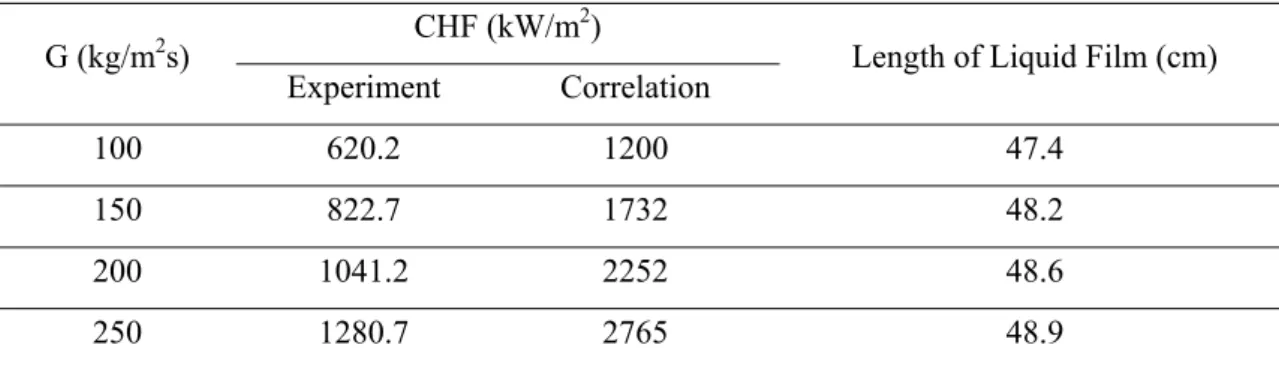
Experimental Correlation
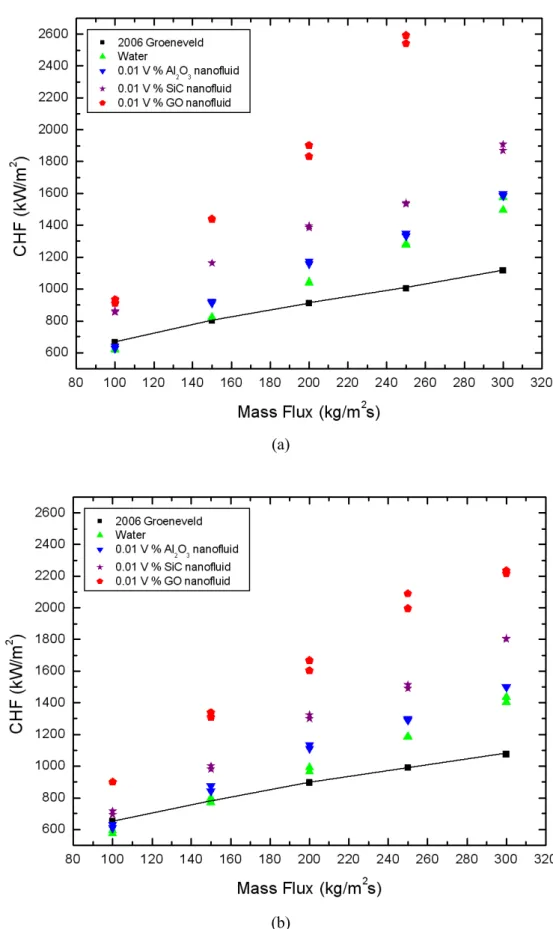
CHF increases with increasing mass flow and enthalpy inlet subcooling and with decreasing ρg/ρf, Lh/D and σρf/G2D. To make the experimental correlation in the case of using Al2O3/water, SiC/water and GO/water nanofluids, thermal activity and wettability were used in the experimental correlation. CHF data and experimental correlation (version 1) with different mass flux according to inlet temperature: (a) Tin : 25 °C and (b) Tin : 50 °C.
CHF data and experimental correlation (version 2) with different mass flux according to inlet temperature: (a) Tin : 25 °C and (b) Tin : 50 °C.
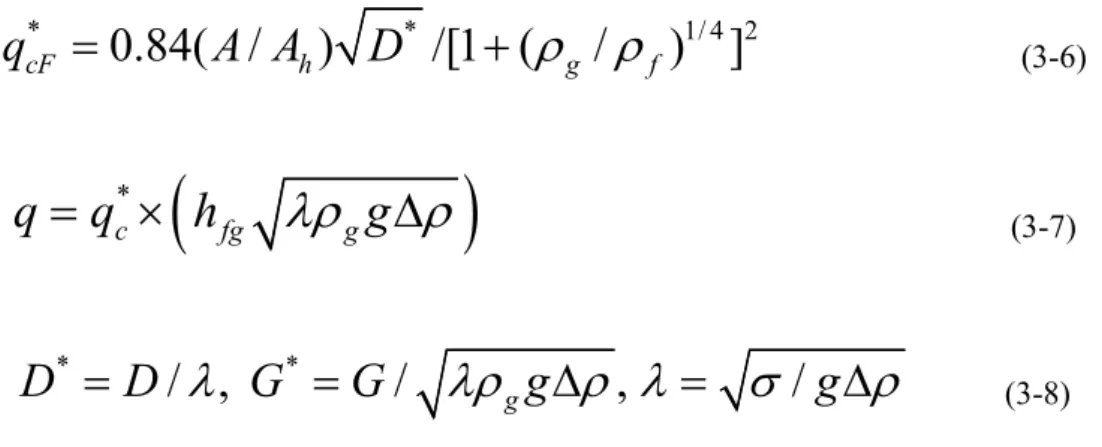
Theoretical Correlation
Annealing time of Al2O3/water nanofluid: (a) Annealing time at TC-1 and (b) Annealing time at TC-8. Changes in the temperature of the wall of the test section for repeated runs during water re-flooding (injection speed: 3 cm/s). SEM observations show in more detail the inner surface of the test section after quenching experiments with water and sea salt solution.
As shown in Figure 4-20, the contact angles of the water and the sea salt solution are almost the same. The surface tension of water and sea salt solution is confirmed through the measurement of the contact angle. And Figure 4-38 shows the SEM-EDS results of the inner surface of the test section after the quenching experiments with GO/water nanofluid.
Conclusions
Introduction
The contact angles in the inner surface of the test section after the quenching experiment with water and the sea salt solution are the upper part of the test section and 56.6° (the middle part of the test section). The enhancing cause of the cooling performance after the quenching experiments using the sea salt solution was investigated by macroscopic observation, SEM, contact angles and SEM-EDS of the inner surface of the test section. Coating thickness of the inner surface of the test section after rewatering experiments: (a) SiC/water nanofluid (51.00 μm) and (b) GO/water nanofluid (6.50 μm).
The improvement on wettability of the inner surface of the test section will make the liquid film more established.
Quenching Experiment
Preliminary Experiment: Part 1
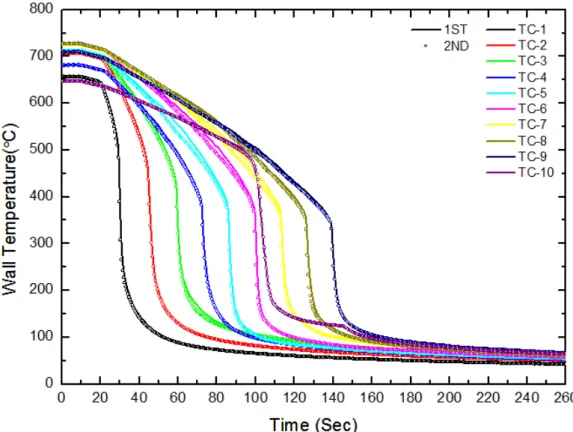
The variations in the wall temperatures as a function of time for water and Al2O3/water nanofluid during the reflow are shown in Figure 4-6. In the comparison between the water and the Al2O3/water nanofluid, a difference in the quench time (that is, the time required to cool the hot tube surface from the coolant injection to the termination of a quench, Twall = 100 °C ) is observed. At the location of TC-8 in the upper part of the heated section, the difference in the quenching time between the water and the Al2O3/water nanofluid shows more than 13 s.
The difference in quenching time between water and CNC shows more than 20 s at the TC-8 location in the upper part of the heated section.
Preliminary Experiment: Part 2
The reason for the cooling efficiency and increase in CHF for the sea salt solution is not the increased wettability of the liquid film on the heater surface due to the deposition of sea salts. While considering the cause of the improvement in the cooling capacity of the sea salt solution, we focused on its characteristics. In addition, the increased CHF is due to the improved wettability of the sea salt solution, as shown in Figure 4-22 and Table 4-6.
However, it is likely that the cause of the improved cooling performance for the sea salt solution is not the increased wetting of the liquid film on the surface of the heater due to the deposition of sea salts.
Quenching Experiment using SiC and GO Nanofluids
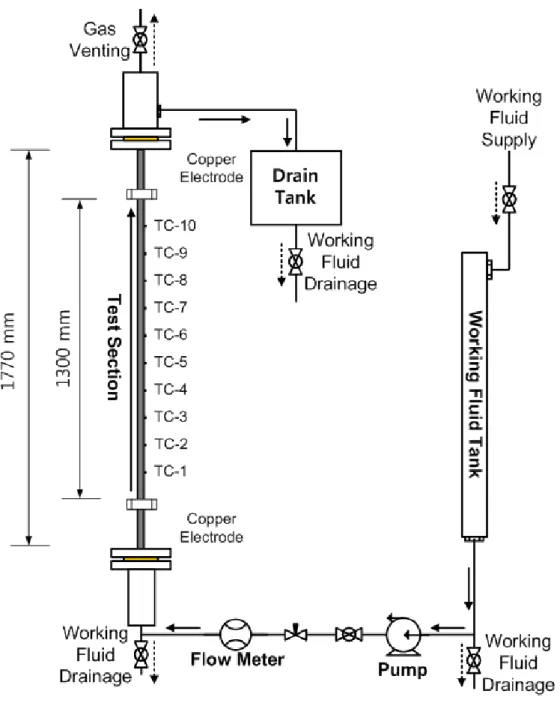
The situation of interest was the quenching phenomena of fuel rods during a reflood with a sea salt solution. This is confirmed by contact angles in nichrome wire (same roughness factor) of water and sea salt solution. The injection flow rate (3 cm/s) was controlled by pump and the needle valve upstream of the test section.
Two runs of the experiment were performed for each condition (water, SiC/water, and GO/water nanofluids).
Results and Discussion
- Wall Temperature during Reflood according to Working Fluids
- Leidenfrost Temperature
- Saturated Boiling Curve
- Cause of Cooling Performance Enhancement
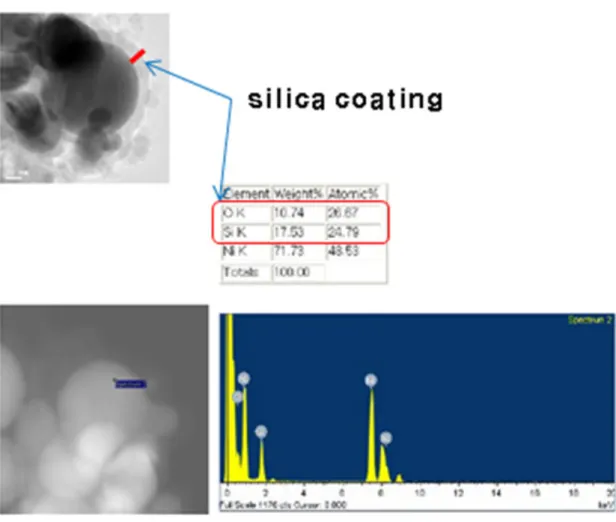
The local wall temperature at the quench front is important for theoretical modeling of the rewetting problem. The calculation of the heat transfer coefficient using the Lumped method can be performed because the Biot number of the test subject in the rewetting test is 0.073 in the film boiling stage. Thus, thin-film nanoparticles are formed, as shown in Figure 4-34. The reasons for the improvement in cooling efficiency after quenching experiments using nanofluids were investigated by macroscopic observation, SEM, contact angles and SEM-EDS of the inner surface of the test piece in the same way as for nanofluids.
To confirm the improved wettability of the liquid film on the heater surface, the contact angle is examined as shown in Figure 4-39.
Conclusions
Conclusions and Recommendations
Conclusions
- Flow Boiling CHF Enhancement of SiC and GO Nanofluids
- Quenching Performance Enhancement of SiC and GO Nanofluids
The cause is also due to the difference in time at which the coating of nanoparticles takes place. Thus, the thickness of the coating layer in the flow boiling experiments is thicker than that in the quenching experiments due to the difference between the cooking mechanism that occurs in coating nanoparticles and the time that occurs in coating nanoparticles. And the CHF results for nanofluids were improved by the increase in mass flux at inlet temperatures of 25 °C and 50 °C.
The CHF increase of nanofluids was due to improved wetting of the liquid film on the heater surface caused by the deposition of nanoparticles.
Recommendations
Seong Dae Park, Seung Won Lee, Seong Man Kim, Sarah Kang, Han Seo, In Cheol Bang. Seong Man Kim, Seung Won Lee, Seong Dae Park, Sarah Kang, Han Seo, In Cheol Bang. Seong Dae Park, Sarah Kang, Seung Won Lee, Seong Man Kim, Han Seo, In Cheol Bang.
Sung Dae Park, Seong Man Kim, Sarah Kang, Seung Won Lee, Han Seo, In Cheol Bang,.