Engineered optical metamaterials are gaining attention for ultrasensitive analysis of biomolecules and gas materials due to the coupling effect between metamaterials and molecules at the nanometer scale. The specific asymmetric structure supports a sharp and non-radiative Fano resonance that exhibits strong electromagnetic field amplification and a larger effective detection area. Experimentally, a sample with two cases, i.e., the nano-pedestal structure and the control structure, was prepared for controlling the undercut effect in the molecular detection.
For the experimental measurement, a monolayer of ODT is coated on the fabricated sample and the reflectance spectrum of the ODT-coated sample is measured with an FT-IR spectrometer. The signal enhancement was confirmed due to the increase in detection area and increased field enhancement on the nanostand structure. The resulting spectrum of the ODT signal was modeled using TCMT to quantify the amount of signal enhancement.
Background
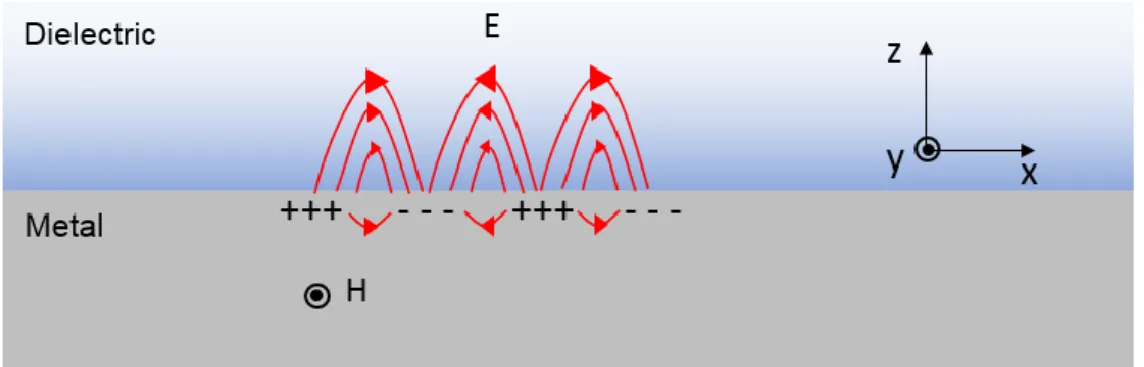
Plasmonic metamaterial
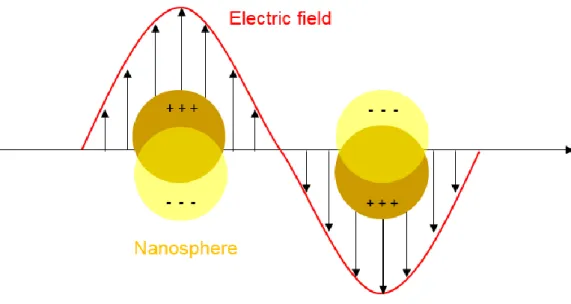
Since nanoparticle-induced electric fields can be approximated as a dipole, the polarizability is expressed by the Clausius–Mossotti relation as follows. Plasmonics can be applied to subwavelength optical devices9-12, metamaterials and metasurfaces13-17, high-resolution imaging13,16-20 and biochemical sensing21-24.
SEIRA
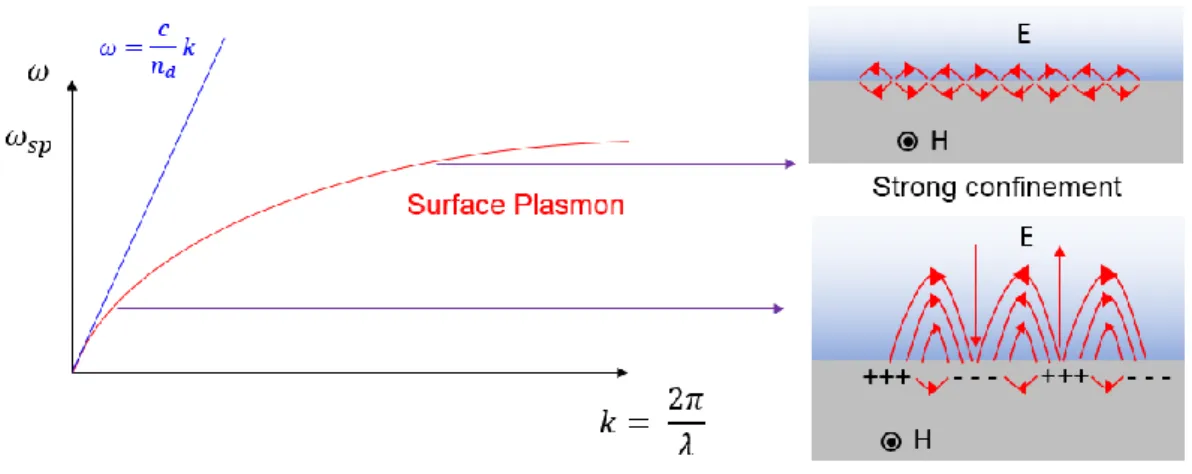
However, because the large near field is mainly present in the metallic structure, the molecular vibration cannot be maximized33. So, with the pedestal structure, additional access can be used for the sensing method which is the bottom surface.
Fano Resonance
Structure Design & Simulation
FDTD Simulation
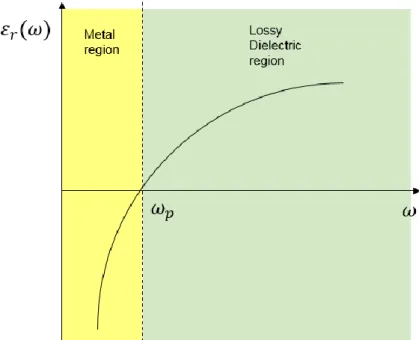
The reason for fundamental difference between semiconductors, insulators and conductors is due to differences in energy band structure. When an electron escapes from the nucleus or leaves the outermost shell, the electrons become free electrons and generate an electric current. And when many atoms are bonded to form a solid, the orbits of the electrons overlap, the orbit is called a band.
The conduction band of a conductor, like most metals, overlaps the valence band and has a very low band gap energy. Due to the low energy of the band gap, electrons can be excited across the band gap even at room temperature. Therefore, there are many electrons in the conduction band, and electrical conduction occurs easily from these electrons.
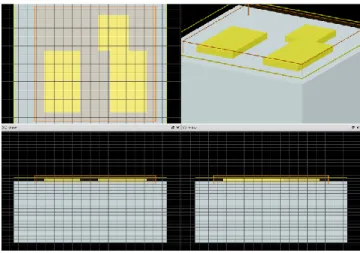
Parameter Model, Simulation Setting
Fabrication Processing
Fabrication Step
Meanwhile, the SiO2 substrate was further deposited with an electron beam evaporator to 100 nm SiO2. This was to make the nanopedestal structure through the undercutting process at the last process. Then, a syringe was applied to the wafer of LOR 1A uniformly so that no bubbles were formed.
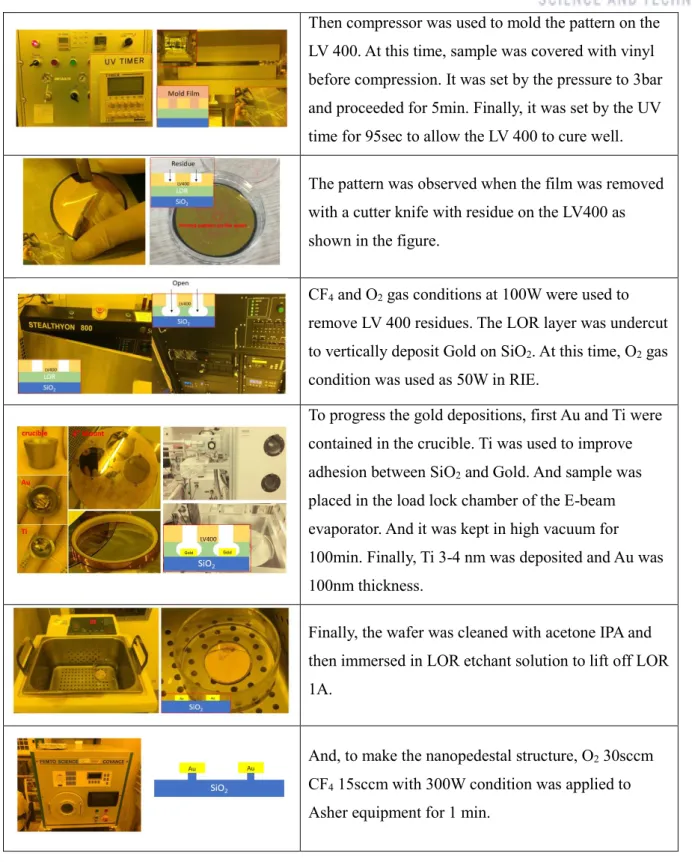
Next, the LV 400 solution (1 cc) was dropped onto the LOR coated SiO2 so that no air bubbles were formed. N2 blowing was performed to remove unwanted particles on the SiO2 wafer surface, and the mold film was covered and rolled on the SiO2 wafer. Finally, it was set by the UV time to 95 sec. to allow LV 400 to harden well.
The pattern was observed when the film was removed with a cutter with residue on the LV400 as shown in the figure. Finally, the wafer was cleaned with acetone IPA and then immersed in LOR etching solution to lift off LOR 1A. And, to make the nanopedestal structure, O2 30sccm CF4 15sccm with 300W condition was applied on Asher equipment for 1 min.
Experiment Result
Measuring & Experimental Equipment
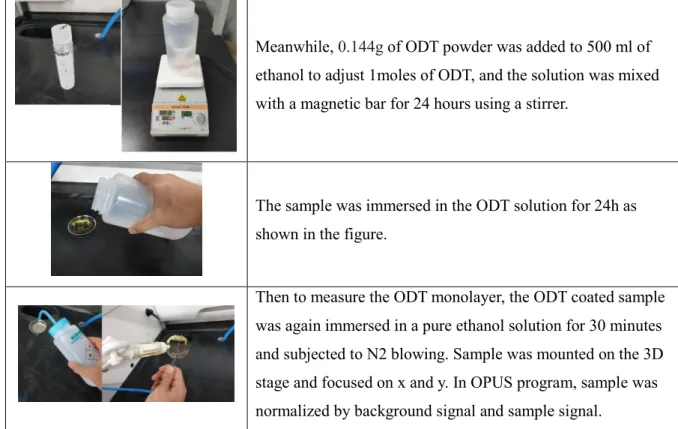
Experiment Step
Then to measure an ODT layer, the ODT-coated sample was again immersed in a pure ethanol solution for 30 min and subjected to N2 blowing.
Experiment Result
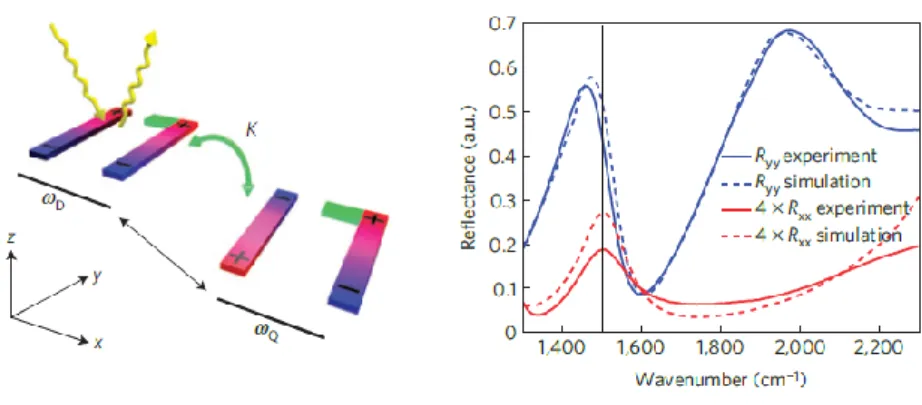
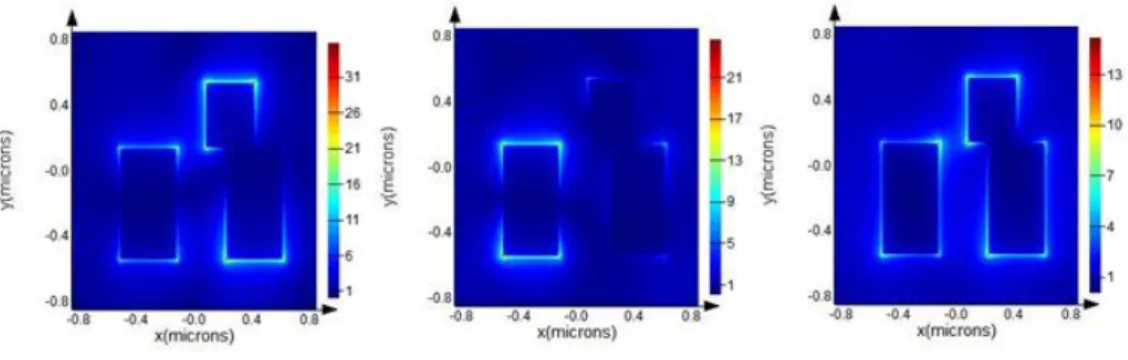
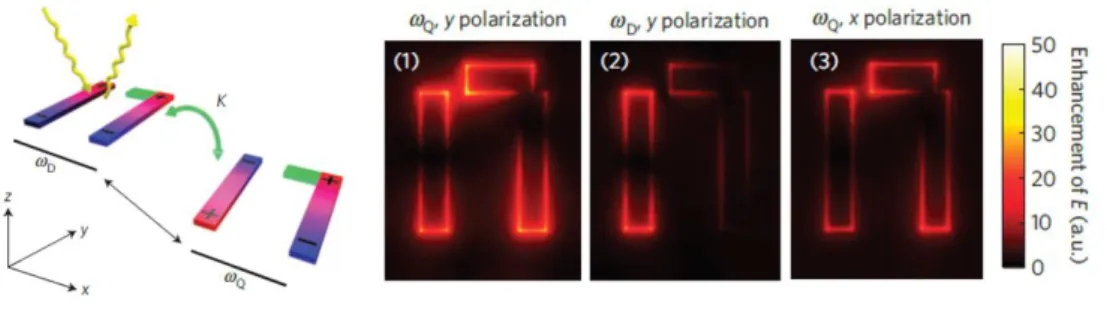
That is, it was observed that there was field enhancement in 𝜔𝐷 and 𝜔𝑄 with y-polarization and field enhancement in 𝜔𝑄 with x-polarization. The size of the field improvement monitor was set as the upper part of the gold bars, as shown in the figure. Therefore, the monitor was checked for 𝜔𝑄, 𝜔𝐷 if it was y-polarization and 𝜔𝐷 if it was x-polarization, respectively.
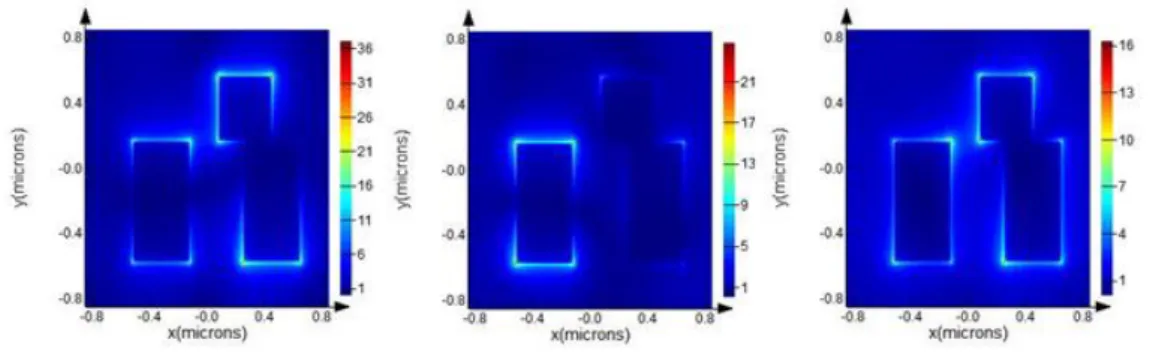
The following figure shows the sequence of field enhancement in 𝜔𝑄 and 𝜔𝐷 in y-polarization and field enhancement in 𝜔𝑄 in x-polarization. Field enhancement in 𝜔𝐷 at y-polarization shows that field enhancement is greatest at both ends of the dipole rod, and observation of field enhancement at 𝜔𝑄 in x-polarization shows field enhancement at both ends in the transverse direction. Meanwhile, it was checked how much the field enhancement is improved when the undercut is performed.
Interestingly, field enhancement in 𝜔𝐷 at y polarization and field enhancement in 𝜔𝑄 at x polarization were almost identical before and after undercutting. Therefore, undercuts were expected to increase the ODT detection capability due to the increase in field enhancement with the previously mentioned effective area increase. L = 740nm, 30nm isotropic undercut Field enhancement in 𝜔𝑄 and 𝜔𝐷 in y-polarization and field enhancement in 𝜔𝑄 in x-polarization.
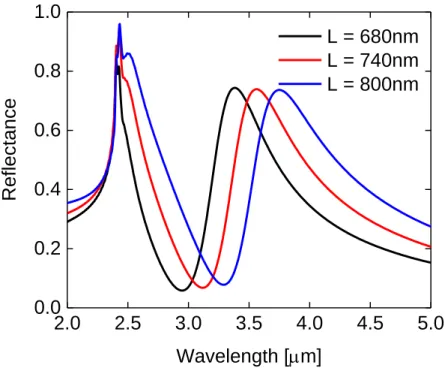
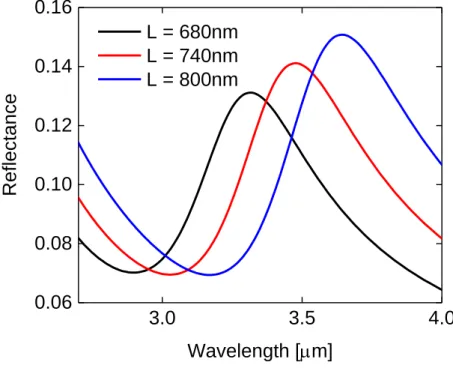
There is a quadrupole resonance on the left shoulder at the peak position based on the y polarization. Then, the ODT signal was checked before and after the Asher process (substrate structure and etch. As expected, the ODT signal was the largest measured at L = 680nm, which is most consistent with the quadrupole resonance.
ODT signal was observed at L = 740nm, which is consistent with quadrupole resonance frequency and ODT absorption frequency. The red line is the result of the etch structure's RBaseline - RODT, and the black line is the result of the substrate structure's RBaseline - RODT. However, in the case of the etching structure, the smallest ∆R was greater than ∆R at the substrate 680 nm, which is the largest ∆R.
TCMT Modelling
Theory
As can be seen from the equation, both the x-polarization and the incident light of the y-polarization can be excited in the case of the dipole parameter. Therefore, if an incident light with y polarization is incident, the quadrupole can excite due to the coupling effect. Meanwhile, solving the differential equations by expressing the amplitudes of each mode as 𝑒𝑗𝜔𝑡 can be derived as follows.
The ODT molecule's calibration wavelength has symmetric and asymmetric vibrational frequencies at 3509 nm and 3427 nm, respectively. Because the 3427nm is a stronger vibration, the amplitude of 3427nm is denoted by M, and the wavelength of 3509nm is denoted by M`. Here, 𝜔𝑀 and 𝜔𝑀` represent the respective vibration frequencies generated in the ODT, and 𝛾𝑀 and 𝛾𝑀` indicate the damping frequency in the ODT.
Similarly, expressing the amplitudes of each state as 𝑒𝑗𝜔𝑡, the differential equation can be solved as follows.
TCMT Modelling Result
Conclusion
Conclusion
Thus, to measure performance, the integrated field intensity was calculated using a Lumeric simulation, resulting in a 1.37-fold increase.
Outlook
In Handbook of Vibrational Spectroscopy; Chalmers, J., Griffiths, P. 26) Neubrech, F.; Huck, C.; Weber, K.; Pucci, A.; Giessen, H., Surface-enhanced infrared spectroscopy using resonant nanoantennas. Arstad, B., In Situ Flow MAS NMR Spectroscopy and Synchrotron PDF Analyzes of the Local Response of the Bronsted Acid Site in SAPO-34 During Hydration at Elevated Temperatures.