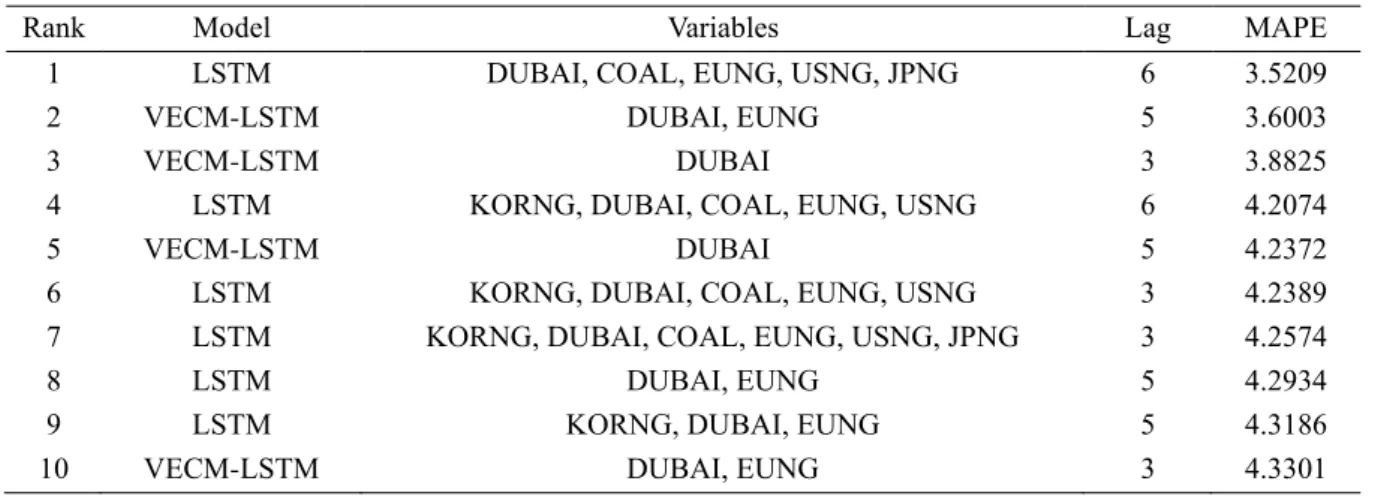
Various independent variables, such as the Dubai oil price, European gas price, Australian Newcastle coal price, US natural gas price, Japanese liquefied natural gas price and system marginal price in Korea were used for forecasting models. Since it is proved that the causality of each independent variable towards South Korean LNG import price is stronger in the order of Dubai oil price, European gas price, Australian Newcastle coal price, US natural gas price, Japanese liquefied natural gas price and SMP, the variables that for prediction used were added one by one in the order of strong granger causality. As a result of forecasting, 6 LSTM models, 4 VECM-LSTM were ranked in the top 10 forecasting models out of the total of 90 models.
The best forecasting model was the LSTM with Dubai oil price, European gas price, Australian Newcastle coal price, US natural gas price and Japanese liquefied natural gas price with lag 6, and its mean absolute percentage error (MAPE) was 3.5209. Seven hybrid models, one LSTM model and two ARIMAX models were ranked in the top 10 forecasting models. VECM-LSTM using Dubai oil price with lag of 5 is derived as the best model with a MAPE of 4.9360.
As a result of two forecasting analyzes for both full and high volatility periods, we found that LSTM using Dubai oil price, European gas price, Australian Newcastle coal price, US natural gas price and Japanese liquefied natural gas price with a lag of 6 and VECM-LSTM using Dubai's oil price, the European gas price with a lag of 5 was ranked third best for both tests.
Explanation of terms and abbreviations
Literature Review
Structure-based models refer to models that forecast natural gas by taking into account other factors such as oil price, gas production, gas consumption, gas imports, etc. It was confirmed that the forecast performance of the adaptive GARCH model was the best, and its MAPE, US natural gas prices were forecast using the support vector regression (SVR) and selective SVR (SelSVR) models, and the price of electricity, storage, pipeline imports, LNG, natural gas consumption, gross production, marketed production, renewable consumption, renewable production, and weather were used as independent variables. The dependent variables used were natural gas price differentials, heating oil prices, heating oil price differentials, WTI oil prices, WTI oil price differentials, Appalachian coal prices, coal price differentials, Baker Hughes US Natural Gas Rotary Rig count, total US market production of natural gas, and imports of natural gas from Canada .
In terms of data-driven models, Lin and Wesseh (2013) used an equally dollar-weighted Markov switch volatility model based on 18 large-cap companies in the natural gas industry to predict the natural gas index. 2019) used four analysis methods to determine oil and gas prices: least squares support vector machine (LSSVM), genetic programming (GP), ANN, and ARIMA. The optimal integrated equation was derived by combining the above four methodologies through metaheuristic bat algorithm (BA), and its MAPE predicted the Henry Hub monthly natural gas spot price using ANN, SVM, gradient boosting machines and Gaussian process regression. models and ANN was confirmed to have better performance compared to other models with a MAPE of 11.2–13.7%. Independent variables include the price of crude oil (WTI), heating. oil price, natural gas, rotary platforms, heating degree days, cooling degree days, market production of natural gas, total consumption of natural gas, amount of underground storage of natural gas and imports of natural gas. 2019) predicted daily, weekly, and monthly Henry Hub spot prices using linear regression, linear SVM, quadratic SVM, cubic SVM, and the Least Squares Regression Maximization Algorithm model.
The performance of the least squares regression enhancing algorithm model was the best with an MSE of 0.4376. In addition to the prediction accuracy, there are several criteria related to the evaluation of the prediction models. The structure-based models mentioned above focused on the variables and parameters applied to obtain the best forecast accuracy, and in most cases did not describe how the independent variables relate to the natural gas price, which is a dependent variable.
However, in most of the existing literature, there were no specific explanations about the reasons for choosing the dedicated variables, and supply and demand-related variables such as temperature, production and inventories were used as independent variables. In addition, oil prices, coal prices, electricity prices, and natural gas prices in other regions were used as independent variables instead of the supply and demand-related variables that were mainly used in the existing papers. In addition, as mentioned above, there are relatively few previous studies on LNG price forecasting compared to other commodity price forecasting such as oil price, but most studies on natural gas price forecasting have been limited to the US and European markets.
Methodology and Data
- ARIMAX
- VECM
- LSTM
- Hybrid model
- Data Description
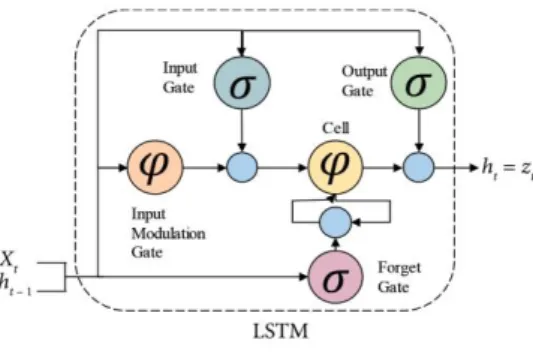
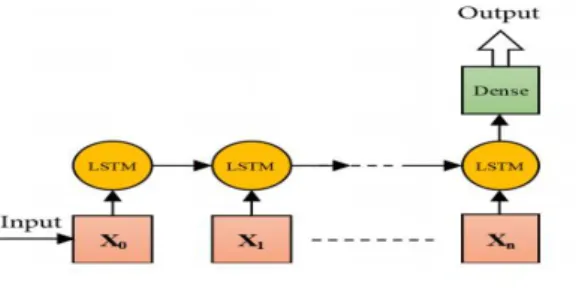
A VAR model is used to show simultaneous interactions between a group of variables through a system of equations that considers the sets of explanatory variables for each equation to form lags in each of the model's endogenous variables in addition to its deterministic or exogenous variables and their corresponding lags. In Figure 2, 𝑋𝑡 represents the input data at time step t and the output of the previous unit. In the first step, the ARIMAX or VECM model is used to analyze the linear part of the problem.
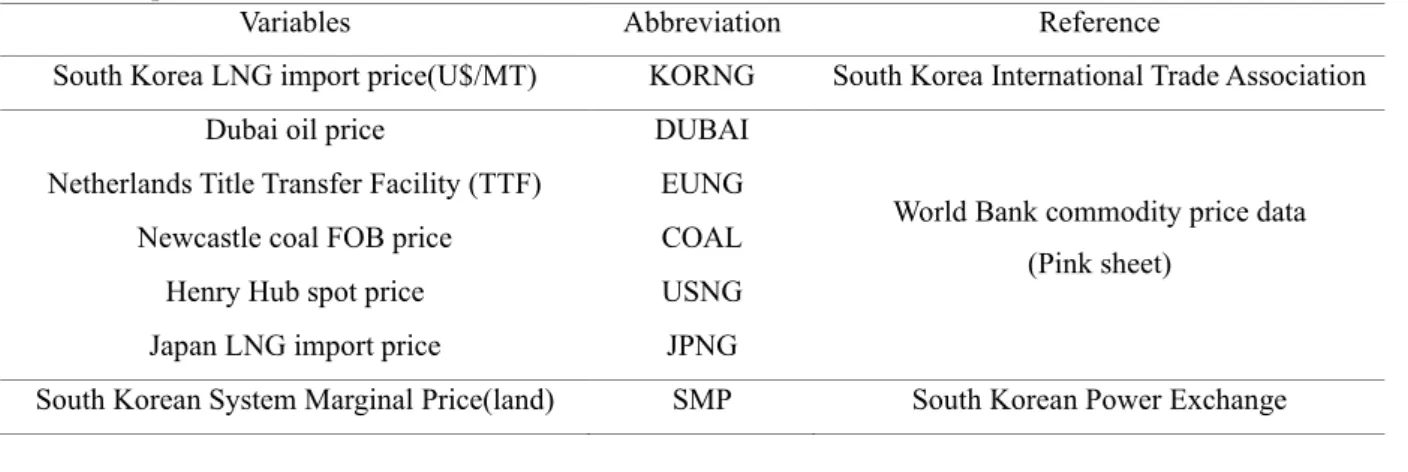
Because the ARIMAX and VECM model cannot capture the nonlinear structure of the data, the residuals of the linear model will contain information about the nonlinearity (Zhang, 2003). In this study, the mean absolute percentage error (MAPE) is used as a loss function to evaluate the performance of prediction models; MAPE is a scale-independent measurement of the difference between actual and predicted values, expressed as a percentage, and can intuitively explain the relative errors. The explanatory variables are the Dubai oil price, the FOB price of Australian Newcastle coal, the Dutch ownership transfer facility, the Henry Hub spot price, the Japanese LNG import price and the South Korean system marginal price (SMP).
All the data used in this study were public data, which will facilitate the easy use of the forecasting model. For convenience, the Dubai oil price will be denoted as DUBAI, the Australian Newcastle FOB coal price as COAL, the Netherlands TTF (Title Transfer Facility) as EUNG, the Henry Hub spot price as USNG, the Japanese LNG import price as JPNG and the marginal price of the South Korean system as SMP. Therefore, it is assumed that coal price may be an important variable in predicting South Korea's LNG import price.
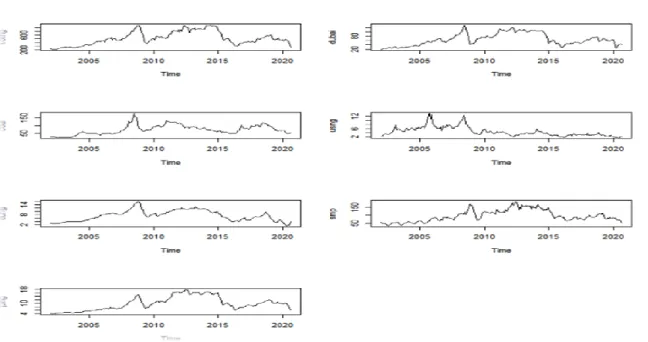
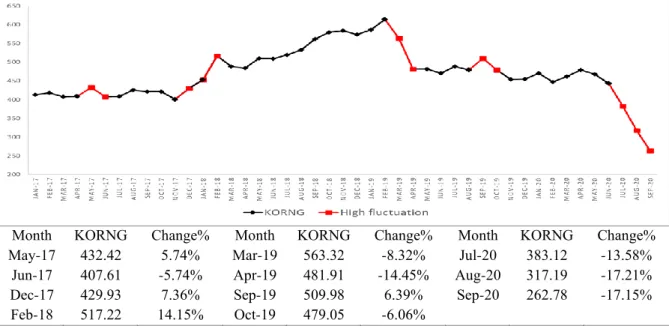
The South Korean power market adopts cost-based pricing and to meet the power demand for the period, the power plants are started in the order of the lowest fuel cost among power plants in the country. At this time, the variable cost of the most recently started power station is SMP. The starting point was determined taking into account the fact that SMP data existed from 2002; September 2020, which was the most recent data at the time of this study, was set as the endpoint.
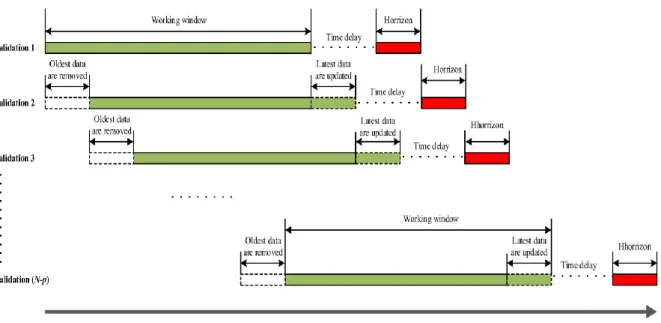
Empirical Study 1. Analysis Period
- ARIMAX Modeling
- VECM Modeling
- LSTM Modeling
- Hybrid Modeling
- Empirical Study Results
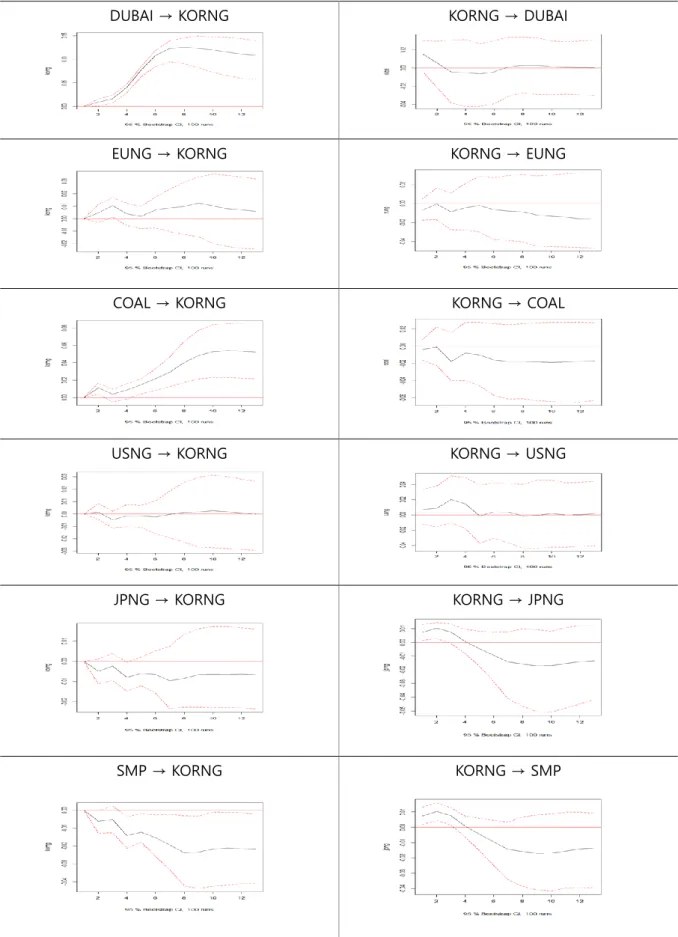
The data used is in the form of monthly period data from January 2002 to September 2020. It will be equally applied to VECM and LSTM, which will be covered in the future. Hence, it is estimated that the independent variables granger causality to KORNG was in the order of DUBAI, EUNG, COAL, USNG, JPNG and SMP.
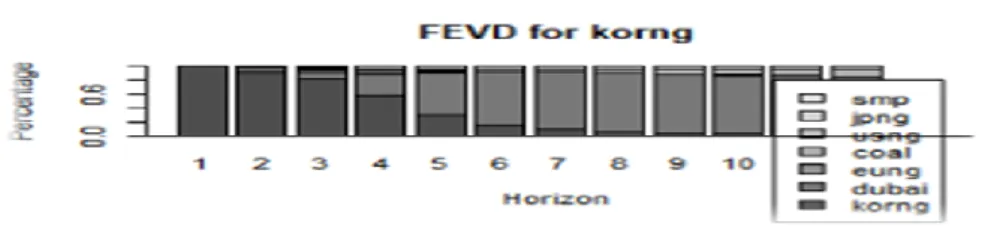
First, in the case of the effects of independent variable on KORNG, it is identified that KORNG responds in a positive direction to the shock of DUBAI and COAL and that the response becomes stronger over time and continues to be affected in the long run. On the other hand, in the case of the effect of KORNG on explanatory variables, it was proved that KORNG had little effect on DUBAI and USNG and had a small effect on EUNG in a positive direction and negative direction on COAL in the long term. In addition, it was found that KORNG affected JPNG and SMP slightly in the positive direction in the early phase and significantly in the negative direction in the long term.
Selecting the optimal number of neurons for the layer in the LSTM network is also not a straightforward task. To find the optimal number of neurons, it was analyzed in units of 10 in the range from 10 to 200. In the case of lag size, 12 lags were used for LSTM with ARIMAX residuals considering the annual seasonality of monthly time series; for the VECM residuals, the lag magnitude derived from the VECM analysis was used.
After that, it is predicted by removing the independent variables one by one in the order of granger causality. As a result of the granger causality test, strong and clear granger causality is considered in the order of DUBAI, EUNG, COAL, USNG, JPNG and SMP. As for the independent variables, a smaller number of variables is usually used for the hybrid model and in the case of LSTM, a larger number of variables was better.
Regarding the dynamics of South Korean LNG import price, it is found that the independent granger variables cause the South Korean LNG import price in the order of Dubai oil price, European natural gas prices, Australian Newcastle coal prices, US natural gas prices, Japanese liquefied natural gas price and SMP. In the empirical study, 6 LSTM models, 4 VECM-LSTM models were ranked among the top 10 forecasting models, and individual econometric models were not included.
Forecasting stock price index volatility: A hybrid model integrating LSTM with multiple GARCH-type models. A critical review of South Korea's long-term contract for renewable energy auctions: The relationship between the import price of liquefied natural gas and the system's marginal price. Using artificial neural networks to predict exchange rates, including VAR-VECM residual analysis and linear prediction combination.
Forecasting short- and long-term energy consumption using the arimax model in the construction and materials sector in Thailand.
Acknowledgements