Spatial distribution of AOD in MODIS (left), No-Fire (middle) and CTR (right) in June 2013. Spatial distribution of AOD in MODIS, MERRA, CTR and FDDA (left to right) for June 2013. Domain average of AOD in MODIS (black line), FDDA (red line), CTR (yellow line) on the left and the scatter plot of FDDA to MODIS and MERRA on the right in June 2013.
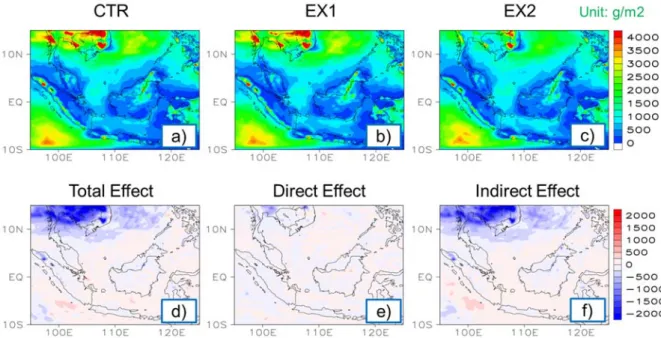
Monthly mean spatial distribution of AOD simulated in 2013 (top) and 2015 (bottom) in three simulations: CTR (no aerosol effect), EX1 (direct effect), EX2 (indirect aerosol effect).
Introduction
Background and Motivation
In addition, the population living in the regions has significant health problems and many potential risks due to the deterioration of air quality during biomass burning. Additionally, Jayachandran researched in 2005 that long-term infant survival rates decrease during biomass burning. In radiation influence, the heating of the surface is defined as positive radiation, and the cooling of the surface as negative radiation.
In this sense, the radiative effect of the total aerosol effect, which includes the direct and indirect effects of the aerosol in the atmosphere, is estimated to be about -0.9 W m−2 in the range of -1.9 to -0.1 W m−2.
Literature Review
Chem has been used extensively to address the importance of anthropogenic (eg, anthropogenic) aerosols in regulating local and regional climate change due to aerosol effects (eg, direct and indirect). The results show that aerosol effects caused by anthropogenic aerosol can reduce surface shortwave radiation, 2 m temperature, NO2. The results reveal that the PBLH decreases up to 278.2 m and the PM2.5 concentration increases by more than 20 µg m−3 when the aerosol feedback is included in the simulation.
Furthermore, the direct and indirect effects of aerosol increase the surface concentrations of primary trace gases such as CO and SO2 due to reduction of PBLH and stabilize the lower atmosphere.
Research Objectives
Specific matter dispersion for investigating the transport of haze events generated during the 1997 major biomass burning event. Overall, DARLAM quantified the haze transport and highlighted fire-related biomass burning as important, but still limited in which factors modulate the haze (e.g. climate variability, El -Nino, monsoon) and analyzed aerosols (e.g. BC, OC, AOD…). Engling (2015) applied Hybrid Single-Particle Lagrangrian Integrated Trajectory (HYSPLIT) to find the mass balance of typical TSP (e.g. BC, OC).
Recently, Aouizerats (2015) implemented Weather Research & Forecast Linked Chemistry using Global Fire Emissions Database (GFED: and found that AOD is still underestimated.
Data and Model Experiments
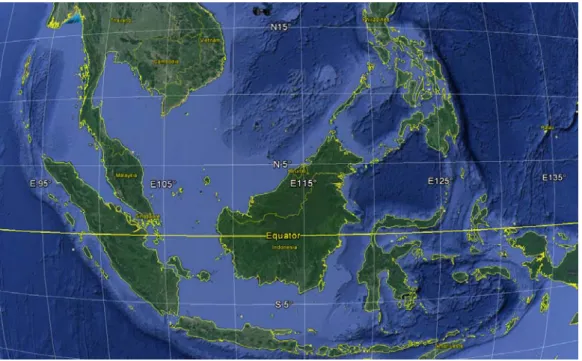
Study Area
During this process, a large amount of energy is transferred to the upper atmosphere and is carried westward and eastward as the Walker circulation.
Observational and Reanalysis Data
- Satellite-borne Observations
- Aerosol Robotic Network Data
- Reanalysis Data
These MERRA wind components are available in 1h, 3h, daily, monthly data and to date at 0.5° lat spatial resolution. x 0.625° long x 72 hybrid sigma/pressure levels.
Model Experiments
- The WRF-Chem Model Description
- Model Configuration
- Sensitivity Experiments
- Evaluation Methods
The MM5 similarity scheme and NOAH Land Surface model are used to represent the model surface process. In order to enable the vertical sub-grid-scale eddy transport, the Yonsei University (YSU) boundary layer scheme is used (Hong et al., 2006). The Model for Ozone and Related Chemical Tracers (MOZART-4) chemical scheme is used as the gas-phase chemistry in simulation (Emmons et al., 2010).
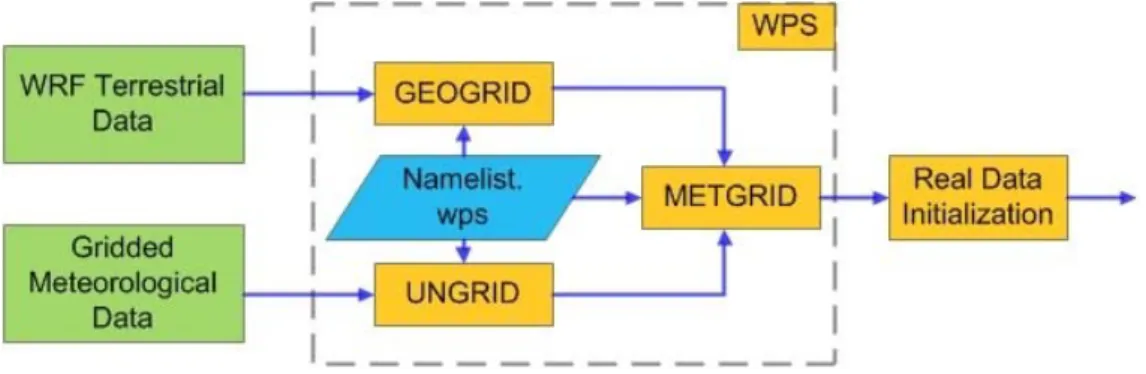
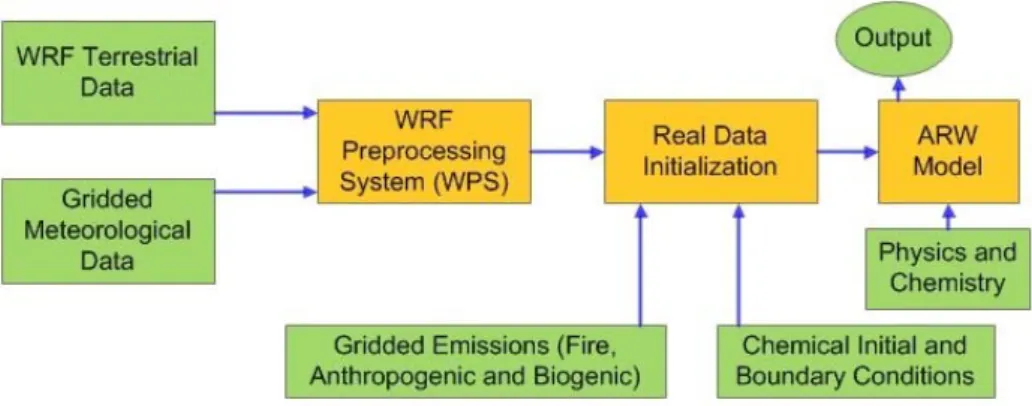
A model for the simulation of aerosol interactions and chemistry - MOSAIC (Zaveri et al., 2008) is used to represent aerosol processes. The model of emissions of gases and aerosols from nature is used to provide atmospheric traces of gases, aerosols due to biogenic emissions. Main components and flow diagram of the WRF-Chem modeling system specific to this study.
Main components of the WPS are shown along with the data flow between these components. The actual data initialization program of the WRF-Chem model can also be separated into two parts. Biogenic emissions Model of emissions of gases and aerosols from nature (MEGAN) version 2.04 (Guenther et al., 2006).
The Model of Emissions of Gases and Aerosols from Nature (MEGAN) is used to provide online aerosol species and atmospheric tracers resulting from biogenic emissions (Guenther et al., 2006). The NCAR Fire Inventory (FINN version 1) is used to provide daily data on the emission of aerosols and atmospheric trace gases produced during biomass burning (Wiedinmyer et al.
Results and Discussion
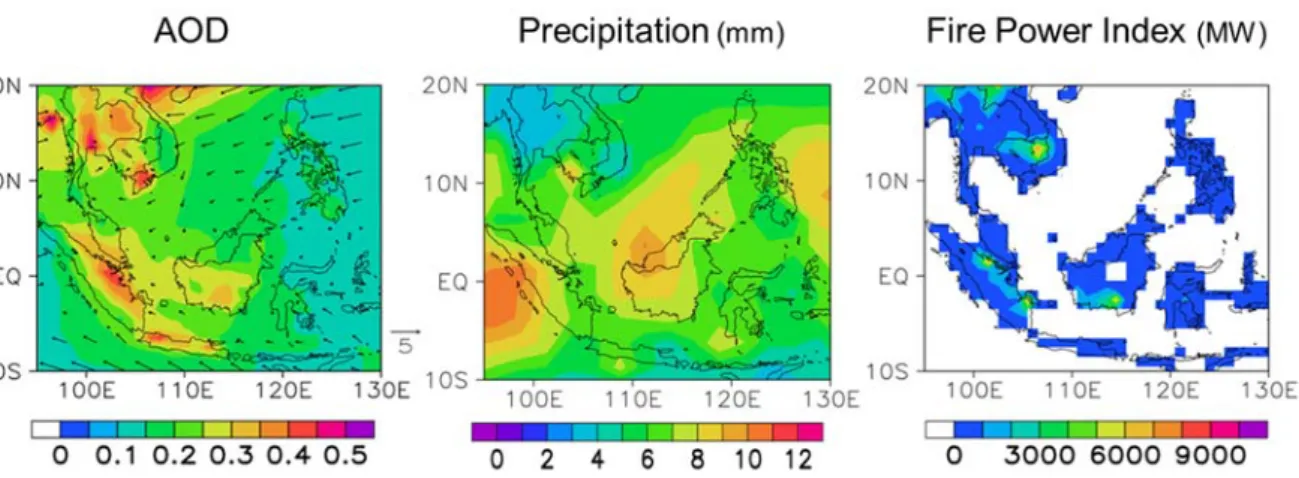
Observed Characteristics of Aerosol Variability
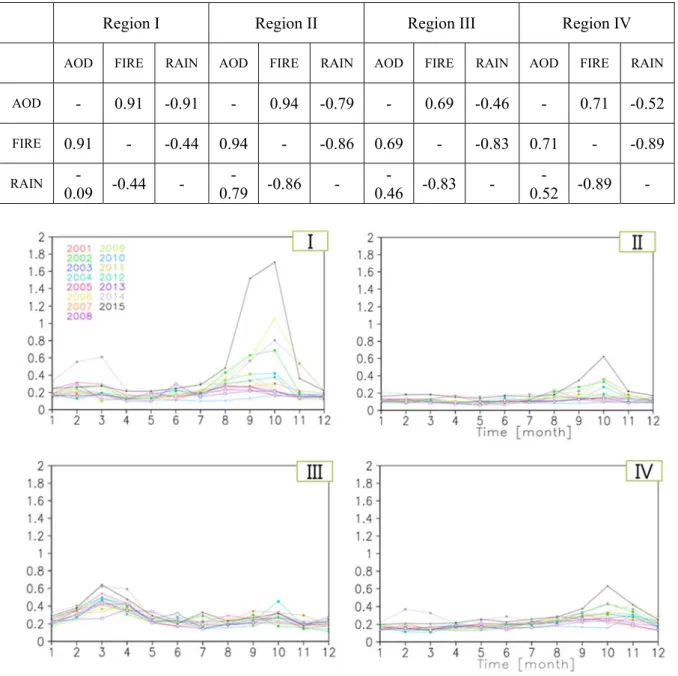
In the left figure, each dot indicates the domain mean value of each month, averaged over the entire period from 2001 to 2001. First, there is a strong positive relationship between the number of fires and AOD and a negative relationship between precipitation and number of fires in the seasonal cycle of AOD in regions I, II, IV. On the other hand, the trend in region III is opposite; the figure indicates that most fires occur in spring, with high AOD and low precipitation.
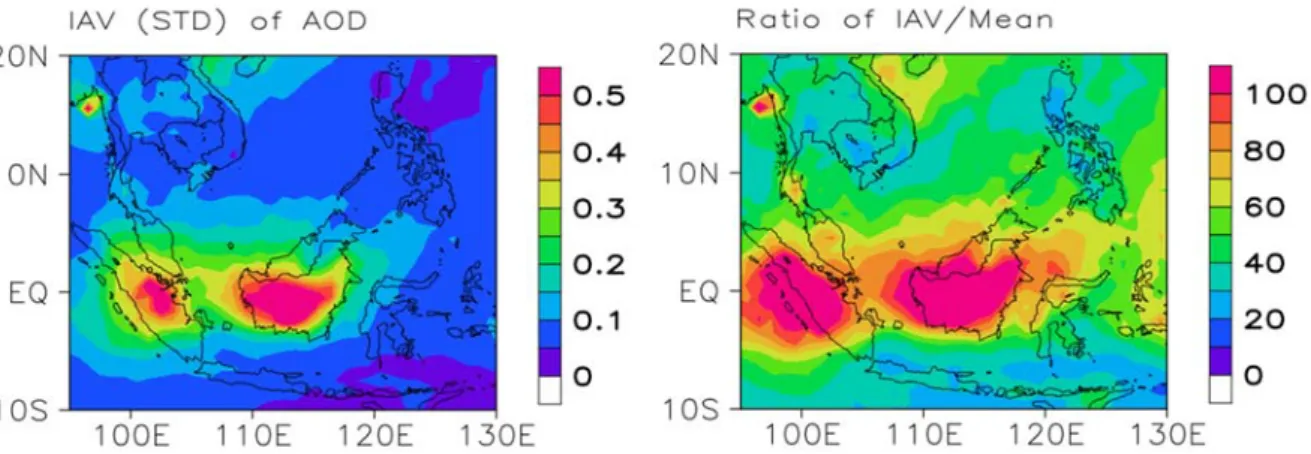
However, it is so negligible fire occurrence and AOD value during the summer time compared to the region I, II and IV. It can be seen that the AOD trend in region I, II and IV is similar in which the peak usually occurs during summer time and the opposite trend is found in region III as the peak AOD is in spring time as discussed above. It can be seen that high standard deviation occurs almost in the biomass burning regions.
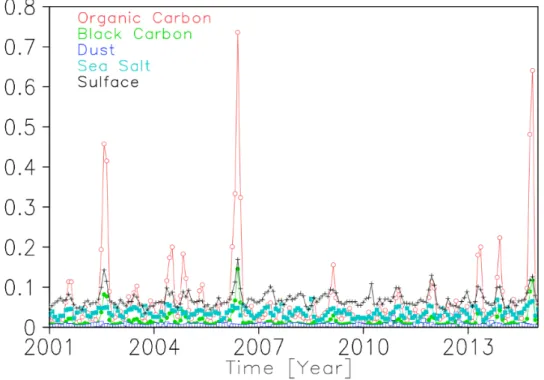
The above data analysis section shows that most of the high AOD value in the main study region (region II) is contributed by the biomass burning (fire) associated with precipitation as the sink for the AOD. The BC value is about 6 – 7 times less compared to OC and the dust amount is not much in the study regions. The region of its high correlation with OC and BC is due to the biomass burning that usually occurs during El-nino years as discussed above.
In the sulfate model, it can be seen that there is no specific hot spot indicating that SU is generated by biomass burning. For DU, it is speculated that most of the dust comes from other regions in the study area such as Myanmar, China in the north and Australia in the south.

Evaluation of the Model Simulation
- Winds
- Precipitation
- Vertical Profiles
- Aerosol Optical Depth
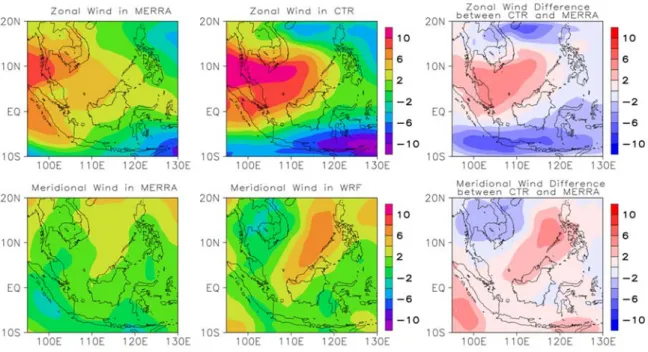
In the case of WRF-Chem without FDDA (CTR) case, the model shows high positive and negative bias. For the zonal wind, CTR overestimates much of the zonal wind in the west of the domain with a mean wind speed of 10 m/s which is about 6 m/s in MERRA. The zonal wind difference between CTR and MERRA indicates that the model overestimates the zonal wind in the region of 100–120º E, 0–10º N and underestimates the zonal wind in the region of (95–130º E, -10–0º N).
In particular, in the FDDA case, the model significantly underestimated precipitation during simulation periods, with differences in an aspect of spatial distribution and extent. The largest discrepancy between model and observation is in the northeast, where the model overestimates precipitation, and in the northwest, where the model underestimates precipitation. The model overestimates the relative humidity in the lower and upper atmosphere, and underestimates it in the middle atmosphere.
It can be suggested that both MERRA and WRF-Chem CTR simulation have bias in the fire emission inventory, which in turn leads to underestimate the AOD concentration in the simulation compared to MODIS. In the case of CTR, it overestimated AOD in the northern area of the domain (e.g., cities) and underestimated AOD in the main fire regions. Variations in collocated AERONET observed and WRFChem simulated aerosol optical depth at 550 nm at six sites located in the model domain during 01–30 June 2013.
In the case of Pontianak station, it shows the best comparison between the AERONET station and the model simulation. It can capture both the fluctuation in the first month and the peak on June 24 - 25. In Bandung, the model seems unable to capture the biomass burning signal because it is located in the metropolitan area with a high daily AOD cycle.
Aerosol Impacts on Meteorology and Air Quality
- Impacts on Meteorological Fields
- Impacts on Air Quality
The PBL height is expected to be reduced due to the reduction in shortwave radiation and 2 temperature. Its signal is clearly shown in the direct aerosol case that the PBL height is decreasing, but it is unclear signal in the indirect case due to less reduction compared to the direct case. III 28, aerosol direct effect plays a small role in changing cloud properties, while aerosol indirect effect is more significant, mainly in the north.
The direct aerosol effect (EX1 – CTR) and the indirect effect (EX2 – EX1) are shown in the middle and right side of Fig. NOx is mainly affected by the aerosol effect in which it increases NOx more in the region. In the direct aerosol effect, the aerosol interception effect can reduce surface shortwave radiation and cool the surface resulting in less upward motion, reducing the height of the PBL.
It is clear that in the area where PM2.5 increases, it is related to the area where PBL height decreases. Because less vertical wind is transported to the upper atmosphere, there is also less cloud cover and precipitation formation, indicating that the direct effect of the removal mechanism of wet deposition in the aerosol does not contribute much. Monthly PM2.5 vertical difference in the direct aerosol effect (EX1 – CTR) (right) and monthly AOD, rain, the PBLH (left) averaged at – 5ºC to 5ºC latitude.
Monthly vertical wind profile (right) and cloud fraction (left) in the aerosol direct effect (EX1 – CTR) averaged at – 5ºS to 5ºN latitude. Monthly PM2.5 vertical wind profile (right) and monthly AOD, rain, the PBLH (left) in the aerosol indirect effect averaged at – 5ºS to 5ºN latitude. The spatial distribution of the no-fire case shows no signal of the biomass burning (fire) in the simulation.
Unlike in the discussion above that both aerosol directly and indirectly impacted the regional meteorology, the aerosol indirectly has a small influence on gas pollution.