JHEP10(2017)019
Published for SISSA by Springer
Received: June 14, 2017 Revised: August 24, 2017 Accepted: September 18, 2017 Published: October 3, 2017
Search for top squark pair production in pp collisions at √
s = 13 TeV using single lepton events
The CMS collaboration
E-mail: [email protected]
Abstract: A search for top squark pair production in pp collisions at √
s = 13 TeV is performed using events with a single isolated electron or muon, jets, and a large transverse momentum imbalance. The results are based on data collected in 2016 with the CMS de- tector at the LHC, corresponding to an integrated luminosity of 35.9 fb−1. No significant excess of events is observed above the expectation from standard model processes. Exclu- sion limits are set in the context of supersymmetric models of pair production of top squarks that decay either to a top quark and a neutralino or to a bottom quark and a chargino.
Depending on the details of the model, we exclude top squarks with masses as high as 1120 GeV. Detailed information is also provided to facilitate theoretical interpretations in other scenarios of physics beyond the standard model.
Keywords: Beyond Standard Model, Hadron-Hadron scattering (experiments), Top physics
ArXiv ePrint: 1706.04402
JHEP10(2017)019
Contents
1 Introduction 1
2 The CMS detector 2
3 Simulated samples 2
4 Event reconstruction and preselection 3
5 Signal regions 5
6 Background estimation 6
6.1 Lost-lepton background 7
6.2 One-lepton background 9
6.3 Background from events containing Z→νν¯ decays 11
7 Results and interpretation 11
8 Summary 15
A Additional information 17
The CMS collaboration 22
1 Introduction
Supersymmetry (SUSY) [1–8] is an extension of the standard model (SM) that postulates the existence of a superpartner for every SM particle with the same gauge quantum numbers but differing by one half-unit of spin. The search for a low mass top squark, the scalar partner of the top quark, is of particular interest following the discovery of a Higgs boson [9–
11], as it would substantially contribute to the cancellation of the divergent loop corrections to the Higgs boson mass, providing a possible solution to the hierarchy problem [12–14].
We present results of a search for top squark pair production in the final state with a single lepton (`= e orµ) with high transverse momentum (pT), jets, and significantpTimbalance.
Dedicated top squark searches have been carried out by the ATLAS [15] and CMS [16,17]
collaborations based on 13 TeV proton-proton (pp) collisions at the CERN LHC, with data sets corresponding to integrated luminosities of 3.2 and 2.3 fb−1, respectively. In this paper we report on an extension of the search of ref. [16] in the single-lepton final state that exploits the data sample collected with the CMS detector [18] in 2016, corresponding to the much larger integrated luminosity of 35.9 fb−1 . We find no evidence for an excess of events above the expected background from standard model processes, and interpret the results as limits on simplified models [19–22] of the pair production of top squarks (et)
JHEP10(2017)019
p
p et
et
t e χ01 e χ01 t
(a)
p
p et
et
e χ+1 e χ−1
b¯ W−
e χ01 e χ01 W+ b
(b)
p
p et
et
e χ+1
¯t e χ01 e χ01 W+ b
(c)
Figure 1. Simplified-models diagrams corresponding to top squark pair production, followed by the specific decay modes targeted in this paper. (a) pp→etet→tχe01 tχe01; (b) pp→etet→bχe+1bχe−1; (c) pp→etet→bχe+1tχe01. Charge-conjugate decays are implied.
decaying into top quarks and neutralinos (χe01) and/or bottom quarks and charginos (χe±1), as shown in figure 1. We take theχe01 to be the lightest supersymmetric particle (LSP) and to be stable.
2 The CMS detector
The central feature of the CMS apparatus is a superconducting solenoid of 6 m internal diameter, providing a magnetic field of 3.8 T. Within the solenoid volume are a silicon pixel and strip tracker, a lead tungstate crystal electromagnetic calorimeter, and a brass and scintillator hadron calorimeter, each composed of a barrel and two endcap sections.
Forward calorimeters extend the pseudorapidity (η) coverage provided by the barrel and endcap detectors. Muons are measured in gas-ionization detectors embedded in the steel flux-return yoke outside the solenoid. The first level of the CMS trigger system, composed of custom hardware processors, uses information from the calorimeters and muon detectors to select the most interesting events in a fixed time interval of less than 4µs. The high-level trigger processor farm further decreases the event rate from around 100 kHz to less than 1 kHz, before data storage. A more detailed description of the CMS detector, together with a definition of the coordinate system used and the relevant kinematic variables, can be found in ref. [18].
3 Simulated samples
The Monte Carlo (MC) simulation is used to design the search, to aid in the estimation of SM backgrounds, and to evaluate the sensitivity to top squark pair production.
JHEP10(2017)019
The MadGraph5 amc@nlo 2.2.2 generator [23] in the leading-order (LO) mode, with MLM matching [24], and with the LO NNPDF3.0 [25] parton distribution functions (PDFs) is used to generate top squark signal events as well as SM tt, W+jets, Z+jets, and γ+jets. Single top quark events are generated at next-to-leading order (NLO) with powheg 2.0 [26–29], while rare SM processes such as ttZ and ttW are generated at NLO using theMadGraph5 [email protected] program, with FxFx matching [30] and the NLO NNPDF3.0 PDFs. Parton showering, hadronization, and the underlying event are modeled bypythia8.205 [31]. For SM processes, the response of the CMS detector is simulated with theGeant4[32] package, while the CMS fast simulation program [33] is used for the signal samples. The most precise cross section calculations are used to normalize the SM simulated samples, corresponding most often to next-to-next-to-leading order (NNLO) accuracy.
To improve on the MadGraph5 amc@nlomodeling of the multiplicity of additional jets from initial state radiation (ISR), simulated tt events are reweighted based on the number of ISR jets (NJISR) so as to make the jet multiplicity agree with data. The same reweighting procedure is applied to SUSY MC events. The reweighting factors vary between 0.92 and 0.51 forNJISRbetween 1 and 6. We take one half of the deviation from unity as the systematic uncertainty on these reweighting factors to cover possible differences between top quark and top squark pair production.
4 Event reconstruction and preselection
Data events are selected online using triggers that require either a large pT imbalance or the presence of an isolated electron or muon, see table 1. The combined trigger efficiency, as measured with a data sample of events with large scalar sum of jet pT, is >99% in the signal regions of interest described below.
The offline event reconstruction is based on the particle-flow (PF) algorithm [34], which combines information from the tracker, calorimeter, and muon systems to identify charged and neutral hadrons, photons, electrons, and muons in the event. The preselection based on PF objects is summarized in table 1and is described in more detail below.
The reconstructed vertex with the largest value of summed physics-object p2T is taken to be the primary pp interaction vertex. The physics objects are the objects returned by a jet finding algorithm [35,36] applied to all charged tracks associated with the vertex, plus the corresponding associated missing transverse momentum.
Selected events are required to have exactly one electron [37] or muon [38] withpT >
20 GeV and |η| < 1.4442 or |η| < 2.4, respectively. The lepton needs to be consistent with originating from the primary interaction vertex and isolated from other activity in the event. Typical lepton selection efficiencies are approximately 85% for electrons and 95% for muons within the selection acceptance criteria, with variations at the level of a few percent depending on thepT and η of the lepton.
Jets are formed by clustering neutral and charged PF objects using the anti-kT algo- rithm [35] with a distance parameter of 0.4. The charged PF objects are required to be consistent with originating from the primary vertex. Jet energies are corrected for contri- butions from multiple interactions in the same or adjacent beam crossings (pileup) [36],
JHEP10(2017)019
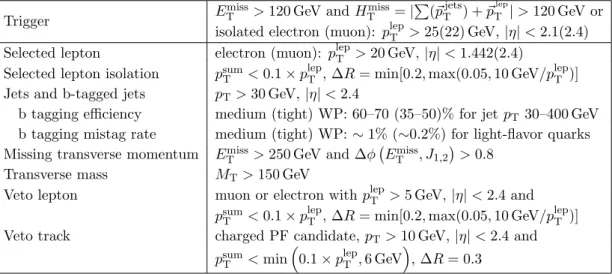
Trigger ETmiss>120 GeV andHTmiss=|P
(~pTjets) +~pTlep|>120 GeV or isolated electron (muon): plepT >25(22) GeV,|η|<2.1(2.4) Selected lepton electron (muon): plepT >20 GeV,|η|<1.442(2.4)
Selected lepton isolation psumT <0.1×plepT , ∆R= min[0.2,max(0.05,10 GeV/plepT )]
Jets and b-tagged jets pT>30 GeV,|η|<2.4
b tagging efficiency medium (tight) WP: 60–70 (35–50)% for jetpT 30–400 GeV b tagging mistag rate medium (tight) WP:∼1% (∼0.2%) for light-flavor quarks Missing transverse momentum ETmiss>250 GeV and ∆φ ETmiss, J1,2
>0.8 Transverse mass MT>150 GeV
Veto lepton muon or electron withplepT >5 GeV,|η|<2.4 and psumT <0.1×plepT , ∆R= min[0.2,max(0.05,10 GeV/plepT )]
Veto track charged PF candidate, pT>10 GeV, |η|<2.4 and psumT <min
0.1×plepT ,6 GeV
, ∆R= 0.3
Table 1. Summary of the event preselection. The symbol plepT denotes thepTof the lepton, while psumT is the scalarpT sum of PF candidates in a cone around the lepton but excluding the lepton.
For veto tracks this variable is calculated using charged PF candidates, while in the case of selected and veto leptons neutral PF candidates are also included. The veto lepton and track definitions are used for event rejection as described in the text. Light-flavor jets are defined as jets originating from u, d, s quarks or gluons.
and to account for nonuniformity in the detector response [39]. Jets overlapping with the selected lepton within a cone ∆R=√
(∆η)2+ (∆φ)2 = 0.4 are not considered. We select events with two or more jets with pT > 30 GeV and |η| < 2.4, at least one of which is required to be consistent with containing the decay of a heavy-flavor hadron. These jets, referred to as b-tagged jets, are identified using two different working points (medium and tight WP) of the CSVv2 tagging algorithm [40, 41]. The jet corrections described above are propagated consistently as a correction to the missing transverse momentum vector (~pTmiss), defined as the negative vectorpT sum of all PF objects. We denote the magnitude of this vector as ETmiss in the discussion below. Events with possible contributions from beam halo processes or anomalous noise in the calorimeter are rejected using dedicated filters [42].
Background events originating from tt decays with only one top quark decaying lepton- ically (tt→1`), W+jets, and single top quark processes are suppressed by the requirement on theEmissT and the transverse mass (MT) of the lepton-~pTmiss system. For signal, higher values of ETmiss than for background are expected due to the presence of additional un- observed particles, the LSPs. Similarly, the MT distribution has a jacobian edge around the W boson mass for background events, whereas for signal events no such edge exists due to the presence of the LSPs. We require MT to be greater than 150 GeV. After these requirements, the largest contribution of SM background events is from processes with two lepton in the final state such as from tt (tt→ 2`) where the second lepton does not pass the selection requirements for the leading lepton. Additional rejection is achieved by ve- toing events containing a second lepton or isolated track passing looser identification and isolation requirements than those used for the leading lepton. We also demand that the
JHEP10(2017)019
angle min ∆φ(J1,2, ETmiss) in the azimuthal plane between the~pTmiss and the direction of the closest of the two leading pT jets in the event (J1 and J2) to be greater than 0.8 radians.
This requirement is motivated by the fact that background tt → 2` events tend to have high-pT top quarks, and thus objects in these events tend to be collinear in the transverse plane, resulting in smaller values of min ∆φ(J1,2, ETmiss) than is typical for signal events.
5 Signal regions
We define two sets of signal regions. The first set (“standard”) is designed to be sensitive to most of the ∆m et,χe01
≡m
et−m
χe01 parameter space, where m
et and m
χe01 are the masses of the top squark and the LSP, respectively.
The second set (“compressed”) is designed to enhance sensitivity to the decay mode in figure 1(a) when ∆m et,χe01
∼mt. While the signal regions within each set are mutually exclusive, there is overlap across the signal regions of the two sets.
Both sets have been optimized to have a high signal sensitivity for different decay modes and mass hypotheses using simulation of the SM background processes and the simplified model topologies shown in figure 1.
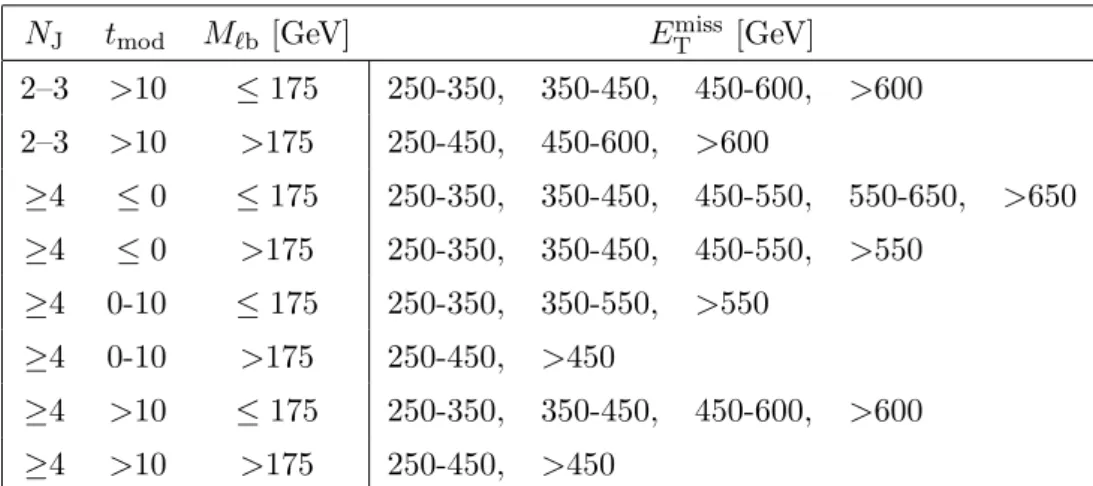
For the first set, signal regions are defined by categorizing events based on the number of jets (NJ), theEmissT , the invariant mass (M`b) of the lepton and the closest b-tagged jet in ∆R, and a modified version of the topness variable [43],tmod:
tmod= ln(minS), withS(~pW, pz, ν) = (m2W−(pν+p`)2)2
a4W +(m2t −(pb+pW)2)2
a4t (5.1)
with the constraint~pTmiss=~pT,W+~pT,ν. The first term corresponds to the leptonically de- caying top quark, the second term to the hadronically decaying top quark. The calculation uses resolution parameters aW = 5 GeV and at = 15 GeV. The exact choices of objects used in this variable together with a more detailed motivation can be found in ref. [16].
In models withet decays containing aχe±1 that is almost mass degenerate with the χe01, the SM decay products of theχe±1 are very soft. The final state for these signal can contain a small number of jets, while in signal models without this mass degeneracy at least four jets are expected. The M`b distribution has a sharp endpoint at about q
m2t −m2W for events containing a leptonically decaying top quark such as tt events or signals containing at least one top quark in the decay chain. On the other hand, theM`b distribution does not have this endpoint for the sub-dominant background of W+jets as well as signal models with top squark decays to a b quark and a χe±1. The tmod variable tests for compatibility with the tt→2`hypothesis when one of the leptons is not reconstructed. Very high values of tmod imply that an event is not compatible with the tt→2`hypothesis. Signal models with large ∆m et,χe01
result in such values. On the other hand negative values of tmod are a property of tt→2`. As signal models with a small mass splitting betweenet andχe01 also have low values in tmod, we keep events with negative tmod, to retain sensitivity for these signal models.
The requirements for the standard signal regions are summarized in table 2.
JHEP10(2017)019
NJ tmod M`b [GeV] ETmiss [GeV]
2–3 >10 ≤175 250-350, 350-450, 450-600, >600 2–3 >10 >175 250-450, 450-600, >600
≥4 ≤0 ≤175 250-350, 350-450, 450-550, 550-650, >650
≥4 ≤0 >175 250-350, 350-450, 450-550, >550
≥4 0-10 ≤175 250-350, 350-550, >550
≥4 0-10 >175 250-450, >450
≥4 >10 ≤175 250-350, 350-450, 450-600, >600
≥4 >10 >175 250-450, >450
Table 2. Definitions for the 27 signal regions of the standard selection. At least one b-tagged jet satisfying the medium WP algorithm is required in all search regions. To suppress the W+jets back- ground in signal regions withM`b>175 GeV, we instead use the more strict tight WP requirement.
Selection NJ≥5, J1 not b tagged, ∆φ(ETmiss, `)<2, min ∆φ(J1,2, EmissT )>0.5, p`T <150 GeV Search regions ETmiss = 250-350, 350-450, 450-550, >550 GeV
Table 3. Summary of the compressed selection and the requirements for the four corresponding signal regions. The symbol ∆φ(EmissT , `) denotes the angle between~pTmiss and thep~Tof the lepton, andJ1 denotes the highestpTjet.
The compressed signal regions are designed to select events with a high-pT jet from ISR, which is needed to provide the necessary boost to the system to obtain large ETmiss and largeMT. Thus, we require at least five jets in the event, with the highestpTjet failing the medium WP of the b tagging algorithm. Additionally, we reject events if the selected lepton haspT >150 GeV as we expect the lepton to be soft in the compressed region. We also require the angle between the lepton direction and ~pTmiss in the azimuthal plane to be
<2. This is because the ISR selection results in boosted top squarks with decay products typically close to each other. Finally, we relax the min ∆φ(J1,2, ETmiss) requirement in the preselection from 0.8 to 0.5 to increase the signal acceptance. The selection requirements for the compressed signal regions are summarized in table 3.
6 Background estimation
Three categories of background from SM processes remain after the selection requirements described in sections 4and 5.
• Lost-lepton background: events with two leptonically decaying W bosons in which one of the leptons is not reconstructed or identified. This background arises primarily from tt events, with a smaller contribution from single-top quark processes. It is the dominant background in the M`b < 175 GeV and NJ ≥ 4 search regions, and is estimated using a dilepton control sample.
JHEP10(2017)019
• One-lepton background: events with a single leptonically decaying W boson and no additional source of genuine ETmiss. This background is strongly suppressed by the preselection requirements ofETmiss >250 GeV and MT >150 GeV.
The suppression is much more effective for events with a W boson originating from the decay of a top quark than for direct W boson production (W+jets), as the mass of the top quark imposes a bound on the mass of the charged lepton-neutrino system.
As a result, the tail of the MT distribution in tt→ 1`events is dominated by ETmiss resolution effects, while in W+jets it extends further and is largely driven by the width of the W boson.
The W+jets background estimate is obtained from a control sample of events with no b-tagged jets. The subleading tt → 1` background is modeled from simulation.
One-lepton events are the dominant background in theM`b ≥175 GeV search regions.
• Z → νν¯ background: events with exactly one leptonically decaying W boson and a Z boson that decays to a pair of neutrinos, e.g., ttZ or WZ. This background is estimated from simulation, after normalizing the simulated event yield to the observed data counts in a control region obtained by selecting events with three leptons, two of which must be consistent with the Z decay hypothesis.
These three types of backgrounds are discussed below. More details about the validity of the background estimation methods for the two first categories can be found in ref. [16].
6.1 Lost-lepton background
The lost-lepton background is estimated from a dilepton control sample obtained with the same selection requirements as the signal sample, except for requiring the presence of a second isolated lepton with pT >10 GeV. For each signal region, a corresponding control region is constructed, with an exception as noted below. In defining the control regions, the p~T of the second lepton is added to the ~pTmiss and all relevant event quantities are recalculated. The estimated background in each search region is then obtained from the yield of data events in the control region and a transfer factor defined as the ratio of the expected SM event yields in the signal and control regions, as determined from simulation.
Corrections obtained from studies of Z/γ? → `` events are applied to account for small differences in lepton reconstruction and selection efficiencies between data and simulation.
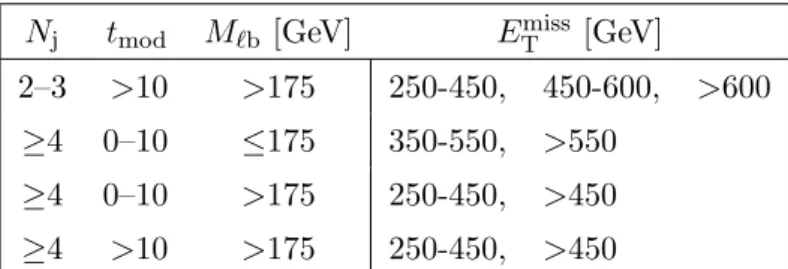
Due to a lack of statistics, the two or three highest ETmiss bins of table 2 are com- bined resulting in the list of control regions listed in table 4, and the simulation, after the correction described below, is used to determine the expected distribution of SM events as a function of ETmiss. The correction is based on a study of the EmissT distribution in a top quark enriched control region of eµevents with at least one b-tagged jet, as shown in figure 2. The ratio of data to simulation yields as a function of ETmiss in the eµ sample is taken as a bin-by-bin correction for the expectedETmiss distribution in the simulation of tt and tW events with a lost lepton. The uncertainty in each bin is taken to be one half the deviation from unity.
JHEP10(2017)019
Nj tmod M`b [GeV] EmissT [GeV]
2–3 >10 >175 250-450, 450-600, >600
≥4 0–10 ≤175 350-550, >550
≥4 0–10 >175 250-450, >450
≥4 >10 >175 250-450, >450
Table 4. Dilepton control regions utilizing combined bins inETmiss.
0 0.5 1 1.5 2
Data/MC
[GeV]
miss
ET
100 200 300 400 500 600 700 800
Events / bin
1 10 102
103
104
105 Data
2l t→ t
1l t→ t Single t W+jets
ν ν Z→
(13 TeV) 35.9 fb-1
CMS
Figure 2. Distributions inETmissfor a top quark enriched control region of eµevents with at least one b-tagged jet. The ratio of data to simulation as a function of ETmissis also shown. It is taken as a correction of theETmiss distribution in simulation of tt and tW events with a lost lepton.
The dominant uncertainties on the transfer factors arise from the statistical uncer- tainties in the simulated samples and the uncertainties in the lepton efficiency. These range from 5–100% and 5–15%, respectively. The uncertainties on the lepton efficiency are derived from studies of samples of leptonically-decaying Z bosons. For the regions of table 4, there are also uncertainties associated with the ETmiss distribution. These are also dominated by the statistical precision of the simulated samples, and range between 10 and 100%. Uncertainties due to the jet energy scale and the b tagging efficiency are evaluated
JHEP10(2017)019
by varying the correction factors for simulation by their uncertainties, and the uncertainties due to the choices of renormalization and factorization scale used in the generation of SM samples are assessed by varying the scales by a factor of 2. All these uncertainties are found to be small. The resulting systematic uncertainties on the transfer factors are 10–100%, depending on the region. These are generally smaller than the statistical uncertainties from the data yield in the corresponding control regions that are used, in conjunction with the transfer factors, to predict the SM background in the signal regions.
6.2 One-lepton background
As discussed previously, the one-lepton background receives contributions from processes where the leptonically decaying W boson is produced directly or from the decay of a top quark. The background from direct W boson production is estimated in each search region using a control region obtained with the same selection as the signal region except that the b tagging requirement is inverted to enrich the sample in W+jets events. The estimate in each search region is then obtained using a transfer factor determined from simulated samples that accounts for the b quark jet acceptance and tagging efficiency. The estimate is corrected for small differences in the performance of the b tagging algorithm between data and simulation.
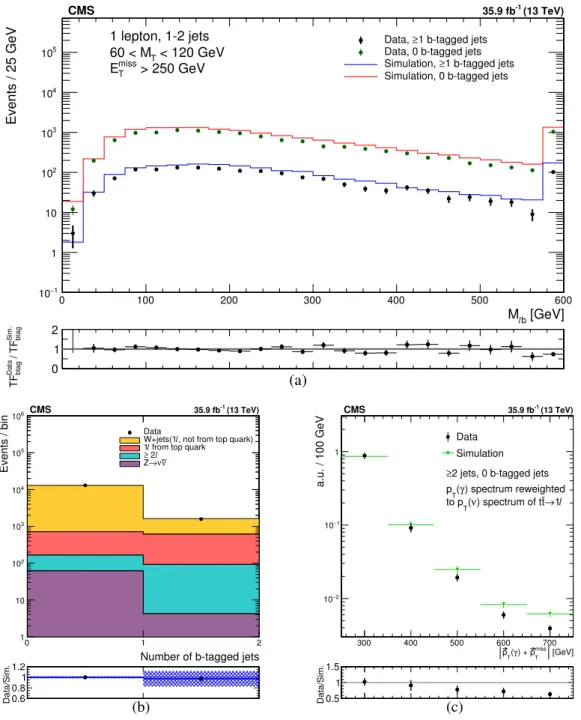
In the control sample, the M`b variable is constructed using the selected lepton and the jet in the event with the highest value of the b-tag discriminator. The M`bdistribution is validated in a control sample enriched in the W+jets events, obtained by selecting events with 1 or 2 jets, 60 < MT < 120 GeV, ETmiss > 250 GeV, and either 0 or ≥1 jet passing the medium WP of the b tagging algorithm. Figure 3(a) shows the M`b distribution in both data and simulation for the control samples with 0 and≥1 b-tagged jets. The bottom panel shows the good agreement between data and simulation in the extrapolation factor from the 0 b-tagged jets sample to the sample with ≥1 b-tagged jets.
The largest uncertainty in the transfer factor comes from the limited event counts of the simulated samples, followed by the uncertainty on the heavy-flavor fraction of jets in W+jets events. A comparison of the multiplicity of b-tagged jets between data and simulation is performed in a W+jets enriched region obtained with the same selection as for theM`b distribution, as shown in figure3(b). The difference between data and simulation is covered by a 50% uncertainty on the heavy-flavor component of W+jets events, and is indicated by the shaded band in the figure. Variations of the jet energy scale and b tagging efficiency within their measured uncertainties each result in a 10% uncertainty in the background estimate. The total uncertainty in the estimate of the W+jets background varies from 20 to 80%, depending on signal region.
Simulation studies indicate that in all signal regions the contribution from tt → 1`
events is expected to be smaller than 10% of the total background. This estimate is sensitive to the correct modeling of theETmissresolution, since this affects theMT tail. The modeling of the ETmiss resolution is studied using data and simulated samples of γ+jets events. The photon pT spectrum is reweighted to match that of the neutrino in simulated tt→1`events after first re-weighting the photonpT spectrum in simulation to match that observed in data. We then add the photon p~T to the EmissT , and compare the resulting
JHEP10(2017)019
0 1 2
(a)
btagSim. TF/btagData TF
[GeV]
b
Ml
0 100 200 300 400 500 600
Events / 25 GeV
1
10−
1 10 102
103
104
105
1 b-tagged jets Data, ≥
Data, 0 b-tagged jets 1 b-tagged jets Simulation, ≥
Simulation, 0 b-tagged jets
(13 TeV) 35.9 fb-1
CMS
< 120 GeV 60 < MT
1 lepton, 1-2 jets > 250 GeV
miss
ET
0.6 0.8 1 1.2
Data/Sim.
(b)
Number of b-tagged jets
0 1 2
Events / bin
1 10 102
103
104
105
106
Data
, not from top quark) W+jets(1l
from top quark 1l
2l
≥ ν ν Z→
(13 TeV) 35.9 fb-1
CMS
[GeV]
miss
pT
) + (γ pT
300 400 500 600 700
a.u. / 100 GeV
2
10− 1
10−
1
Data Simulation
(13 TeV) 35.9 fb-1
CMS
2 jets, 0 b-tagged jets
≥
) spectrum reweighted (γ
pT
1l t→ ) spectrum of t (ν
to pT
0.5 1 1.5
Data/Sim.
(c)
Figure 3. Comparison of the modeling of kinematic distributions in data and simulation relevant for the estimate of the single lepton backgrounds. (a) Distribution in M`bin a control sample with 1 or 2 jets, with 60< MT<120 GeV andETmiss>250 GeV. The distribution is shown separately for events with 0 and ≥1 jet passing the requirement of the medium b tagging WP. The lower panel shows the ratio of the transfer factors (TF) from the 0 b-tagged jets to the ≥1 b-tagged jets samples, in data and simulation. The uncertainty shown is statistical only. (b) Distribution in the number of b-tagged jets in the same control sample. The shaded band shows the uncertainty resulting from a 50% systematic uncertainty in the heavy flavor component of the W+jets sample.
(c) Comparison of theETmissdistribution between data and simulation in theγ+jets control region.
The uncertainty shown is statistical only. The ratio between data and simulation shown on the lower panel is used to correct the simulation for itsETmiss resolution.
JHEP10(2017)019
spectra. Differences of up to 40% in the ETmiss shape between data and simulated events are observed, as shown in figure 3(c) for a selection with at least 2 jets. Corrections for these differences are applied to the tt→1`simulation and a resulting 100% uncertainty is assigned to the estimate of this background.
6.3 Background from events containing Z→νν¯ decays
The third and last category of background arises from ttZ, WZ, and other rare multiboson processes, all with a leptonically decaying W boson and one or more Z bosons decaying to neutrinos. Within this category, the contribution from WZ events is dominant in the low-NJ
bins, whereas in events with higherNJ, 60–80% of this background is due to ttZ processes.
The background from these processes is estimated from simulation with normalization obtained from a data control sample containing three leptons. For this sample, two leptons must form an opposite charge, same flavor pair having an invariant mass between 76 and 106 GeV. The normalization of the WZ and ttZ processes is determined by performing a template fit to the distribution of the number of b-tagged jets in this sample. The result of this fit yield scale factors of 1.21±0.11 and 1.14±0.30 to be applied to the simulated samples of WZ and ttZ events, respectively.
We also assess all relevant theoretical and experimental uncertainties that can affect the shapes of the kinematic distributions of our signal region definitions by recomputing acceptances after modifying the various kinematical quantities and reconstruction efficien- cies within their respective uncertainties. The experimental uncertainties are obtained by variations of the simulation correction factors within their measured uncertainties. The largest contributions are due to the uncertainties in the jet energy scale and to the choices of the renormalization and factorization scales used in the MC generation of SM samples.
The latter is obtained by varying the scales by a factor of 2. Other uncertainties are due to the lepton and b tagging efficiencies, the modeling of additional jets in the parton shower, pileup, the value of the strong coupling constant αS, and the PDF sets. The uncertainty on the PDF sets is evaluated by using replicas of the NNPDF3.0 set [25].
The total uncertainty in the Z → νν¯ background is 17–78%, depending on the search region.
7 Results and interpretation
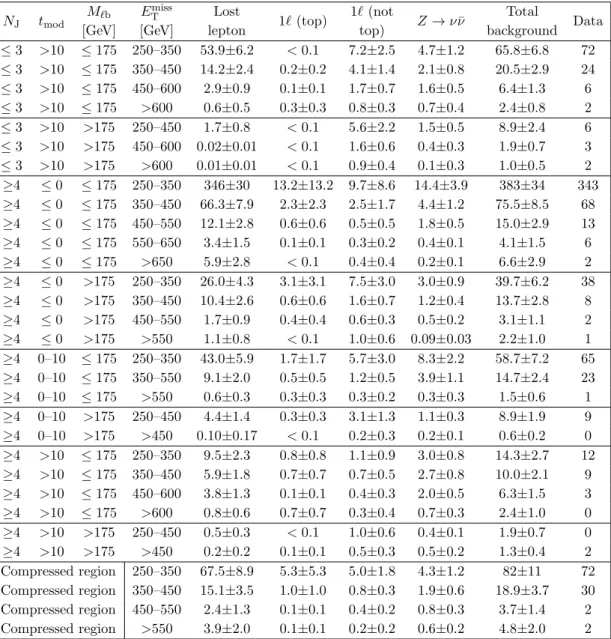
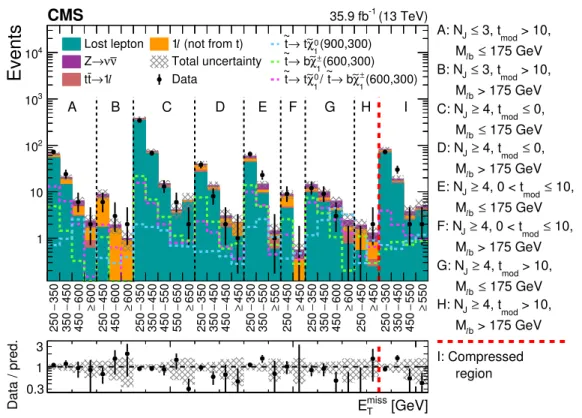
The event yields in data in the 31 search regions defined in tables 2and 3are statistically compatible with the estimated backgrounds from SM processes. They are summarized in table5and figure4and are interpreted in the context of the simplified models of top squark pair production described in section 1. Further information on the experimental results to facilitate reinterpretations for beyond the SM models not considered here is given in appendix A.
For a given model, limits on the production cross-section are derived as a function of the masses of the SUSY particles by combining search regions using a modified frequentist approach, employing the CLs criterion in an asymptotic formulation [44–47]. These limits are turned into exclusion regions in the m(et)−m(χe01) plane using the calculation of the
JHEP10(2017)019
NJ tmod
M`b ETmiss Lost
1`(top) 1`(not
Z→νν¯ Total
[GeV] [GeV] lepton top) background Data
≤3 >10 ≤175 250–350 53.9±6.2 <0.1 7.2±2.5 4.7±1.2 65.8±6.8 72
≤3 >10 ≤175 350–450 14.2±2.4 0.2±0.2 4.1±1.4 2.1±0.8 20.5±2.9 24
≤3 >10 ≤175 450–600 2.9±0.9 0.1±0.1 1.7±0.7 1.6±0.5 6.4±1.3 6
≤3 >10 ≤175 >600 0.6±0.5 0.3±0.3 0.8±0.3 0.7±0.4 2.4±0.8 2
≤3 >10 >175 250–450 1.7±0.8 <0.1 5.6±2.2 1.5±0.5 8.9±2.4 6
≤3 >10 >175 450–600 0.02±0.01 <0.1 1.6±0.6 0.4±0.3 1.9±0.7 3
≤3 >10 >175 >600 0.01±0.01 <0.1 0.9±0.4 0.1±0.3 1.0±0.5 2
≥4 ≤0 ≤175 250–350 346±30 13.2±13.2 9.7±8.6 14.4±3.9 383±34 343
≥4 ≤0 ≤175 350–450 66.3±7.9 2.3±2.3 2.5±1.7 4.4±1.2 75.5±8.5 68
≥4 ≤0 ≤175 450–550 12.1±2.8 0.6±0.6 0.5±0.5 1.8±0.5 15.0±2.9 13
≥4 ≤0 ≤175 550–650 3.4±1.5 0.1±0.1 0.3±0.2 0.4±0.1 4.1±1.5 6
≥4 ≤0 ≤175 >650 5.9±2.8 <0.1 0.4±0.4 0.2±0.1 6.6±2.9 2
≥4 ≤0 >175 250–350 26.0±4.3 3.1±3.1 7.5±3.0 3.0±0.9 39.7±6.2 38
≥4 ≤0 >175 350–450 10.4±2.6 0.6±0.6 1.6±0.7 1.2±0.4 13.7±2.8 8
≥4 ≤0 >175 450–550 1.7±0.9 0.4±0.4 0.6±0.3 0.5±0.2 3.1±1.1 2
≥4 ≤0 >175 >550 1.1±0.8 <0.1 1.0±0.6 0.09±0.03 2.2±1.0 1
≥4 0–10 ≤175 250–350 43.0±5.9 1.7±1.7 5.7±3.0 8.3±2.2 58.7±7.2 65
≥4 0–10 ≤175 350–550 9.1±2.0 0.5±0.5 1.2±0.5 3.9±1.1 14.7±2.4 23
≥4 0–10 ≤175 >550 0.6±0.3 0.3±0.3 0.3±0.2 0.3±0.3 1.5±0.6 1
≥4 0–10 >175 250–450 4.4±1.4 0.3±0.3 3.1±1.3 1.1±0.3 8.9±1.9 9
≥4 0–10 >175 >450 0.10±0.17 <0.1 0.2±0.3 0.2±0.1 0.6±0.2 0
≥4 >10 ≤175 250–350 9.5±2.3 0.8±0.8 1.1±0.9 3.0±0.8 14.3±2.7 12
≥4 >10 ≤175 350–450 5.9±1.8 0.7±0.7 0.7±0.5 2.7±0.8 10.0±2.1 9
≥4 >10 ≤175 450–600 3.8±1.3 0.1±0.1 0.4±0.3 2.0±0.5 6.3±1.5 3
≥4 >10 ≤175 >600 0.8±0.6 0.7±0.7 0.3±0.4 0.7±0.3 2.4±1.0 0
≥4 >10 >175 250–450 0.5±0.3 <0.1 1.0±0.6 0.4±0.1 1.9±0.7 0
≥4 >10 >175 >450 0.2±0.2 0.1±0.1 0.5±0.3 0.5±0.2 1.3±0.4 2
Compressed region 250–350 67.5±8.9 5.3±5.3 5.0±1.8 4.3±1.2 82±11 72 Compressed region 350–450 15.1±3.5 1.0±1.0 0.8±0.3 1.9±0.6 18.9±3.7 30 Compressed region 450–550 2.4±1.3 0.1±0.1 0.4±0.2 0.8±0.3 3.7±1.4 2 Compressed region >550 3.9±2.0 0.1±0.1 0.2±0.2 0.6±0.2 4.8±2.0 2
Table 5. Result of the background estimates and data yields corresponding to 35.9 fb−1 , for the 31 signal regions of tables2 and3.
cross-section from reference [48] and are shown on figures5,6, and 7. Limits are obtained by combining the 27 regions from the standard selection defined in table 2, except for the model of figure 1(a) in the compressed region 100≤∆m et,χe01
≤225 GeV, where we use the four compressed search regions listed in table3. This approach improves the expected cross section upper limit in the compressed mass region by∼15–30%. When computing the limits, the expected signal yields are corrected for possible contamination of SUSY events in the data control regions. These corrections are typically around 5–10%.
A summary of the uncertainties in the signal efficiency is shown in table 6. They are evaluated in the same manner as done in the background estimation methods, described in section6. The largest uncertainties are due to the limited size of the simulated signal sam-
JHEP10(2017)019
350−250 450−350 600−450 600≥ 450−250 600−450 600≥ 350−250 450−350 550−450 650−550 650≥ 350−250 450−350 450−450 450≥ 350−250 550−350 550≥ 450−250 450≥ 350−250 450−350 600−450 600≥ 450−250 450≥ 350−250 450−350 550−450 550≥
Events
1 10 102
103
104 Lost lepton 1l (not from t) ν
ν
Z→ Total uncertainty 1l
t→
t Data
(900,300) χ1
t∼ t→
~
(600,300) χ1
b∼ t→
~
(600,300) χ1
b∼ t→ / ~ χ1
t∼ t→
~
A B C D E F G H I
0 ±
± 0
(13 TeV) 35.9 fb-1
CMS
[GeV]
miss
ET
Data / pred.
1 3
0.3
175 GeV
b≤ Ml
> 10, 3, tmod
J≤ A: N
> 175 GeV
b
Ml
> 10, 3, tmod
J≤ B: N
175 GeV
b≤ Ml
0,
mod≤ 4, t
J≥ C: N
> 175 GeV
b
Ml
0,
mod≤ 4, t
J≥ D: N
175 GeV
b≤ Ml
10,
mod≤ 4, 0 < t
J≥ E: N
> 175 GeV
b
Ml
10,
mod≤ 4, 0 < t
J≥ F: N
175 GeV
b≤ Ml
> 10, 4, tmod
J≥ G: N
> 175 GeV
b
Ml
> 10, 4, tmod
J≥ H: N
region I: Compressed
Figure 4. Observed data yields compared with the SM background estimations for the 31 signal regions of tables 2 and 3. The total uncertainty in the background estimate, determined as the sum in quadrature of statistical and systematic uncertainties, is shown as a shaded band. The expectations for three signal hypotheses are overlaid. The corresponding numbers in parentheses in the legend refer to the masses in GeV of the top squark and the neutralino.
ples, the b tagging efficiency, and the jet energy scale. For model points with a small mass splitting, the ISR uncertainty described in section 3 is also significant. Since new physics signals are simulated using the CMS fast simulation program, additional uncertainties are assigned to the correction of the lepton and b tagging efficiencies, as well as to cover differ- ences inETmiss resolution between the fast simulation and the full Geant4-based model of the CMS detector. The latter uncertainty is small in the bulk of the model space, but may reach up to 25% in scenarios with a compressed mass spectrum. Uncertainties due to the integrated luminosity, ISR modeling,ETmissresolution, and b tagging and lepton efficiencies are treated as fully correlated across search regions.
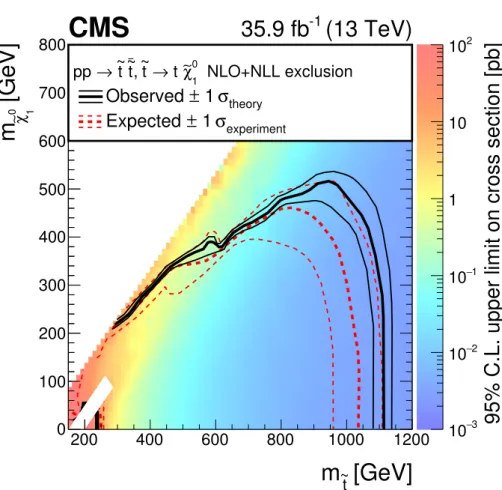
Figure 5 shows the 95% confidence level (CL) upper limit on pp → etet → tχe01 tχe01, assuming unpolarized top quarks in the decay chain, together with the upper limit at 95% CL on the signal cross section. We exclude top squark masses up to 1120 GeV for a massless LSP and LSP masses up to 515 GeV for a 950 GeV top squark mass. The white band corresponds to the region |m
et−mt−m
χe01| < 25 GeV, m
et < 275 GeV where the selection efficiency of top squark events changes rapidly and becomes very sensitive to details of the model and the simulation. No cross section limit is established in that region.
Figure 6shows the 95% CL upper limit for pp→etet→bbχe±1χe±1,χe±1 →Wχe01, together with the upper limit at 95% CL on the excluded signal cross section. The mass of the
JHEP10(2017)019
Source Typical range of values [%]
Simulation statistical uncertainty 5–25 Renormalization and factorization scales 2–4
Integrated luminosity 2.5
Trigger 2–4
b tagging scale factors 1–7
Jet energy scale 1–20
Lepton identification and veto efficiency 1–4
ISR modeling 2–15
ETmiss modeling 1–10
Total uncertainty 7–38
Table 6. Summary of the systematic uncertainties in the signal efficiency.
[GeV]
~t
m
200 400 600 800 1000 1200
[GeV]
0 1χ∼m
0 100 200 300 400 500 600 700 800
3
10− 2
10− 1
10−
1 10 102
(13 TeV) 35.9 fb
-1CMS
NLO+NLL exclusion
1
χ0
t ∼ t→ , ~
~t
~t pp →
theory
1 σ Observed ±
experiment
1 σ Expected ±
95% C.L. upper limit on cross section [pb]
Figure 5. The exclusion limits at 95% CL for direct top squark pair production with decay etet→tχe01 tχe01. The interpretation is done in the two-dimensional space of met vs. m
χe01. The color indicates the 95% CL upper limit on the cross section times branching fraction at each point in the metvs. mχe01 plane. The area below the thick black curve represents the observed exclusion region at 95% CL assuming 100% branching fraction, while the dashed red lines indicate the expected limits at 95% CL and their±1σexperimental standard deviation uncertainties. The thin black lines show the effect of the theoretical uncertainties (σtheory) in the signal cross section. The whited out region is discussed in section7.
JHEP10(2017)019
[GeV]
~t
m
200 400 600 800 1000 1200
[GeV]
0 1χ∼m
0 100 200 300 400 500 600 700 800
3
10− 2
10− 1
10−
1 10 102
(13 TeV) 35.9 fb
-1CMS
1
χ0
∼ b W± 1→ χ±
b ∼ t→ , ~
~t
~t pp →
NLO+NLL exclusion
theory
1 σ Observed ±
experiment
1 σ Expected ±
)/2
0 1
χ∼
+ m
~t
= (m
± 1
χ∼
m
95% C.L. upper limit on cross section [pb]
Figure 6. The exclusion limit at 95% CL for direct top squark pair production with decayetet→ bχe+1bχe−1,χe±1 →W±χe01. The mass of the chargino is chosen to be (met+m
χe01)/2. The interpretation is done in the two-dimensional space ofmetvs. m
χe01. The color indicates the 95% CL upper limit on the cross section times branching fraction at each point in the m
et vs. m
χe01 plane. The area between the thick black curves represents the observed exclusion region at 95% CL assuming 100%
branching fraction, while the dashed red lines indicate the expected limits at 95% CL and their
±1σ experimental standard deviation uncertainties. The thin black lines show the effect of the theoretical uncertainties (σtheory) in the signal cross section.
chargino is chosen to be (m
et+m
χe01)/2. We exclude top squark masses up to 1000 GeV for a massless LSP and LSP masses up to 450 GeV for a 800 GeV top squark mass.
Figure7shows the 95% CL upper limit for pp →etet→tbχe±1χe01,χe±1 →W∗χe01, together with the upper limit at 95% CL on the excluded signal cross section. The mass splitting of the chargino and neutralino is fixed to 5 GeV. We exclude top squark masses up to 980 GeV for a massless LSP and LSP masses up to 400 GeV for a 825 GeV top squark mass.
8 Summary
We have reported on a search for top squark pair production in pp collisions at √ s = 13 TeV in events with a single isolated electron or muon, jets, and large missing transverse momentum using data collected with the CMS detector during the 2016 run of the LHC,
JHEP10(2017)019
[GeV]
~t
m
200 400 600 800 1000 1200
[GeV]
0 1χ∼m
0 100 200 300 400 500 600 700 800
3
10− 2
10− 1
10−
1 10 102
(13 TeV) 35.9 fb
-1CMS
1
χ0
t ∼ t→ or ~
1
χ0
∼ b W± 1 → χ±
b ∼ t→ , ~
~t
~t pp →
NLO+NLL exclusion
theory
1 σ Observed ±
experiment
1 σ Expected ±
= 5 GeV
0
χ1
-m∼
± 1
χ∼
m
) = 50%
1
χ0
t ∼ t→ BR(~
95% C.L. upper limit on cross section [pb]
Figure 7. The exclusion limit at 95% CL for direct top squark pair production with decayetet→ bχe+1tχe01, χe±1 →W±χe01. The mass splitting of the chargino and neutralino is fixed to 5 GeV. The interpretation is done in the two-dimensional space ofmetvs. m
χe01. The color indicates the 95% CL upper limit on the cross section at each point in them
etvs. m
χe01 plane. The area between the thick black curves represents the observed exclusion region at 95% CL, while the dashed red lines indicate the expected limits at 95% CL and their ±1σexperimental standard deviation uncertainties. The thin black lines show the effect of the theoretical uncertainties (σtheory) in the signal cross section.
corresponding to an integrated luminosity of 35.9 fb−1. The event data yields are consistent with the expectations from SM processes. The results are interpreted as exclusion limits in the context of supersymmetric models with pair production of top squarks that decay either to a top quark and a neutralino or to a bottom quark and a chargino. Assuming both top squarks decay to a top quark and a neutralino, we exclude at 95% CL top squark masses up to 1120 GeV for a massless neutralino and neutralino masses up to 515 GeV for a 950 GeV top squark mass. For a scenario where both top squarks decay to a bottom quark and a chargino, with the chargino mass the average of the masses of the neutralino and top squark, we exclude at the 95% CL top squark masses up to 1000 GeV for a massless neutralino and neutralino masses up to 450 GeV for a 800 GeV top squark mass. For the mixed decay scenario, with the mass splitting between the chargino and neutralino fixed to be 5 GeV, we exclude at the 95% CL top squark masses up to 980 GeV for a massless neutralino and neutralino masses up to 400 GeV for a 825 GeV top squark mass.
JHEP10(2017)019
Acknowledgments
We congratulate our colleagues in the CERN accelerator departments for the excellent performance of the LHC and thank the technical and administrative staffs at CERN and at other CMS institutes for their contributions to the success of the CMS effort. In ad- dition, we gratefully acknowledge the computing centres and personnel of the Worldwide LHC Computing Grid for delivering so effectively the computing infrastructure essential to our analyses. Finally, we acknowledge the enduring support for the construction and operation of the LHC and the CMS detector provided by the following funding agencies:
BMWFW and FWF (Austria); FNRS and FWO (Belgium); CNPq, CAPES, FAPERJ, and FAPESP (Brazil); MES (Bulgaria); CERN; CAS, MoST, and NSFC (China); COL- CIENCIAS (Colombia); MSES and CSF (Croatia); RPF (Cyprus); SENESCYT (Ecuador);
MoER, ERC IUT, and ERDF (Estonia); Academy of Finland, MEC, and HIP (Finland);
CEA and CNRS/IN2P3 (France); BMBF, DFG, and HGF (Germany); GSRT (Greece);
OTKA and NIH (Hungary); DAE and DST (India); IPM (Iran); SFI (Ireland); INFN (Italy); MSIP and NRF (Republic of Korea); LAS (Lithuania); MOE and UM (Malaysia);
BUAP, CINVESTAV, CONACYT, LNS, SEP, and UASLP-FAI (Mexico); MBIE (New Zealand); PAEC (Pakistan); MSHE and NSC (Poland); FCT (Portugal); JINR (Dubna);
MON, RosAtom, RAS, RFBR and RAEP (Russia); MESTD (Serbia); SEIDI, CPAN, PCTI and FEDER (Spain); Swiss Funding Agencies (Switzerland); MST (T