*M.S. in International Agricultural Technology, Seoul National University
**Associate Professor, Graduate School of International Agricultural Technology, Institute of Green Bio Science and Technology, Seoul National University, corresponding author, e-mail: [email protected]
Period of Review: March 20, 2023 - June 20, 2023
The Effect of Agricultural Production Diversification on Dietary Diversity:
A Case Study of Cambodia
YUN Chanmi*, KIM Taeyoon**
Keywords
Dietary diversity, Farm production diversification, Hidden hunger, Cambodia
Abstract
Dietary diversity is often emphasized as the primary way to treat micro-nutrition deficiencies, called hidden hunger. Farm production diversification can positively affect the diversity of household diets.
This study uses cross-sectional data from the Cambodia Socio-Economic Survey to find the impacts of farm production diversification on household dietary diversity. The Food Consumption Score is measured as an indicator of dietary diversity, and the Simpson Index is calculated as an indicator of production diversification. The results show that farm production diversification positively affects dietary diversity by about 1.385 (0.13 Standard Deviations) on average, especially for farmers who have cultivated 1-2 ha of land by 3.193 (0.29 SDs). Besides, production diversification in the plain zone, where the average income is higher than in other regions, significantly affects dietary diversity. In addition, total expenditure is positively associated with dietary diversity. Furthermore, market accessibility and the percentage of food purchased significantly impact a diverse diet by 8.34 (0.75 SDs) and 6.97 (0.63 SDs), respectively. Overall results indicate that policies related to providing access to the market, enabling households to purchase food in rural areas, and agricultural production diversification are meaningful in enhancing household dietary diversity in rural Cambodia.
Table of Contents
1. Introduction ···47
2. Conceptual Framework and Cambodia’s Agriculture and Nutrition ···49
3. Data and Procedure ···53
4. Results ···58
5. Conclusion ···64 Journal of Rural Development 46(2): 45-70 (June 2023) http://dx.doi.org/10.36464/jrd.2023.46.2.003
* 서울대학교 대학원 국제농업기술학 석사
** 서울대학교 국제농업기술대학원/그린바이오과학기술연구원, 교신저자. e-mail: [email protected]
농업생산 다각화가
식품소비 다양성에 미치는 효과 분석:
캄보디아 사례를 중심으로
윤찬미*, 김태윤**
Keywords
소비다양성, 생산다각화, 숨겨진 배고픔, 캄보디아
Abstract
식품소비 다양화는 영양결핍(소위, 숨겨진 배고픔)을 해소하는 유력한 방안 중 하나이며, 농업생산 다각화는 소비다양화에 긍정적인 영향을 미칠 수 있다. 이 연구는 2014년 캄보디아 사회경제조사의 약 6,000여개 농가 미시자료를 이용하여 농업생산의 다각화가 식품소비의 다양성에 미치는 영향을 측정하였다. 식품소비 다양성은 식품소비점수(FCS, 0~112)로 측정하였으며, 농업생산 다각화는 심슨지수(SI, 0~1)를 이용하였다. 연구결과 농업생산 다각화는 평균적으로 식품소비 다양성을 1.385 (0.13 표준편차) 정도 높이는 것으로 나타났고, 특히 1-2ha 규모의 농가에서는 3.193(0.29 표준편차) 정도 높이는 것으로 나타났다. 또한 농업소득이 상대적으로 높은 평야지대의 주민들이 다른 지역에 비하여 생산다각화가 소비다양성에 더 큰 영향을 미치는 것으로 나타났다.
전반적으로 식품지출액이 클수록, 시장에 대한 접근성이 높을수록, 식품구매비율이 높을수록 식품소비 다양성이 높은 것으로 나타났다. 이에 따라 캄보디아의 농업과 영양부문의 지속가능한 발전을 위하여 농촌시장에 대한 접근성 제고, 농촌지역에서 농가의 식품구매력 증대, 농업생산 작목의 다각화에 대한 정책적 지원으로 식품소비 다양성을 증가시킴으로써 영양결핍을 감소시킬 것을 제안한다.
1. Introduction
Hunger and malnutrition are critical problems in developing countries. More than 820 million people still suffer from hunger due to nutritional deficiencies (FAO et al., 2019).
Around the world, more than 2 billion people are also affected by micro-nutrition deficiencies, so-called hidden hunger caused by poor diet (FAO et al., 2014). Diets focused mainly on staple crops, which provide a large share of energy but relatively low amounts of essential vitamins and minerals, frequently lead to hidden hunger (Grebmer et al., 2014).
Over the years, many researchers have focused on increasing the productivity of major crops to reduce malnutrition. The intensified production of high-yielding cereal varieties during the Green Revolution in the 1950s led to increased cereals production, which decreased the number of hungry people. Still, the increasing reliance on cereals has induced to have difficulty in fulfilling human micronutrient needs (Frison, 2006;
Demment et al., 2003).
Dietary diversity is defined by the number of food or food groups consumed during a specific reference period (Ruel, 2003). Therefore, enhancing it is one of the most effective ways to prevent hidden hunger (Thompson & Amoroso, 2011). Furthermore, in the long term, it ensures a healthy diet, which includes a balanced and appropriate combination of macronutrients (carbohydrates, fats, and protein) and other food-based substances such as dietary fiber. Thus, it is a valuable indicator of nutrition security (Hughes & Keatinge, 2012).
Many studies identify the positive effect of agricultural diversification on dietary diversity (Adjimoti and Kwadzo, 2018; Bellon, 2016; Jones, 2017; Jones et al., 2014;
Pellegrini and Tasciotti, 2014; Snapp and Fisher, 2015; Chegere and Stage, 2020; Mango et al., 2018). According to Adjimoti and Kwadzo (2018), remote rural areas, where food access is largely dependent on food production, can benefit from crop diversification by offering different crops they may not access due to cost or infrastructure constraints.
Moreover, Chegere and Stage (2020) found that production diversification, education, and overall income significantly increase a household's dietary diversity. Jones et al.
(2014) find that various production contributes to diverse household diets, affected by gender, wealth, household decision, and market orientation of agricultural production. In
addition, Herforth (2010) investigated the relationship between farm diversification and dietary diversity in central Kenya and northern Tanzania. In both countries, agricultural production diversification was positively related to the dietary diversity of the household.
However, some studies have concluded that the effects of agricultural production diversification are different. For example, Rajendran et al. (2017) find that production diversity does not influence dietary diversity, whereas monthly food expenditure positively influences dietary diversity, which indicates that farm households spending more on market-purchased food consistently increase their dietary diversity. Similarly, Sibhatu et al. (2015) find that production diversification positively impacts dietary diversity under certain conditions. However, when production diversification is already high, the impact of dietary diversity on production diversification is not significant and even turns negative.
It is estimated that 2.3 million Cambodians (14.6 percent) suffer severe food insecurity and poor dietary quality, with households spending more than 70 percent of their income on food (FAO, 2014). They produce enough food to meet the average caloric needs of the population, but access to food is unevenly distributed. Regarding public policies, the focus is still on the quantity of food supply rather than investments to improve nutritional security, such as improving diet quality and access to sanitation (FAO, 2022; te Lintelo et al., 2014).
From 2008 to 2012, the Cambodian government implemented a food security and strategic nutrition framework. This framework's long-term objective was to substantially improve Cambodians’ physical and economic access to sufficient, safe, and nutritious food to meet their dietary needs and food preferences for an active and healthy life (Culas and Tek, 2016).
In developing countries, increasing dietary diversity has an important impact on nutrition and health. Dietary diversity is defined as the number of different foods or food groups consumed during a specific reference period (Ruel, 2003). In the long term, it can help maintain a healthy diet that includes a balanced and appropriate combination of macronutrients, such as carbohydrates, fats, and proteins, and other food-based substances, such as dietary fiber. In addition, it can be a useful indicator of nutrition security (Hughes and Keatinge, 2012). Thus, dietary diversity is essential for improving nutrition and health in developing countries, suggesting that diversified production
systems enhance the poor's access to different types of food (Pingali, 2015).
However, there are still debates on the relationship between agricultural production diversification and dietary diversity, especially for subsistence farmers. On the one hand, farm production diversification positively affects dietary diversity and nutrition for subsistence farmers (Malapit et al., 2015). On the other hand, improved market accessibility and specialization of agricultural production are more effective in improving dietary diversity, even among subsistence farmers (Sibhatu et al., 2015).
This study aims to measure the effect of farm production diversification on household dietary diversity using data from the Cambodia Socio-Economic Survey (CSES) conducted in 2014. The hypotheses corresponding to the research purpose were: 1) farm production diversification positively affects household diet diversity and 2) the effect of farm production diversification on dietary diversity varies depending on the farm size and the ecological zone.
This research contributes to agricultural development and nutritional policies in Cambodia, where most people live in rural areas engaged in small-scale agriculture, and rice production dominates its farming system. This paper is organized as follows: The upcoming section provides the conceptual framework for the relationship between agriculture and nutrition, as well as the production diversification and dietary diversity in Cambodia. Section 3 introduces the data and procedure for this research covering the indexes for production diversification and dietary diversity, summary statistics of CSES, and empirical procedure of the village-fixed effect model. Section 4 provides the estimation results, and the next section concludes the main findings of this paper.
2. Conceptual Framework and Cambodia’s Agriculture and Nutrition
2.1. Conceptual Framework on Farm Diversification and Dietary Diversity
Agricultural livelihoods are closely related to nutrition with individual members in various ways. In general, nutrition can be fulfilled from three main routes at the household level: 1) food production, 2) agricultural income, and 3) women’s empowerment
(Herforth and Harris, 2014). Overall environments acting on these channels include the natural resource environment, food market environment, health environment, nutrition/health knowledge, and norms. Child nutrition resulting from agricultural production practices ultimately affects national economic growth, eventually enhancing household assets and livelihoods. This conceptual framework shows potential links between farm production diversification and household-level dietary diversity.
Figure 1. Conceptual Pathways between Agriculture and Nutrition
Note: adapted by the authors from Romeo et al. (2016), Herforth and Harris (2014), and Headey et al. (2011)
We adopted this conceptual framework for the agriculture-nutrition pathway to reflect better the link between production diversity on farms and dietary diversity at the household level. We consider farm income (the gross margin income from crop sales) and household expenditure data to calculate the agriculture income. In addition, the Food Consumption Score (FCS) is used to measure household-level diet diversity, and Simpson's Index (SI) to measure farm production diversification. Household size, gender, age, school year, debt, food purchases, total expenditure, rural and urban location, market, farm income, cultivated area, agricultural inputs, and land ownership are used for this study as dependent variables, which were commonly used from previous research, shown in Table 1.
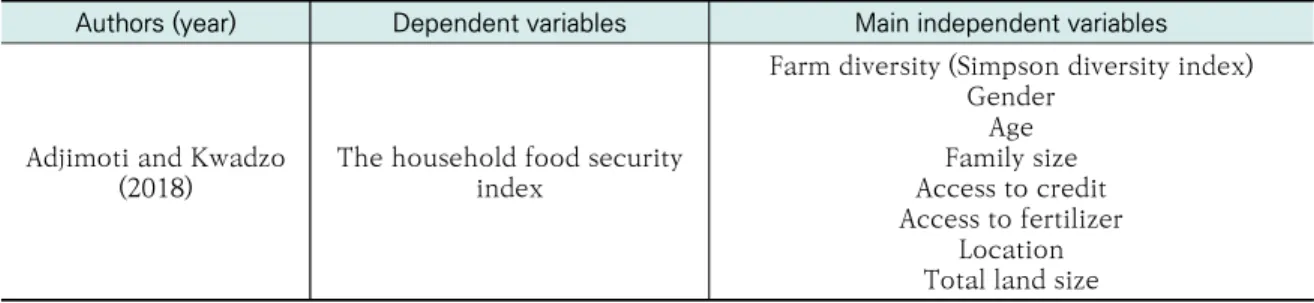
Table 1. Selection of Variables on Dietary Diversity from Previous Studies Authors (year) Dependent variables Main independent variables
Adjimoti and Kwadzo
(2018) The household food security index
Farm diversity (Simpson diversity index) Gender
Family sizeAge Access to credit Access to fertilizer
Location Total land size
(continued) Authors (year) Dependent variables Main independent variables
Jones et al. (2014) FCS (Food Consumption Score)
Farm diversity (Simpson diversity index) Household size
Sex of household head Age of household head Education level of household head Food expenditures per capita in the past 7 days
Region Total cropped area
Chegere and Stage
(2020) Dietary diversity
Agricultural production diversity Distance to the nearest market Expenditure per adult equivalent
Age of household head Sex of household head
Household size Cultivated area
Location Dummy (Rural vs. Urban)
Mango et al. (2018) FCS (Food Consumption Score)
Crop diversification index Cattle ownership
Household size Access to credit
Education level of household head Age of household head Ownership of a grain storage facility
Snapp and Fisher (2015) FCS (Food Consumption Score)
The average number of intercrops across a farm Household’s maize fields
Female household head Age of household head Agricultural landholding Household head education
Location variables Source: Authors’ creation.
2.2. Cambodia’s Agriculture and Nutrition
Over the past two decades, Cambodia experienced 7.7% (IMF estimates) of impressive economic growth on average from 2000 to 2019, and the poverty rate of the headcount index fell from 50.2% in 2003 to 13.5% in 2014. However, the country is still categorized as a lower middle-income country by the World Bank, and many people are in near poverty (WFP, 2019).
Agriculture plays the most crucial role in Cambodia’s economy, with about 80 percent of the population living in rural areas and engaging in agricultural work. It accounts for 34% of the national GDP and 63% of the total labor force (Vernooy, 2015). However, the farming system is mainly dominated by rice production for subsistence or small-scale commercial purposes, so production diversification in Cambodia seems low. In addition, most live in rural areas, making it difficult to increase income in the short term to improve nutrition. Most farmers are self-sufficient due to rural smallholder farming, so
they are likely to have diverse diets if production diversification is available.
Although official rice exports dramatically increased from 12,610 tons in 2009 to 610,000 tons in 2021, farm households still face challenges, such as low productivity and high price fluctuation.
Agricultural practices differ across the ecological zones, and Cambodia has five major zones shown in Figure 2. The Tonle Sap is in the northwest area around Tonle Sap Lake, the largest lake in Southeast Asia. Tonle Sap zone has the largest share of agricultural land, followed by the Plain zone. For Phnom Penh, the share of agricultural land is the smallest as most land is designated as industrial, commercial, or service areas. The coast zone has the highest fruit production. Rice is grown mainly in the Tonle Sap and Plain zones (Yu and Fan, 2011).
Figure 2. Map of Four Agro-ecological Zones in Cambodia
Source: Authors’ creation.
Despite recent economic growth, 2.3 million Cambodians (14.6 percent) face severe food insecurity, with households spending more than 70 percent of their income on food and having poor dietary quality (FAOstat, 2022). Moreover, while they produce enough food to meet the average calorie requirement of their population, access to food is unevenly distributed, and public policy still needs to be focused on production. Thus, more investment is needed to improve nutritional security and accessibility to hygienic food (FAO, 2019; IDS, 2014).
Compared to neighboring countries, the prevalence of malnutrition was high (16.4%) in 2016-18 (FAO et al., 2019). Moreover, the Cambodian diet consists of 75% carbohydrates, and this consumption pattern does not follow the rules recommended by the FAO/WHO.
In addition, low energy consumption and low food diversity resulting from low-income households (Culas and Tek, 2016) deteriorate the potential of Cambodia’s growth. Thus, solving a hidden hunger can be a solution for the country’s further development.
3. Data and Procedure
The study uses the Cambodia Socio-Economic Survey (CSES) conducted in 2014 by the Cambodia National Institute of Statistics (NIS), which can be accessible to this research.
The survey contains country-wide household data such as housing conditions, education, economic activities, production, income, household consumption structure, health, etc.
This research uses 6,736 farming households who are engaged in agricultural activities from 24 provinces in Cambodia.
3.1. Dietary Diversity
Household dietary diversity is captured through the Food Consumption Score (FCS).
The FCS is the index of diversity and balanced food consumption and is the core indicator of consumption recommended by the World Food Program (WFP-VAM, 2006).
The formula is as follows:
∑ (1)
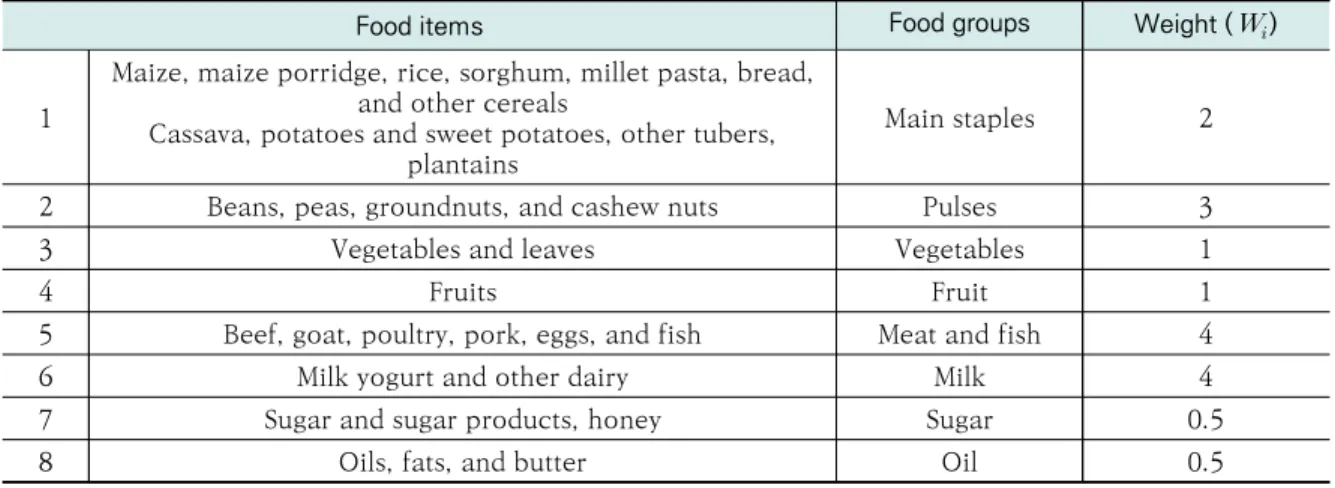
where is the standard weight of food group such as main staples, pulses, vegetables, fruits, meat/fish, milk, sugar, and oil, and is the consumption frequency of food group during the last seven days before the survey in household . The FCS aggregates household-level data on the diversity and frequency of the food groups consumed over the past seven days and then weights them according to their relative nutritional value.
For example, a group of food products containing nutritionally dense foods, such as animal products, account for a higher proportion than a group containing nutritionally
low-density foods, such as tubers (Maxwell et al., 2013). It is a weighted sum of the frequency of household consumption ranging from 0 to 112. Households with FCS ranging from 0 to 21 are categorized as poor consumption, those between 21.5 and 35 are classified as borderline consumption, and those above 35 are categorized as acceptable food consumption.
Table 2. Food Items, Groups, and Weights for Calculating Food Consumption Score by World Food Program
Food items Food groups Weight ()
1
Maize, maize porridge, rice, sorghum, millet pasta, bread, and other cereals
Cassava, potatoes and sweet potatoes, other tubers, plantains
Main staples 2
2 Beans, peas, groundnuts, and cashew nuts Pulses 3
3 Vegetables and leaves Vegetables 1
4 Fruits Fruit 1
5 Beef, goat, poultry, pork, eggs, and fish Meat and fish 4
6 Milk yogurt and other dairy Milk 4
7 Sugar and sugar products, honey Sugar 0.5
8 Oils, fats, and butter Oil 0.5
Source: WFP-VAM (2006).
The thresholds might be slightly changed due to different consumption behaviors.
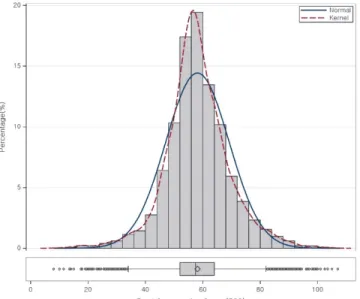
Figure 3 shows the distribution of FCS from the 2014 CSES data. The average FCS is 58.13, indicating acceptable food consumption and a minimum of 8 and a maximum of 107 in Cambodia in 2014.
Figure 3. Distribution of Food Consumption Score (FCS) from 2014 CSES
3.2. Farm Production Diversification
Simpson’s Index (SI) that is often used as an indicator for ecological species diversity can measure production diversification. The formula is as follows:
α
∑
(2)
where is the sum of the squared land area () of crops over the total squared land () grown by household . The SI ranges from 0 to 1, and SI=0 if the household produces only one crop, while SI=1 if all crops are evenly distributed. Based on the CSES data, the average SI is 0.07, which indicates that most farmers are growing one or two crops. The result implies low crop diversification intensity of the sampled households in Cambodia.
3.3. Summary Statistics
1) 4,095 KHR = 1 USD (National Bank of Cambodia, June 2022)
Table 3 shows the summary statistics with a description of the variables used in the analysis. Among livelihood characteristics, household members range from 1 to 15, with an average of 4.58. This sample is a little dominated by male household heads (82%) with a mean age of 47.3 years. The average number of school years completed by the household head is 4.4 years. The household’s average debt is about 1.76 million riels1) (about 500,000 US dollars). 76% of people tend to purchase their food during the last week. The average expenditure of households during the last 1 month is about 5.66 million riels (about 1,600,000 US dollars). 8% of people live in urban areas, and 13% have a market in their village.
The average size of the cultivated areas is 0.94 ha. The gross income from crop sales is 27.18 million riels (about 8,000,000 US dollars), with a production of 3.12 tons and an input cost of 0.99 million riels (about 270,000 US dollars) on average. Besides, most people (93% of households) own their land.
제(Journal of Rural Development) 제46권 제2호 Dietary Diversity
Food Consumption Score
(FCS) Frequency of consumption of different food groups
consumed during the 7 days 6,735 58.13 11.05 8 107
Crop Production Diversification
Simpson index Measurement of crop diversification (A complete
specialization if the Simpson index is 0). 6,736 0.07 0.21 0 0.98
Household/Livelihood Characteristics
H/H size The number of household members 6,735 4.58 1.70 1 15
H/H head sex Dummy variable, sex =1 if male, 0 otherwise 6,735 0.82 0.39 0 1
H/H head age Household head ages in years 6,735 47.30 13.67 16 88
H/H head school year School years completed by household head 6,736 4.40 3.55 0 19
H/H debt value Total amounts of household debt (million riels) 6,736 1.76 5.14 1 120.0
Food purchase Percentage of food purchased in total food
consumption in the last 7 days 6,735 0.76 0.16 0 1
Total expenditure The total expenditure of the household during the
last 1 month (million riels) 6,736 5.66 7.71 0.079 230.5
Urban A dummy variable (1 if a household lives in an urban
area, 0 otherwise) 6,735 0.08 0.26 0 1
Market A dummy variable (1 if the market is in the village, 0
otherwise) 6,457 0.13 0.33 0 1
Farm Characteristics
Farm income The gross margin income from crop sales (million
riels) 6,736 27.18 1,205.45 -55.7 87,700
Total Cultivated Area Size of cultivation area (ha) 6,736 0.94 1.07 0.0015 20
Total production output Quantity of production (ton) 6,735 3.12 10.41 0 500
Total input cost Total input cost of farming (million riels) 6,736 0.99 2.0 0 62.32
Land ownership A dummy variable (1 if a household owns the land, 0
otherwise) 6,736 0.93 0.25 0 1
3.4. Empirical Procedure
The empirical study focuses on the relationship between a household’s diet diversity and production diversification. The food consumption score (FCS) for the household located in village can be written as
α α′α δ ϵ (3)
where is a production diversification, is a vector of household characteristics including demographic variables, household head’s and farm characteristics, is the village fixed effect, is the error term with zero mean and variance (σε). It uses village dummy variables with village clusters to adjust the standard errors of the regressors.
Here, reverse causality between FCS and PD is not in this case since people’s consumption mainly depends on their income, and the primary income source for most rural Cambodians is agricultural production. The problem of omitted relevant variables can be tested using the Hausman specification test for endogeneity with instrument variables (Wooldridge, 2012). The farm inputs such as cultivated area, total production, total input cost, and land ownership can be used as instrumental variables for farm production diversification, assuming those are unrelated to the consumption behavior.
The procedure of the Hausman specification test can be implemented with 2 stage estimation such as
′ Pr (4)
′ ϵ (5)
where θ′ are parameters to be estimated in the first stage by ordinary least square (OLS) and then test τ using t statistic in the second stage. If is rejected as a small significant level, then production diversification () is endogenous because and ϵ are correlated.
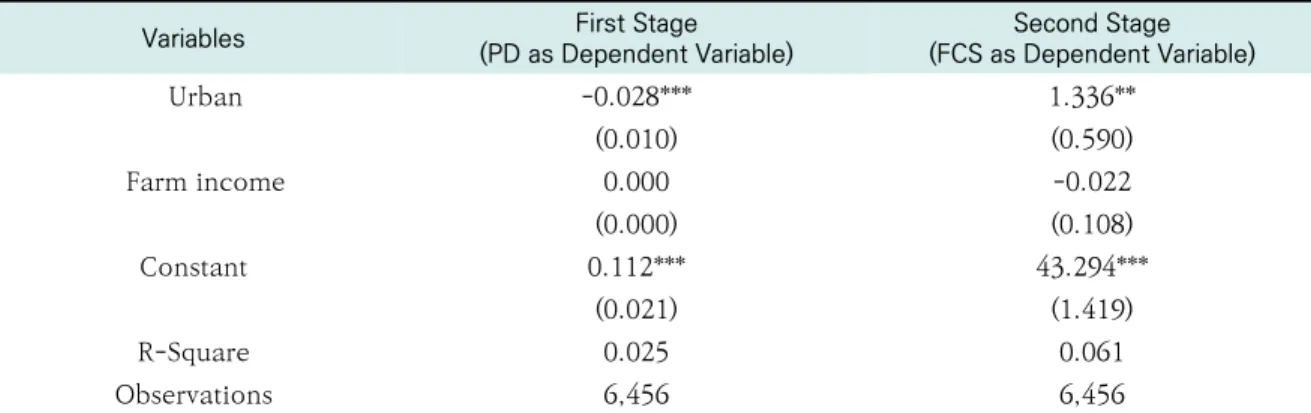
4. Results
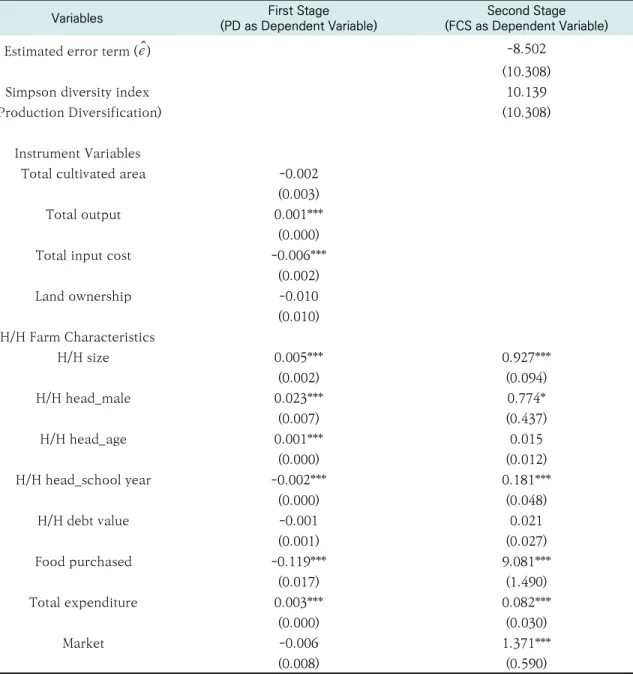
is -8.502 with a 10.308 standard error with a p-value (0.4108), which indicates weak evidence of endogeneity of farm production diversification for food consumption score.
Table 4. Hausman Test Results for Endogeneity
Variables First Stage
(PD as Dependent Variable) Second Stage (FCS as Dependent Variable)
Estimated error term () -8.502
(10.308)
Simpson diversity index 10.139
(Production Diversification) (10.308)
Instrument Variables
Total cultivated area -0.002 (0.003)
Total output 0.001***
(0.000)
Total input cost -0.006***
(0.002)
Land ownership -0.010
(0.010) H/H Farm Characteristics
H/H size 0.005*** 0.927***
(0.002) (0.094)
H/H head_male 0.023*** 0.774*
(0.007) (0.437)
H/H head_age 0.001*** 0.015
(0.000) (0.012)
H/H head_school year -0.002*** 0.181***
(0.000) (0.048)
H/H debt value -0.001 0.021
(0.001) (0.027)
Food purchased -0.119*** 9.081***
(0.017) (1.490)
Total expenditure 0.003*** 0.082***
(0.000) (0.030)
Market -0.006 1.371***
(0.008) (0.590)
Table 4 shows Hausman’s endogeneity test using instrument variables from farm characteristics such as total cultivated area, total output, total input cost, and land ownership for the Simpson diversity index. The first stage is the results from equation (4), and the second is those from equation (5) by OLS. The estimate of
(continued)
Variables First Stage
(PD as Dependent Variable) Second Stage (FCS as Dependent Variable)
Urban -0.028*** 1.336**
(0.010) (0.590)
Farm income 0.000 -0.022
(0.000) (0.108)
Constant 0.112*** 43.294***
(0.021) (1.419)
R-Square 0.025 0.061
Observations 6,456 6,456
Note 1) Numbers in parentheses are standard errors.
2) *** p<0.01, ** p<0.05, * p<0.1.
Table 5 shows the two regression results for equation (3 ) using FCS as a dependent variable. A village dummy is used for both models to find the effects on dietary diversity by considering 787 villages with different social and economic environments that are not captured from the exogenous factors.
The first column includes factors related to household characteristics and farm income, while the second column adds additional factors of farm characteristics. Both results show similar estimates for household characteristics, so explanations are mainly for the second column. Among significant factors, the existence of a market in the village, the share of food purchases in total food consumption, the male household head, household size, household head’s education, land ownership, and total expenditure are significantly associated with dietary diversity. Most importantly, farm production diversification positively affects dietary diversity in rural Cambodia, supporting previous empirical results in Kenya, Tanzania, and Malawi (Herforth, 2010; Jones et al., 2014).
Regarding the magnitude of impacts on dietary diversity, the village market and food purchases are essential factors that positively impact household dietary diversity. When a village has a local market, FCS increases by 8.34 (0.75 SDs)-8.56 (0.77 SDs). If a household increases 1% of food purchased in total food consumption, then FCS increases by 6.97 (0.63 SDs). If it increases by 1% for farm diversification, then dietary diversity increases by 1.385-1.411 (0.13 SDs). In the second model, male household head, household size, land ownership, one-year education, and total expenditure (1 million riels) also increase FCS by 1.117 (0.1 SDs), 1.056 (0.1 SDs), 1.019 (0.09 SDs), 0.111 (0.01 SDs) and 0.101 (0.01 SDs), respectively. On the other hand, total farming input cost (1 million riels, $244) is negatively associated with dietary diversity with a negligible impact of 0.163 (0.01 SDs).
Lastly, the r-square that can explain the variation of dietary diversity by dependent variables is about 39.8%, which seems to be low. Other factors, such as non-farm income, remittances, and credit access, can significantly enhance dietary diversity.
Nonetheless, overall results indicate that policies related to providing access to the market, enabling households to purchase food in rural areas, and agricultural production diversification are meaningful in enhancing household dietary diversity in rural Cambodia.
Table 5. Estimation Results of Dietary Diversity Using Food Consumption Score
Variables (1) (2)
Simpson diversity index 1.408** 1.385**
(Production Diversification) (0.689) (0.690)
H/H size 1.060*** 1.056***
(0.077) (0.077)
H/H head_male 1.095*** 1.117***
(0.347) (0.347)
H/H head_age 0.017* 0.015
(0.010) (0.010)
H/H head_school year 0.114*** 0.111***
(0.041) (0.041)
H/H debt value 0.026 0.025
(0.026) (0.026)
Food purchased 6.977*** 6.966***
(0.988) (0.990)
Total expenditure 0.087*** 0.101***
(0.019) (0.021)
Market 8.559* 8.336*
(4.651) (4.654)
Urban 1.442 2.128
(6.476) (6.481)
Farm income -0.039 -0.029
(0.099) (0.099)
Total cultivated area 0.044
(0.169)
Total output 0.003
(0.014)
Total input cost -0.163*
(0.090)
Land ownership 1.019*
(0.522)
Constant 41.327*** 40.701***
(3.888) (3.900)
(continued)
Variables (1) (2)
Village dummy YES YES
R-Square 0.397 0.398
Observations 6,456 6,456
Note 1) Numbers in parentheses are standard errors.
2) *** p<0.01, ** p<0.05, * p<0.1.
Production diversification would affect dietary diversity differently depending on the farm size. Table 6 shows the different effects across farm sizes with 4 categories: [0, 0.5), [0.5, 1], (1, 2], and (2, ∞]. Production diversity for farmers with 1-2 ha positively affects dietary diversity, while others do not. On the other hand, among more than 2 ha of farm size, households living in urban areas have lower dietary diversity than those living in rural areas by 15.427 (1.4 SDs). The average farm size is 0.9 ha and most farmers cultivate rice and other crops. Thus, farmers with relatively large farms in an urban area might not be interested in dietary diversity for their household consumption. Furthermore, farm income strongly relates to dietary diversity by 2.269 (0.21 SDs) only for farmers with less than 0.5 ha. Most importantly, the percentage of food purchased in total food consumption during the last 7 days highly relates to dietary diversity for all farming groups, indicating the importance of enabling households to purchase food in rural areas.
Table 6. Estimation Results of Dietary Diversity by Farm Size Variables
Farm size (ha)
[1] [2] [3] [4]
<0.5 0.5≤ ≤1 1< ≤2 >2
Simpson diversity index 1.930 0.411 3.193* 0.961
(1.516) (1.145) (1.920) (2.959)
H/H size 1.128*** 1.048*** 1.233*** 0.382
(0.165) (0.127) (0.220) (0.349)
H/H head_male 0.735 0.894* 0.519 -0.826
(0.648) (0.535) (1.202) (2.217)
H/H head_age 0.017 0.006 -0.001 0.039
(0.020) (0.015) (0.031) (0.050)
H/H head_school year 0.143* 0.046 0.054 -0.003
(0.082) (0.066) (0.121) (0.192)
H/H debt value 0.052 0.052 0.010 -0.041
(0.072) (0.051) (0.067) (0.076)
(continued) Variables
Farm size (ha)
[1] [2] [3] [4]
<0.5 0.5≤ ≤1 1< ≤2 >2
Food purchased 7.822*** 5.827*** 10.087*** 9.647**
(2.065) (1.566) (3.025) (4.753)
Total expenditure 0.154*** 0.184*** 0.029 0.038
(0.053) (0.048) (0.064) (0.044)
Market 0.688 7.324 11.040 12.552
(10.632) (5.577) (7.597) (7.892)
Urban 6.411 0.767 -0.743 -15.427**
(10.663) (10.141) (10.585) (7.160)
Farm income 2.269* -0.029 -5.870 16.668
(1.260) (0.113) (36.689) (16.179)
Total cultivated area 2.703 0.533 0.493 -0.025
(2.393) (1.007) (1.369) (0.443)
Total output 0.173 0.049 0.011 -0.121***
(0.243) (0.037) (0.020) (0.046)
Total input cost -0.755 -0.173 -0.155 -0.146
(0.622) (0.356) (0.441) (0.125)
Land ownership 1.796 1.384* 1.876 -2.412
(1.119) (0.825) (1.681) (2.820)
Constant 40.536*** 41.756*** 36.92*** 68.063***
(5.395) (4.924) (7.058) (7.527)
Village dummy YES YES YES YES
R-squared 0.501 0.493 0.663 0.734
Observations 2,055 2,999 945 457
Note 1) Numbers in parentheses are standard errors.
2) *** p<0.01, ** p<0.05, * p<0.1
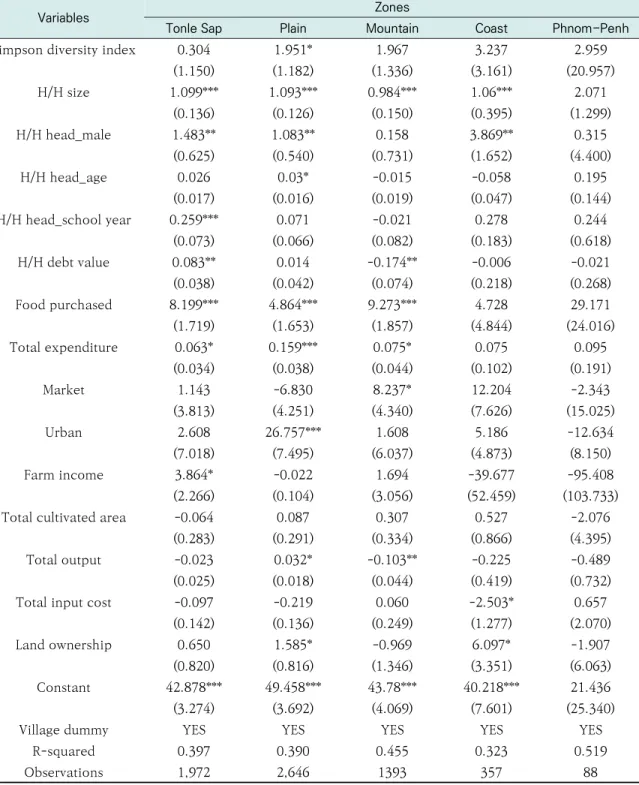
Agricultural ecological zones can affect dietary diversity through production diversification shown in Table 7. Production diversification in the plain zone affects dietary diversity by 1.951 (0.18 SDs), while others do not. The plain zone also has many rice farmers; most people are engaged in agriculture. When households live in urban areas in the plain zone, they tend to have higher dietary diversity than those living in rural areas by 26.757 (2.42 SDs). An additional 1 million riels ($244) of farm income in Tonle Sap, where most farmers are growing rice due to easy access to the water, is associated with dietary diversity by 3.864 (0.35 SDs). Furthermore, the percentage of food purchased strongly affects dietary diversity, emphasizing the importance of enabling households to have purchasing power for their food.
Table 7. Estimation Results of Dietary Diversity by Ecological Zones
Variables Zones
Tonle Sap Plain Mountain Coast Phnom-Penh
Simpson diversity index 0.304 1.951* 1.967 3.237 2.959
(1.150) (1.182) (1.336) (3.161) (20.957)
H/H size 1.099*** 1.093*** 0.984*** 1.06*** 2.071
(0.136) (0.126) (0.150) (0.395) (1.299)
H/H head_male 1.483** 1.083** 0.158 3.869** 0.315
(0.625) (0.540) (0.731) (1.652) (4.400)
H/H head_age 0.026 0.03* -0.015 -0.058 0.195
(0.017) (0.016) (0.019) (0.047) (0.144)
H/H head_school year 0.259*** 0.071 -0.021 0.278 0.244
(0.073) (0.066) (0.082) (0.183) (0.618)
H/H debt value 0.083** 0.014 -0.174** -0.006 -0.021
(0.038) (0.042) (0.074) (0.218) (0.268)
Food purchased 8.199*** 4.864*** 9.273*** 4.728 29.171
(1.719) (1.653) (1.857) (4.844) (24.016)
Total expenditure 0.063* 0.159*** 0.075* 0.075 0.095
(0.034) (0.038) (0.044) (0.102) (0.191)
Market 1.143 -6.830 8.237* 12.204 -2.343
(3.813) (4.251) (4.340) (7.626) (15.025)
Urban 2.608 26.757*** 1.608 5.186 -12.634
(7.018) (7.495) (6.037) (4.873) (8.150)
Farm income 3.864* -0.022 1.694 -39.677 -95.408
(2.266) (0.104) (3.056) (52.459) (103.733)
Total cultivated area -0.064 0.087 0.307 0.527 -2.076
(0.283) (0.291) (0.334) (0.866) (4.395)
Total output -0.023 0.032* -0.103** -0.225 -0.489
(0.025) (0.018) (0.044) (0.419) (0.732)
Total input cost -0.097 -0.219 0.060 -2.503* 0.657
(0.142) (0.136) (0.249) (1.277) (2.070)
Land ownership 0.650 1.585* -0.969 6.097* -1.907
(0.820) (0.816) (1.346) (3.351) (6.063)
Constant 42.878*** 49.458*** 43.78*** 40.218*** 21.436
(3.274) (3.692) (4.069) (7.601) (25.340)
Village dummy YES YES YES YES YES
R-squared 0.397 0.390 0.455 0.323 0.519
Observations 1,972 2,646 1393 357 88
Note 1) Numbers in parentheses are standard errors.
2) *** p<0.01, ** p<0.05, * p<0.1.
5. Conclusion
Enhancing household dietary diversity can improve child nutrition by treating hidden hunger and contributing to national nutrition, food security, and economic growth. In addition, production diversification is an effective way for dietary diversity in developing countries, as Di Falco and Chavas (2009) demonstrate that cultivating several crops helps smallholder farmers manage price and production risks.
Given Cambodia Socio-Economic Survey (CSES) data in 2014, this study finds that production diversification in Cambodia is positively associated with the diversity of household diets, consistent with previous empirical results in Kenya, Tanzania, and Malawi (Herforth, 2010; Jones et al., 2014). Production diversity for smallholder farmers with 1-2 ha positively affects dietary diversity, which can be understood by the average farm size of 0.9 ha. Most smallholder farmers cultivate rice up to approximately 0.5-0.7 ha and then start to grow other crops. Furthermore, production diversity in the plain zone, where the average income is higher than in other zones, is positively associated with dietary diversity. In addition, total expenditure as an indicator of total income is positively associated with dietary diversity, consistent with previous studies (Rajendran et al., 2017; Pellegrini & Tasciotti, 2014; Thorne-Lyman et al., 2010) as well as the conceptual framework shown in Figure 1. More importantly, market accessibility and the percentage of food purchased have a positive association with a diverse diet by 8.34 (0.75 SDs) and 6.97 (0.63 SDs), respectively, which indicate that policies related to providing access to the market and enabling households to purchase food in rural areas are of significance in enhancing household dietary diversity in rural Cambodia.
In Cambodia, food security and nutrition are complex issues. To address both undernutrition and health issues, the Second National Strategy for Food Security and Nutrition (2nd NSFSN) 2019-2023 was formulated with the following objectives: 'Promote diversified, nutritious and sustainable food production' and 'Reduce remaining inequalities in access to sufficient, nutritious and diverse foods and good nutrition'. To achieve the objectives of food security and nutrition, the Minister of Water Resources and Meteorology (MoWRAM) and the Minister of Agriculture, Forestry and Fisheries (MAFF) both make an important contribution to the productivity and diversity of the agricultural sector (Council for Agricultural and Rural Development, 2019).
Dietary diversity is one of the main approaches to preventing and treating malnutrition. While Cambodia has not experienced extreme food insecurity due to its rice-centric agriculture, which allows for stable consumption of staple foods, it has one of the highest malnutrition rates among Southeast Asian countries. Addressing the complex issue of malnutrition requires a range of interventions, and a multidisciplinary approach at the national level is needed to ensure that the underlying causes are consistently addressed.
References
Adjimoti, Gilbert Onionkiton, and George Tsey-Mensah Kwadzo. (2018). Crop Diversification and Household Food Security Status: Evidence from Rural Benin. Agriculture & Food Security, 7(1), 82.
https://doi.org/10.1186/s40066-018-0233-x
Bellon, Mauricio R., Gervais D. Ntandou-Bouzitou, and Francesco Caracciolo. (2016). On-Farm Diversity and Market Participation Are Positively Associated with Dietary Diversity of Rural Mothers in Southern Benin, West Africa. PLOS ONE, 11, e0162535.
https://doi.org/10.1371/journal.pone.0162535
Chegere, Martin J, and Jesper Stage. (2020). Agricultural Production Diversity, Dietary Diversity and Nutritional Status: Panel Data Evidence from Tanzania. World Development, 129, 104856.
https://doi.org/10.1016/j.worlddev.2019.104856
Council for Agricultural and Rural Development. (2019). The Second National Strategy for Food Security and Nutrition 2019-2023.
Csaki, Csaba. (2003). Reaching the Rural Poor: A Renewed Strategy for Rural Development. The World Bank.
Culas, Richard J, and Kimsong Tek. (2016). Food security in Cambodia: trends and policy objectives.
International Journal of Development Issues, 15(3), 306-327.
https://doi.org/10.1108/ijdi-06-2016-0033
Demment, Montague W, Michelle M Young, and Ryan L Sensenig. (2003). Providing Micronutrients through Food-based Solutions: A Key to Human and National Development. The Journal of Nutrition, 133(11), 3879S-85S. https://doi.org/10.1093/jn/133.11.3879s
Di Falco, Salvatore, and Jean-Paul Chavas. (2009). On Crop Biodiversity, Risk Exposure, and Food Security in the Highlands of Ethiopia. American Journal of Agricultural Economics, 91(3), 599-611.
https://doi.org/10.1111/j.1467-8276.2009.01265.x
FAO. (2014). Cambodia - Food and Nutrition Security Profiles.
FAO, IFAD, UNICEF, WFP and WHO. (2019). The State of Food Security and Nutrition in the World 2019.
Safeguarding against Economic Slowdowns and Downturns. Rome, FAO.
FAO, IFAD, and WFP. (2014). The State of Food Insecurity in the World 2014. Strengthening the Enabling Environment for Food Security and Nutrition. Rome.
FAOStat. (2022). Food Security Indicators. (Updated Oct. 2021) Accessed May 15, 2022.
http://www.fao.org/economic/ess/ess-fs/ess-fadata/en/#.Xr6aN2gzZPY
Frison, E. A., Smith, I. F., Johns, T., Cherfas, J., & Eyzaguirre, P. B. (2006). Agricultural Biodiversity, Nutrition, and Health: Making a Difference to Hunger and Nutrition in the Developing World. Food and Nutrition Bulletin, 27(2), 167-79. https://doi.org/10.1177/156482650602700208
Headey, D., Chiu, A., & Kadiyala, S. (2011). Agriculture’s Role in the Indian Enigma: Help or Hindrance to the Undernutrition Crisis? (No. 1085). International Food Policy Research Institute (IFPRI).
Herforth, A. (2010). Promotion of Traditional African Vegetables in Kenya and Tanzania: A Case Study of an Intervention Representing Emerging Imperatives in Global Nutrition. Ph.D. Dissertation at Cornell University.
Herforth, A., & Harris, J. (2014). Understanding and Applying Primary Pathways and Principles. Brief #1.
Improving Nutrition through Agriculture Technical Brief Series. Arlington, VA: USAID/Strengthening Partnerships, Results, and Innovations in Nutrition Globally (SPRING) Project.
Hughes, J. D. A., & Keatinge, J. D. H. (2012). The Nourished Millennium: How Vegetables Put Global Goals
for Healthy, Balanced Diets within Reach. High Value Vegetables in Southeast Asia: Production, Supply and Demand, 11-26.
IDS (Institute of Development Studies). (2014). The Hunger and Nutrition Commitment Index (HANCI 2013): Measuring the Political Commitment to Reduce Hunger and Undernutrition in Developing Countries. Brighton, UK: IDS.
Jones, A. D. (2017). On-Farm Crop Species Richness Is Associated with Household Diet Diversity and Quality in Subsistence - and Market-Oriented Farming Households in Malawi. The Journal of nutrition, 147(1), 86-96.
Jones, A. D., Shrinivas, A., & Bezner-Kerr, R. (2014). Farm Production Diversity Is Associated with Greater Household Dietary Diversity in Malawi: Findings from Nationally Representative Data. Food Policy, 46, 1-12.
MAFF. (2015). Agricultural Sector Strategic Development Plan 2014-2018. Phnom Penh, Cambodia.
Malapit, H. J. L., Kadiyala, S., Quisumbing, A. R., Cunningham, K., & Tyagi, P. (2015). Women’s Empowerment Mitigates the Negative Effects of Low Production Diversity on Maternal and Child Nutrition in Nepal. The Journal of Development Studies, 51(8), 1097-1123.
https://doi.org/10.1080/00220388.2015.1018904
Mango, N., Makate, C., Mapemba, L., & Sopo, M. (2018). The role of crop diversification in improving household food security in central Malawi. Agriculture & Food Security, 7(1), 1-10.
Pellegrini, L., & Tasciotti, L. (2014). Crop diversification, Dietary Diversity and Agricultural Income:
Empirical Evidence from Eight Developing Countries. Canadian Journal of Development Studies/Revue canadienne d'études du développement, 35(2), 211-27.
Pingali, P. (2015). Agricultural Policy and Nutrition Outcomes-getting beyond the Preoccupation with Staple Grains. Food Security, 7, 583-91. https://doi.org/10.1007/s12571-015-0461-x
Rajendran, S., Afari-Sefa, V., Shee, A., Bocher, T., Bekunda, M., & Lukumay, P. J. (2017). Does Crop Diversity Contribute to Dietary Diversity? Evidence from Integration of Vegetables into Maize-based Farming Systems. Agriculture & Food Security, 6(1), 50. https://doi.org/10.1186/s40066-017-0127-3 Romeo, A., Meerman, J., Demeke, M., Scognamillo, A., & Asfaw, S. (2016). Linking Farm Diversification to
Household Diet Diversification: Evidence from a Sample of Kenyan Ultra-poor Farmers. Food Security, 8, 1069-85. https://doi.org/10.1007/s12571-016-0617-3
Ruel, M. T. (2003). Operationalizing Dietary Diversity: A Review of Measurement Issues and Research Priorities. The Journal of Nutrition, 133(11), 3911S-26S. https://doi.org/10.1093/jn/133.11.3911s Sibhatu, K. T., Krishna, V. V., & Qaim, M. (2015). Production diversity and dietary diversity in smallholder
farm households. Proceedings of the National Academy of Sciences, 112(34), 10657-10662.
https://doi.org/10.1073/pnas.1510982112
Snapp, S. S., & Fisher, M. (2015). “Filling the maize basket” supports crop diversity and quality of household diet in Malawi. Food Security, 7, 83-96. https://doi.org/10.1007/s12571-014-0410-0 te Lintelo, D. J., Haddad, L., Lakshman, R., & Gatellier, K. (2014). The Hunger and Nutrition Commitment
Index (HANCI 2013): measuring the political commitment to reduce hunger and undernutrition in developing countries (No. IDS Evidence Report; 78). IDS.
Thompson, B., & Amoroso, L. (Eds.). (2011). Combating micronutrient deficiencies: food-based approaches. Cabi.
Thorne-Lyman, A. L., Valpiani, N., Sun, K., Semba, R. D., Klotz, C. L., Kraemer, K., ... & Bloem, M. W.
(2010). Household dietary diversity and food expenditures are closely linked in rural Bangladesh, increasing the risk of malnutrition due to the financial crisis. The Journal of nutrition, 140(1), 182S-188S.
Vernooy, R. (2015). Effective implementation of crop diversification strategies for Cambodia, Lao PDR and Vietnam: Insights from past experiences and ideas for new research.
von Grebmer, K., Saltzman, A., Birol, E., Wiesmann, D., Prasai, N., Yin, S., Yohannes, Y., Menon, P., Thompson, J., & Sonntag, A. (2014). 2014 Global Hunger Index: The challenge of hidden hunger.
IFPRI books. http://dx.doi.org/10.2499/9780896299580
Wackerly, D., Mendenhall, W., & Scheaffer, R. L. (2002). Mathematical Statistics with Applications. 6th ed.
Duxbury. CA. USA.
WFP. (2019). WFP Cambodia Country Brief.
WFP-VAM. (2006). Food consumption analysis: calculation and use of the food consumption score in food security analysis. Rome: WFP.
Wooldridge, J.M. (2012). Introductory Econometrics: A Modern Approach. Cengage Learning.
Appendix 1. Average Statistics by Farm Size
Variable <0.5 ha 0.5-1.0 ha 1.0-2.0 ha >2 ha
Dietary Diversity
FCS 57.88 57.91 58.87 59.05
Crop Diversity
Simpson index 0.07 0.06 0.11 0.09
Household Characteristics
H/H size 4.29 4.57 4.97 5.11
H/H head sex 0.76 0.83 0.89 0.91
H/H head age 47.63 47.05 47.37 47.27
H/H head school year 4.59 4.17 4.43 4.97
H/H debt value 1,477,882 1,474,002 2,222,130 3,858,518
Food purchase 0.79 0.75 0.75 0.76
Total expenditure 4,363,567 4,834,190 7,205,877 13,482,976
Market 0.13 0.13 0.13 0.13
Urban 0.09 0.06 0.07 0.10
Farm Characteristics
Farm income 8,468,429 42,033,223 30,285,167 9,112,697
Total Cultivated Area 0.26 0.75 1.61 3.76
Total output 0.98 2.23 5.94 12.37
Total input cost 430,941 758,419 1,459,917 3,954,707
Land ownership 0.93 0.93 0.93 0.94
Appendix 2. Average Statistics by Ecological Zone
Variable Tonle Sap Plain Mountain Coast Phnom-Penh
Dietary Diversity
FCS 57.90 58.31 57.42 60.12 60.90
Crop Diversity
Simpson index 0.08 0.07 0.07 0.08 0.01
Household Characteristics
H/H size 4.60 4.53 4.69 4.38 4.85
H/H head sex 0.84 0.79 0.84 0.83 0.81
H/H head age 47.14 49.11 45.39 47.27 50.02
H/H head school year 4.14 4.63 4.07 4.84 6.79
H/H debt value 1,836,517 1,958,804 1,439,993 1,114,415 1,865,934
Food purchase 0.75 0.78 0.74 0.77 0.91
Total expenditure 5,999,758 5,815,091 5,103,077 4,721,279 6,508,848
Market 0.11 0.13 0.14 0.11 0.14
Urban 0.07 0.06 0.09 0.10 0.35
Farm Characteristics
Farm income 6,458,442 59,870,480 3,496,419 1,552,377 4,958,478
Total Cultivated Area 1.15 0.76 1.05 0.81 0.48
Total output 3.52 3.03 3.08 1.98 1.90
Total input cost 1,030,699 1,093,706 829,515 630,972 1,054,126
Land ownership 0.92 0.92 0.96 0.95 0.89