The difference in color perception according to brightness was compared with CIECAM02, one of the color appearance models. Since the color appearance investigation was conducted in only two lighting situations in this study, the phenomenon of this study cannot represent the change in color perception in the whole HDR situation.
Introduction
Research background
The color representation model is a model that predicts how to perceive colors by taking into account the characteristics of the surrounding environment and the state of adaptation of the observer. This may not be interpreted as the actual color rendering model based on a single light source.
Research goal
Literature Review
Literature Review Overview
Phenomena related to color representation are derived from the model of color representation (Fairchild, 2013). Color appearance under single illumination conditions and adaptation to mixed illumination were investigated.
Color and Lighting Terminologies
3-dimensional, approximately uniform color space produced by drawing in rectangular coordinates L*, a*, b* quantities defined by the equations:. and X, Y, Z describe the color stimulus under consideration and Xn, Yn, Zn describe a specified white achromatic stimulus. psychophysical) color: specification of a color stimulus in terms of operationally defined values, such as 3 tristimulus values. psychophysical) color: specification of a color stimulus in terms of operationally defined values, such as 3 tristimulus values.
Color Appearance phenomena
Since luminance is intended to represent the effects of various stimulus wavelengths that elicit awareness of luminance, it is often mistakenly assumed that the Y of tristimulus values produces a direct estimate of perceived luminance. The Hunt effect can be summarized by stating that the color richness of a given stimulus increases with the brightness level.

CIECAM02
- Viewing condition parameter
- Adaptation Model
- Degree of Adaptation
- Post-adaptation nonlinear response compression
- Opponent color dimensions
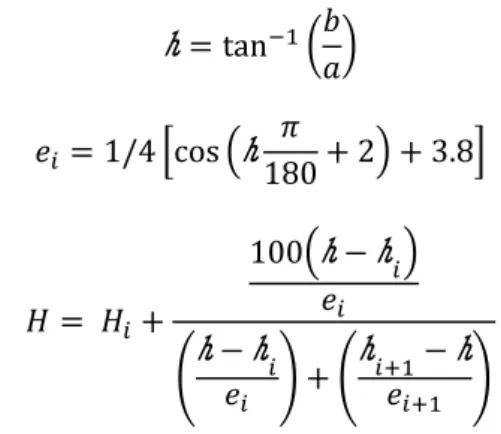
- Hue
- Lightness
- Brightness
- Chroma
- Colorfulness
- Saturation
Lightness, J is calculated from the achromatic response, Aw and the achromatic response for white, Aw, the surround factor, c, and the base exponent, z. Brightness, Q is calculated from the brightness, J, the achromatic response for white, Aw, the surround factor, c, and the adjustment factor for the luminance level, FL.
Psychophysics
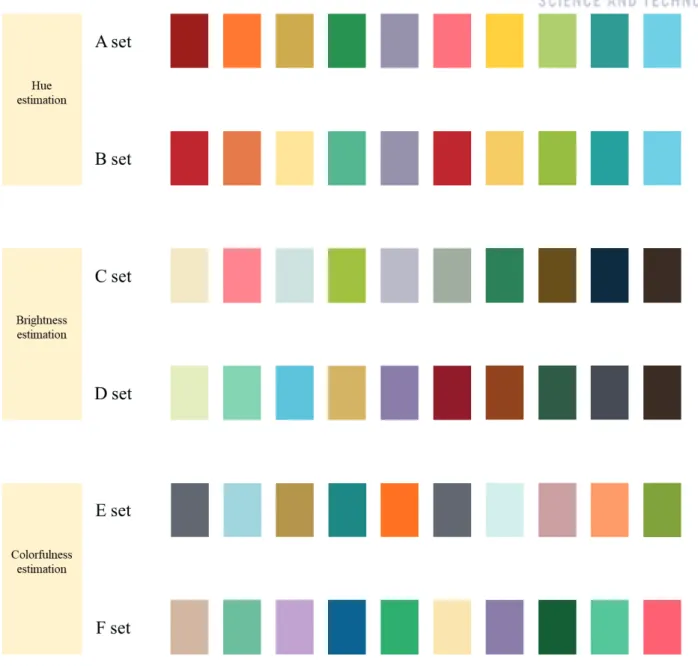
- Test colors
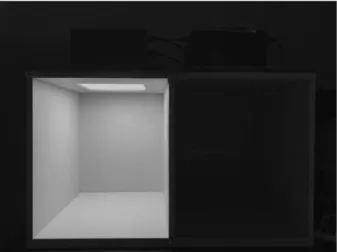
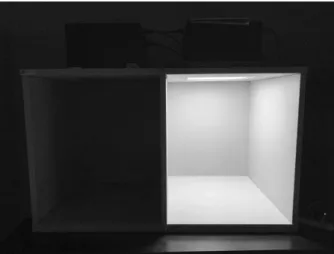
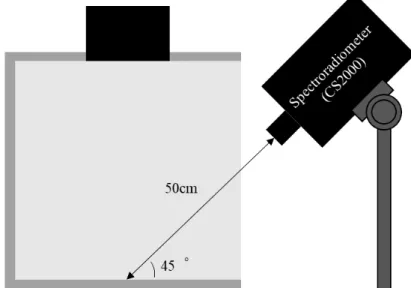
The lighting conditions are set so that the difference between high and low luminance lighting can be noticeably realized within the photopic vision. The CCT and illumination of the light is measured from the center of the stand to the illumination. All luminance values were measured 50 cm from the center of the cage floor, with a 45° line slope.
Lighting booths with two different illuminances were intended to have approximately the same CCT and were also matched to the spectrum of the lighting. If the same test color is estimated at low and high luminance, the subject can predict the purpose of the experiment. Because these latent factors can influence the results of the experiment, the estimated spots at low and high luminance will be different.
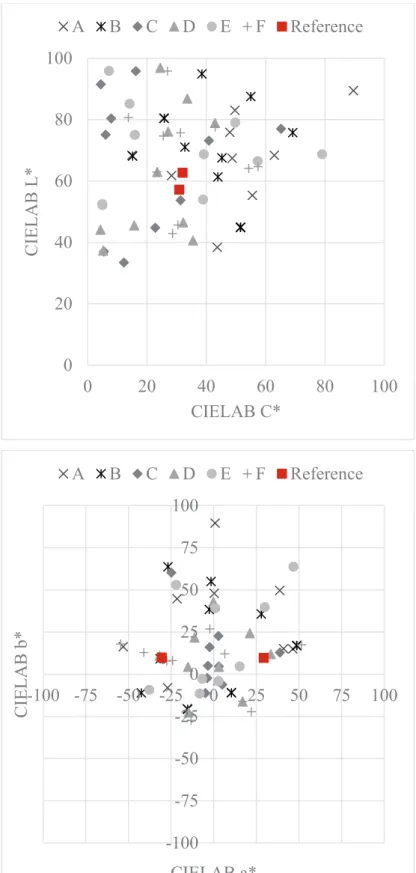
The reference color of the CIELAB value is calculated based on the reference white (S-0300-N) measured under two different illuminances (Figure 8). All NCS color patches used in the experiment were converted using NCS navigator 2.0 (NCS color AB, 2011), which provides the closest conversion to the original NCS 1950 color.
Psychophysical Experimental Procedure
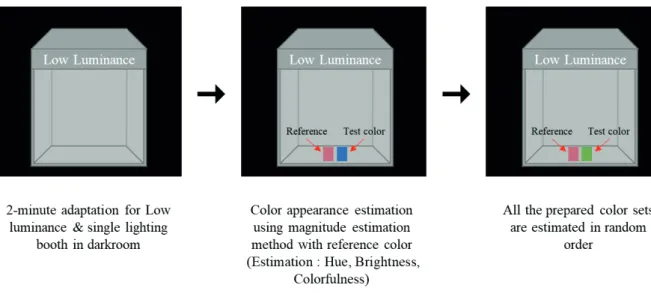
- Introduction of experiment and observer training
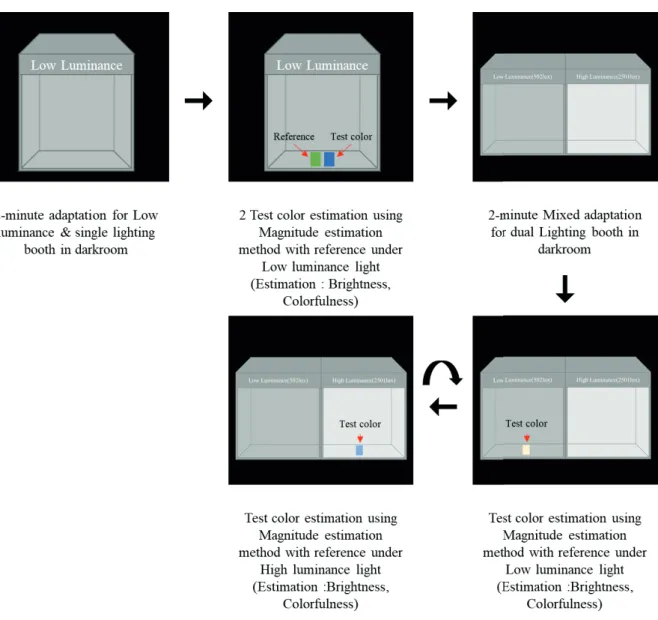
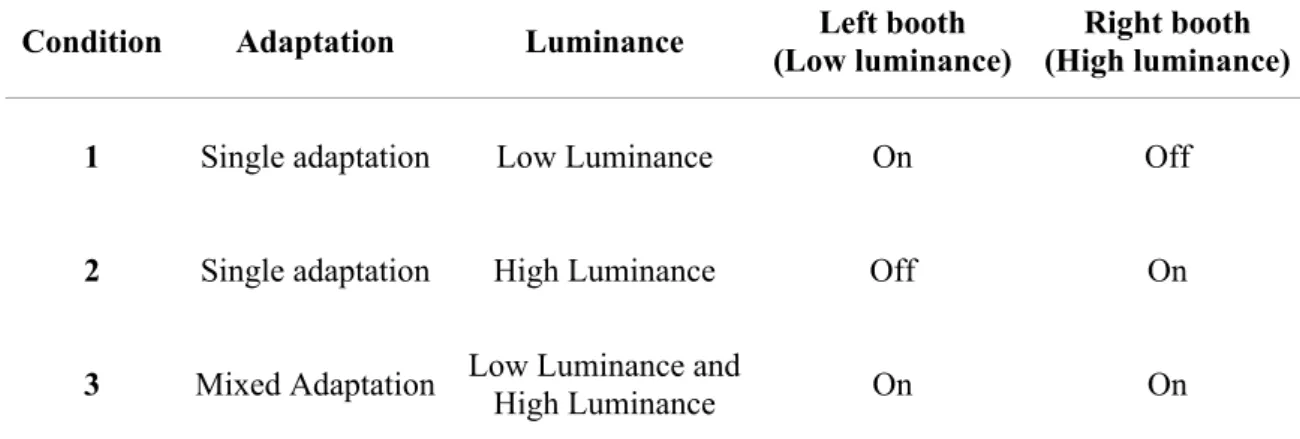
- Condition 1: Single Lighting Adaptation, Low Luminance
- Condition 2: Single Lighting Adaptation, High Luminance
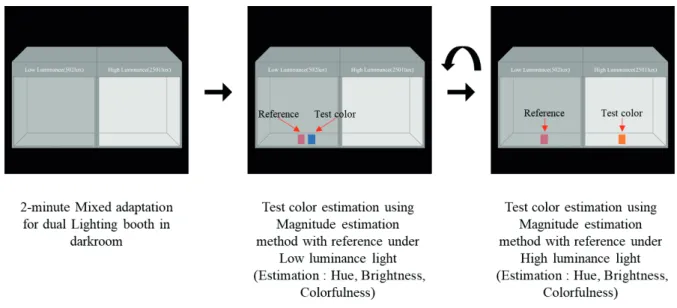
- Condition 3: Mixed Lighting adaptation, Low and High Luminance
Based on the reference, using the Magnitude Estimation method, the appearance of the color was estimated as a number. The number of repetitions for each set varies slightly depending on the subject and the appearance factor of the color. Then, based on the memorized reference from Condition 1, using the Magnitude Estimation method, the appearance of the color as a number was verbally estimated.
The reference was always placed in the center of the booth floor under low luminance lighting. The colors in the sets A, C, E are only estimated at low luminance, and the colors in the sets of B, D, F are only estimated at high luminance. When estimating luminance, the color of the C set was estimated under low luminance illumination and the color of the D set under high luminance illumination.
In the chrominance estimation, the color of the E set was estimated under low luminance illumination and the color of the F set under high luminance illumination. The repetition for each set is slightly different depending on the motif and the appearance factor of the color.
Participants
Experiment Outline
Result
Data Analysis Outline
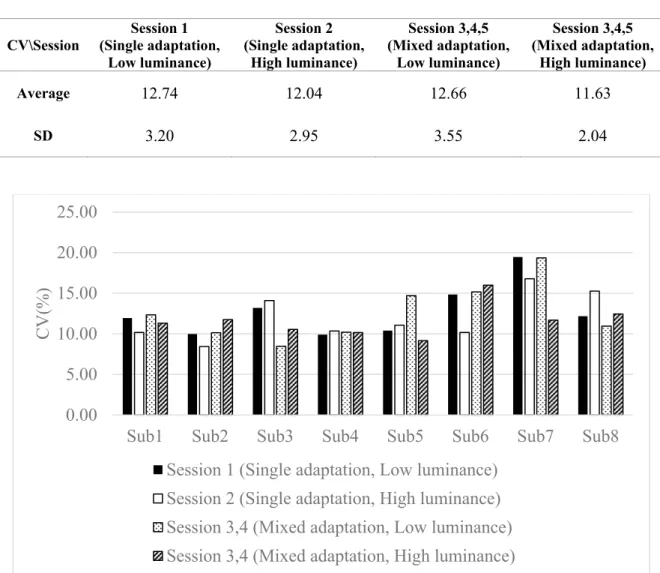
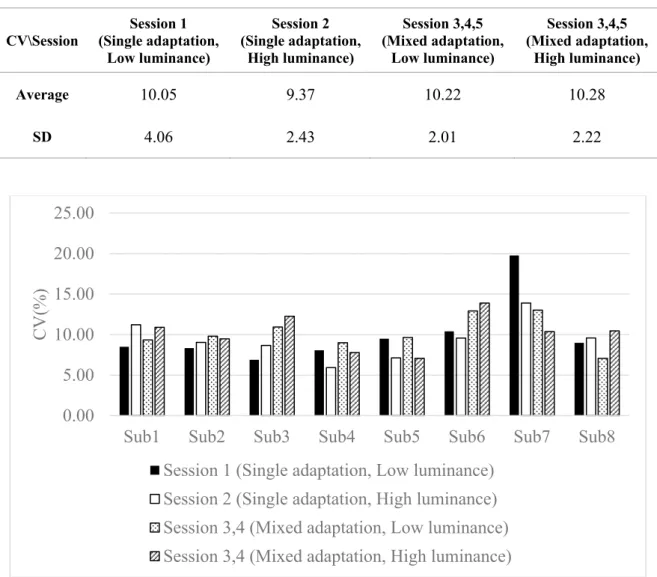
In this experiment, a total of five sessions were conducted, and the data are divided and analyzed according to the adaptation conditions and luminance conditions. First, the difference in appearance according to the presentation method of the reference is examined. The arithmetic mean and geometric mean of all response data had a small difference of 2.761%.
Therefore, the arithmetic mean was used in the analysis for the convenience of the calculation process. The coefficient of variation (CV) is defined as the ratio of the standard deviation to the mean. The coefficient of variation should only be calculated for data measured on a ratio scale, that is, that scale has a meaningful zero, allowing relative comparison of two measurements (Everitt, 1998).
In order to investigate the change in color appearance with adjustment, the arithmetic mean response of each light adjustment for hue, brightness and chrominance is compared with the arithmetic mean response. Instead, it is compared to CIECAM02 predicted values, not between test colors, and the CIECAM02 prediction performance is also evaluated.
Observer Performance
- Repeatability
- Reproducibility
- Summary of Observer Performance
Also when comparing the repeatability of the estimated brightness or colorfulness in session 1 and sessions 3 and. In other words, it is assumed that the reproducibility of the colorfulness estimation according to the experimental method and the. In Chapter 4.2, the observer's performance in estimating brightness and colorfulness using the magnitude estimation method was evaluated.
In the case of a single light adaptation, the difference in CV between session 1 and session 2 was not significant for brightness and color ratings. For reproducibility, the CV was calculated by comparing the mean of the individual with the mean of all subjects. Across the four sessions, the mean CV for brightness estimation was 9.76% and the mean CV for color estimation was 12.36%.
In terms of repeatability and reproducibility, it can be observed that the CV for color evaluation is higher than the CV for brightness evaluation. From a previous study, when the magnitude rating was performed under a single illumination, the CV of the brightness rating was 13% and the chrominance rating was 18% (Luo et al, 1991).
Effect of reference presentation method on Color appearance estimation
- Effect of reference patch on Color appearance estimation
- Effect of reference presentation method on color appearance estimation
- Summary of Effect of reference on Color appearance estimation
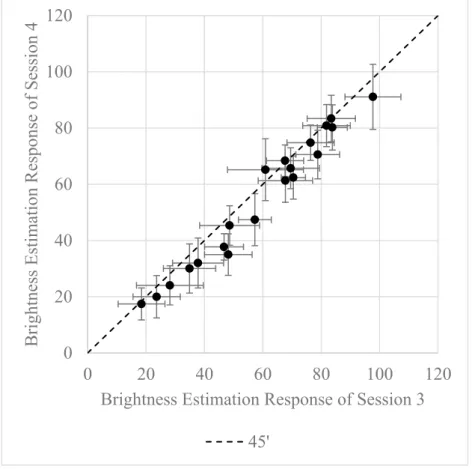
In session 3 and session 4, 10 test colors at low luminance (set C) and 10 at high luminance (set D) were estimated for brightness. The horizontal axis represents the average of the brightness estimate in session 3, and the vertical axis represents the average response of the brightness estimate in session 4. The presence of the data pointers on the 45° line indicates that they responded with the same brightness for the test colors in session 3 and session 4.
Similarly, in session 3 and session 4, the colourness of the 10 test colors at low luminance (set E) and 10 at high luminance (set F) was estimated. In Figure 21, the horizontal axis represents the mean response of the chromaticity estimate in session 3, and the vertical axis represents the mean response of the chromaticity estimate in session 4. In Figure 22, the horizontal axis represents the brightness estimate in session 5, and the vertical axis represents the average brightness estimate response in sessions 3 and 4.
In Figure 23, the horizontal axis represents the chrominance rating in session 5, and the vertical axis represents the mean chrominance rating response in sessions 3 and 4. Most of the data points lie on the 45° line, which means that the chrominance rating responses in session 5 and the other sessions were similar.
Effect of adaptation condition on Color appearance estimation
- Effect of adaptation condition on Hue estimation
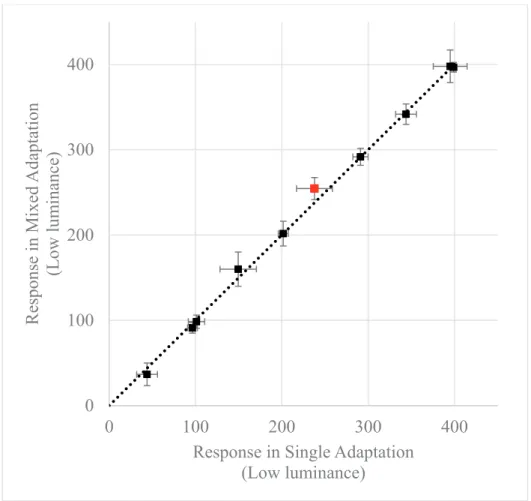
- Effect of adaptation condition on brightness estimation
- Effect of adaptation condition on colorfulness estimation
- Summary of Effect of adaptation condition
The vertical axis represents the average hue estimate response for test colors set in the mixed adjustment. The colors of set A and set B were estimated by hue in single adjustment and mixed adjustment. The vertical axis represents the average brightness estimate response for the test colors of sets C and D in the mixed fit.
The vertical axis represents the mean color rating response for the test colors in the mixed match. In Figure 28, the color evaluation of group E in low light is done in single-match and mixed-match situations. In Figure 29, the differences in color estimation according to single adaptation and mixed adaptation of colors evaluated under high illuminance are shown.
The hue of the GB test color was found to be more bluish in the mixed adaptation than in the single adaptation for both luminance levels. Under high-luminance lighting, four out of ten colors appeared significantly brighter in the mixed adaptation than in the single adaptation.
Effect of luminance level on Color appearance estimation
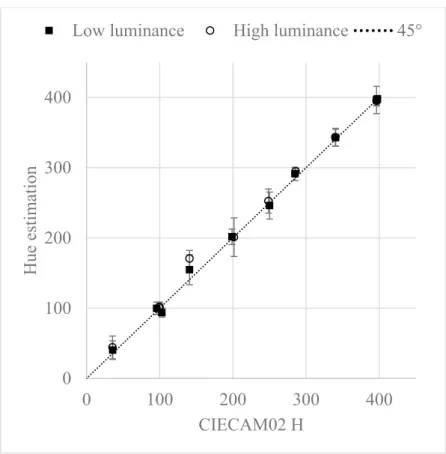
- Effect of luminance level on hue estimation
- Effect of luminance level on brightness estimation
- Effect of luminance level on colorfulness estimation
The change in appearance according to the level of luminance was examined regardless of the adaptation conditions. With the same fitting parameters, a trend line was calculated between Q and the value of the response refitted by the reference. The slope of the trend line at low luminance was 1.10, and the slope of the trend line at high luminance was 1.14.
The slope of the trend line at low luminance was 0.82, and the slope of the trend line at high luminance was 0.92. First, in hue estimation, a change of the test color YG towards green was observed at high luminance. In the estimation of the brightness, the luminance of the adaptation field increased by approx. 5 times, but the brightness of the test color at high luminance increased by approx. 3.73% compared to the low luminance.
It can be assumed that this is because people quickly adapted to the brightness of the lighting on site depending on their respective luminance. In the four lighting conditions, the performance of hue, brightness, and colorfulness estimation was calculated by CV. The color rendering change depending on luminance was compared with the predicted value of CIECAM02, one of the color rendering models.
This reflects the results of previous studies, where color appearance changes with luminance (Hunt, 1952).