저작자표시-비영리-변경금지 2.0 대한민국 이용자는 아래의 조건을 따르는 경우에 한하여 자유롭게
l 이 저작물을 복제, 배포, 전송, 전시, 공연 및 방송할 수 있습니다. 다음과 같은 조건을 따라야 합니다:
l 귀하는, 이 저작물의 재이용이나 배포의 경우, 이 저작물에 적용된 이용허락조건 을 명확하게 나타내어야 합니다.
l 저작권자로부터 별도의 허가를 받으면 이러한 조건들은 적용되지 않습니다.
저작권법에 따른 이용자의 권리는 위의 내용에 의하여 영향을 받지 않습니다. 이것은 이용허락규약(Legal Code)을 이해하기 쉽게 요약한 것입니다.
저작자표시. 귀하는 원저작자를 표시하여야 합니다.
비영리. 귀하는 이 저작물을 영리 목적으로 이용할 수 없습니다.
변경금지. 귀하는 이 저작물을 개작, 변형 또는 가공할 수 없습니다.
Practical Development of Si Anodes for High-Energy Lithium Ion Batteries
Sujong Chae
Department of Energy Engineering (Battery Science and Technology)
Graduate School of UNIST
2019
[UCI]I804:31001-200000178510 [UCI]I804:31001-200000178510 [UCI]I804:31001-200000178510
Practical Development of Si Anodes for High-Energy Lithium Ion Batteries
Sujong Chae
Department of Energy Engineering
Abstract
Since the first commercialization of the lithium ion battery (LIB), LIB has played a significant role as a power source for electric devices. As increasing energy demands with the emergence of the electric vehicle and the energy storage system, improving the energy density of LIB has been recognized as one of the most important issue for battery researchers. Accordingly, the high-capacity materials have been investigated to break the theoretical capacity limit of current LIB chemistry with the carbonaceous anode and the lithium metal oxide cathode. In terms of the anode, silicon (Si) has received great attention because of its low discharge potential and 10 times greater theoretical capacity than the state-of-the-art graphite. However, the intrinsic hurdle of Si anodes, which is the huge volume expansion (300%) during battery operation, retards the application to the practical LIB.
Therefore, the concrete strategies for overcoming the challenge are required in order to improve the energy density with utilizing Si anodes. For over twenty years, the nanoengineering has considerably improved the electrochemical performance of the Si anode by alleviating the intensified stress and strain from the volume change. However, there is a significant gap between the nanoengineered Si anode in academic field and the commercial LIB system in terms of the synthesis of Si anode, the battery manufacturing, and the electrochemical cell design. In this regards, to implement the Si anodes in commercial LIBs, several commercial factors such as the scalability, the rational cost, and performance feasibility, should be considered at the beginning of the development. Accordingly, herein, I have covered a comprehensive review about the co-utilization of graphite and Si anodes for commercial LIBs, the development of high-capacity Si anode for commercial high energy LIB, the benchmarking comparison of industrially-developed Si anode, and finally the remaining issues regarding the practical implementation of Si anode.
In the Chapter 1, the graphite Specifically, the development of the Si anodes would be presented with physicochemical analysis, and the practical utilization of Si anodes for high-energy LIB would be discussed. Furthermore, in order to compare the performance of the developed Si anodes, benchmarking with industrial samples would be conducted with the electrochemical characterization and the failure mechanism analysis.
In chapter 2, the high-capacity Si anodes for commercial high energy LIB is proposed with Fe- Cu-Si composite. FeCuSi is built up with Si nanoparticles and numerous nano-sized metal silicides as a form of a secondary particle. In this design, the micron-sized secondary particle exhibits high tap density which is easy to handle in the battery manufacturing process, and the numerous voids between Si nanoparticles effectively accommodated volume expansion of Si. In addition, the metal silicides such as iron silicide and copper silicide reduced interparticle contact resistance between Si nanoparticles. To investigate the commercial feasibility, the graphite-blended electrode with FeCuSi composite was fabricated under the commercial standard. It exhibited the superior electrochemical
performances compared to industrially developed SiOxand FeSi anodes.
In chapter 3, the benchmark comparison of industrially developed Si anodes including Si nanolayer-embedded graphite composite, carbon-coated SiOx, Si-containing graphite/carbon composite, has been presented. The benchmarking comparison was performed in graphite-Si blending system (fixed reversible specific capacity of 420 mAh/g) under the industrial electrode density (> 1.6 g/cc), areal capacity (> 3 mAh/cm2), and a small amount of binder (3 wt%). In addition, the one-to-one comparison has included essential items of both material characterization including laser diffraction particle size analysis, BET surface area, tap density, SEM, and HR-TEM, as well as the electrochemical analysis including half-cell and full-cell tests with measuring electrode volume expansion. As a result, the Si nanolayer-embedded graphite composite exhibited a great compatibility with conventional graphite.
In chapter 4, I discuss the critical issues of the practical implementation of Si anode in high- energy LIBs. The electrochemical cell design has been systematically presented with proper examples. I emphasize that the influence of the electrochemical cell design on the battery performances when aimed at high volumetric energy density. In addition, based on the electrochemical design, the limit on the electrode swelling of Si anodes in terms of energy density is suggested. Furthermore, the origin of differences in the capacity fading between in the half-cell and in the full-cell is carefully figured out. Finally, I propose the potential future direction regarding with the electrode swelling, the capacity fading, and the feasibility study.
Contents
Abstract List of Figures List of Tables List of publications
Chapter I – Integration of Graphite and Si Anodes for the Commercialization of High-Energy
Lithium-Ion Batteries ---1
1.1 Introduction------2
1.2 Necessity for co-utilization of graphite and Si in commercial level---3
1.3 Research progress in co-utilization of graphite and Si ---9
1.4 Critical factors for co-utilization of graphite and Si---35
1.5 Conclusion and outlook---42
1.6 References ------44
Chapter II – Micron-Sized Fe-Cu-Si Ternary Composite Anodes for High Energy Li-ion Batteries ---58
2.1 Introduction ---59
2.2 Experimental detail ---60
2.3 Results and discussion ---63
2.4 Conclusion---79
2.5 References ------80
Chapter III – One-to-one Comparison of Graphite-blended Negative Electrodes using Silicon Nanolayer-embedded Graphite versus Commercial Benchmarking Materials for High-energy Lithium-ion Batteries ---84
3.1 Introduction ---85
3.2 Experimental detail---87
3.3 Results and discussion ---89
3.4 Conclusion---104
3.5 References ------106
Chapter IV – Confronting Issues of the Practical Implementation of Si Anode in High-energy Lithium-ion Batteries ---109
4.1 Introduction ---110
4.2 Results and discussion ---113
4.3 Conclusion and outlook ---127
4.4 References ------129
Acknowledgements----135
List of Figures
Chapter 1
Figure 1. 1. Schematic illustration for the failure mechanism of Si anodes.
Figure 1. 2. Algorithm of the electrochemical cell design, from the demand of customer to the full-cell assembly/evaluation. Copyright: Elsevier, 2017.
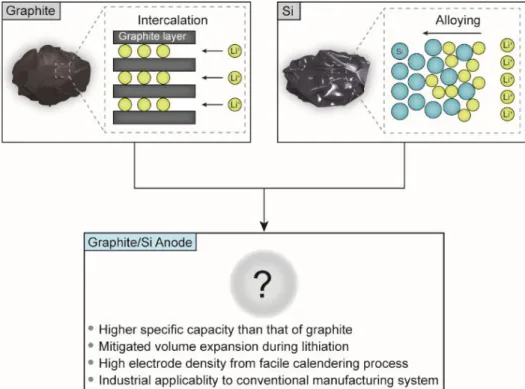
Figure 1. 3. Schematic illustration for graphite/Si anode. The co-utilization of graphite and Si strengthens the advantages and makes up for the weakness of graphite and Si, in short, demonstrating their synergy effects.
Figure 1. 4. The relationship between Si amount in the anode and the specific volumetric capacity, where the electrode includes 5 wt% of binder and no conductive materials. Copyright: Nature Publishing Group, 2016.
Figure 1. 5. Schematic illustration of various synthetic methods for graphite-blended Si anode and graphite/Si composite
Figure 1. 6.SiOXand Si-metal alloys for graphite-blended Si anode. a) TEM images and selective area electron diffraction patterns (SAED) of granulated SiOXparticle. b) Discharge capacities of graphite- blended SiOXin full-cell for 200 cycles. Copyright: Elsevier, 2014. c-e) Cross-sectional SEM images of Ti-Si binary alloy@porous Si core-shell (C/S) composites annealed at (c) 600 °C, (d) 700 °C, and (e) 800 °C, respectively. Inset gives the magnified images. f) Discharge capacities versus cycle numbers showing effects of annealing temperature. g) Discharge capacities of blended electrodes including MAE600 and graphite (SG1 and SG2). h) Discharge capacities of blended electrodes including MAE600 and SG1 with various ratio (A: 35/65, B: 45/55, and C: 55/45). Copyright: Elsevier, 2015.
Figure 1. 7.3M Si alloy (V6) for graphite-blended Si anode. a), b) SEM images of (a) uncalendered and (b) calendered V6 electrodes, respectively. c) Discharge capacities of uncalendered and calendered V6 electrodes. d), e) SEM images of (d) uncalendered and (e) calendered V6/SFG6L electrode,
cell building with Li(Ni1/3Mn1/3Co1/3)O2 cathode and pre-lithiated anode over 300 cycles. Copyright:
Royal Society of Chemistry, 2017.
Figure 1. 9. Fe-Cu-Si ternary composites (FeCuSi). a) Schematic illustration of the structure of FeCuSi and its synthetic process. b) Particle size distribution of FeCuSi. c) SEM image of FeCuSi. d) Magnified cross-sectional HAADF-STEM image of FeCuSi and elemental analysis at Si and metal silicides phase in FeCuSi particle. e) Voltage profiles of graphite-blended FeCuSi and other benchmarking samples (C- SiOX, and FeSi2) at the first cycle. f) Discharge capacities and cycling CEs of the graphite-blended anodes for 50 cycles in half-cell configuration. g) Discharge capacities and cycling CEs of the graphite- blended anodes with LiCoO2cathode for 300 cycles. Copyright: Royal Society of Chemistry, 2016.
Figure 1. 10. Graphite/Si composite fabricated by ball-milling. a) SEM image of the graphite/Si composites (C0.8Si0.2). b) HR-TEM image of the ball-milled graphite for 150 h. c) HR-TEM image of the ball-milled C1-XSiX composite. d) HR-TEM image at the surface region of ball-milled C1-XSiX
composites. e) Discharge capacities of ball-milled C1-XSiX (x=0, 0.1, 0.2, and 0.25) and unmilled C0.6Si0.4. Copyright: the Electrochemical Society, 1998.
Figure 1. 11. Natural graphite/Si/pitch composite by ball-milling. a), b) SEM images of Si-coated natural graphite composites. c) Cross-sectional view of Si-coated natural graphite composites, where the homogeneous and smooth coating layer of Si was formed on the graphite. d) XRD pattern of the natural graphite/Si/pitch composite. e) dQ/dV plots for the 1stand 2ndcycles. f) Discharge capacities in the prototype full-cell system for 300 cycles. Copyright: Elsevier, 2011.
Figure 1. 12. Si/inactive matrix/graphite composites by ball-milling. a) Schematic illustration of fabrication process of Si/SiOx/C composite. Copyright: Royal Society of Chemistry, 2017. b) Schematic illustration of fabrication process of FeSi2/Si@C composite. Copyright: American Chemical Society, 2012. c) Schematic illustration of the fabrication process for SiO/Ni/graphite composites.
Copyright: Wiley-VCH, 2015. d) Schematic illustration of the synthetic process for nanostructured P- doped Si/graphite composite. Copyright: American Chemical Society, 2017.
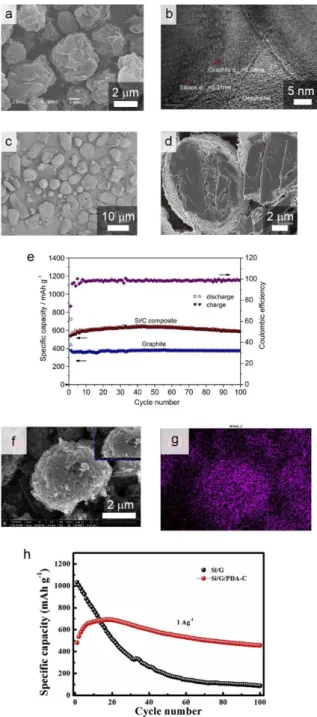
Figure 1. 13. Graphite/Si composites fabricated by spray drying. a), b) SEM and TEM image of graphite/Si@reGO composite. Copyright: Elsevier, 2013. c) SEM image of Si/C composites. d) Magnified cross-sectional image of Si/C composites. e) Discharge capacities and cycling CEs of Si/C composites, demonstrating its comparability with that of graphite. Copyright: Elsevier, 2014. f) SEM image of Si/G/PDA-C composites. g) EDS mapping image of N for Si/G/PDA-C composites depicting the presence of the polydopamine on the surface. h) Discharge capacities of Si/G and Si/G/PDA-C composites. Copyright: Elsevier, 2016.
Figure 1. 14. Si/C microspheres fabricated by spray drying with Si nanoparticles and ball-milled flake graphite. a) Schematic illustration of the overall structure of watermelon-inspired Si/C microsphere. b) SEM image of hierarchical buffer structured Si/C microspheres. The inset gives the magnified SEM
image of the single microparticle. c) Voltage profiles of Si/C microsphere at the first cycle. d) Areal capacities of Si/C microsphere for 500 cycles. Copyright: Wiley-VCH, 2017.
Figure 1. 15. Graphite/Si composites fabricated by CVD. a), b) SEM images of (a) pristine MCMB and (b) Si-coated MCMB. c) Raman spectra of pristine and Si-coated MCMB. d) Discharge capacities with different treating temperature of Si coating on MCMB. Copyright: Elsevier, 2004.
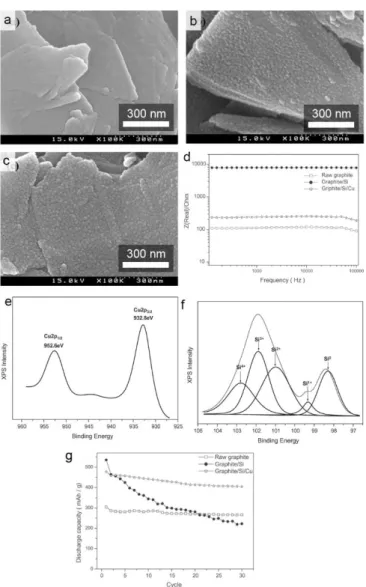
Figure 1. 16. copper silicide-coated graphite fabricated by PECVD and RF magnetron sputtering. a-c) SEM images showing the surface of (a) raw graphite, (b) Si-coated graphite, (c) copper silicide-coated graphite, respectively. d) AC current plot the conductivity for raw graphite, Si-coated graphite and copper silicide-coated graphite. e), f) XPS spectra of copper silicide-coated graphite for (e) Cu 2p and (f) Si 2p. (g) Discharge capacities of raw graphite, Si-coated graphite and copper silicide-coated graphite for 30 cycles. Copyright: Elsevier, 2006.
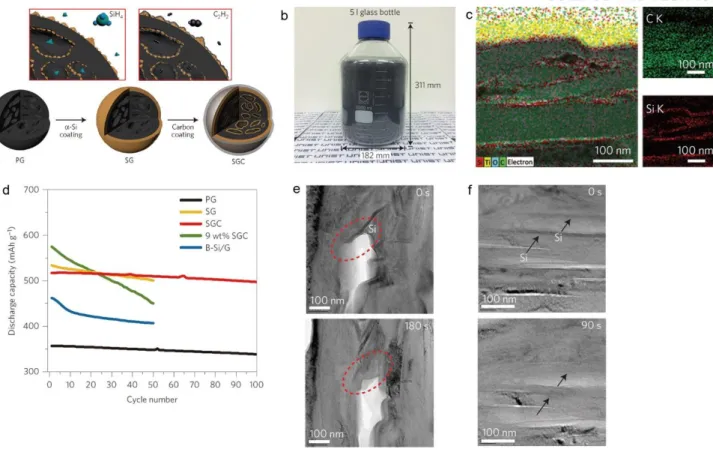
Figure 1. 17. Si-nanolayer-embedded graphite/carbon (SGC) composite. a) Schematic illustration of the fabrication process of SGC composite. b) Photograph of the fabricated SGC composite per batch.
c) Cross-sectional STEM image for EDS mapping of SGC composite. d) Discharge capacities of SGC composite for 100 cycles, containing PG, SG, 9wt% SGC, and B-Si/G. e,f) Captured in situTEM images for expansion of Si (e) on the surface of empty space and (f) between graphite layer, respectively.
Copyright: Nature Publishing Group, 2016.
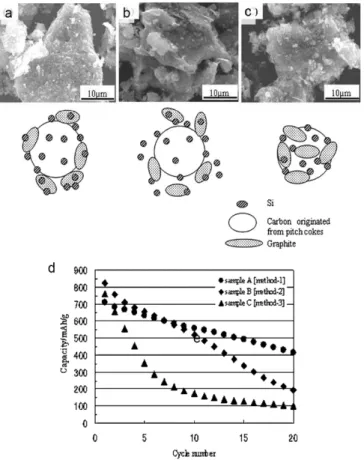
Figure 1. 18.The optimized structure of Si/carbon/graphite composite vialiquid solidification method.
a-c) SEM images with schematic morphologies for composites accoding to the different mixing order of Si, graphite, and pitch. d) Electrochemical cycle performance showing the effect of mixing order of Si, graphite, and pitch. Copyright: the Electrochemical Society, 2006.
Figure 1. 19.Graphite/Si composites fabricated by liquid solidiciation method. a) HR-TEM image at the interfacial region of Si-C-G composites. b) HR-TEM image at the boundaries between Si and amorphous carbon coating layer of Si-C-G composites, with FFT patterns (inset). Copyright: American
CSG. a-f) Cross-sectional views before cycling and after 50 cycles with magnified images.
Figure 1. 23.A Schematic illustration of electrode swelling behavior depending on Si distribution.
Chapter 2
Figure. 2. 1.Schematic illustrations of FeCuSi and its synthesis. (a) Simplified two-dimensional cross- section view of FeCuSi. Silicon nanoparticles build up the secondary particle with metal silicides which can improve electrical conductivity and structural stability. (b) Fabrication process of FeCuSi.
Figure. 2. 2.Characterization of FeCuSi. (a) SEM image of FeCuSi. (b) Magnified cross-sectional SEM images of FeCuSi.(c) Statistical analysis for the size distribution of FeCuSi. (d) Volume comparison between 1 g of FeCuSi and conventional Si nanoparticles after measuring tap density. (e) X-ray diffraction patterns of FeCuSi as a function of heating temperature.
Figure 2. 3.SEM image of amorphous silicon nanoparticles which were synthesized through chemical vapor deposition (CVD) of monosilane (SiH4).
Figure 2. 4. Pore size distribution of FeCuSi. The derivative volume with respect to the pore diameter shows where clusters of pores of a particular diameter occur.
Figure 2. 5. Crystallite sizes of FeCuSi with different heating temperatures.
Figure. 2. 6.Detailed investigation of FeCuSi with TEM analysis. (a) HAADF-STEM image and EDS mapping of FeCuSi in cross sectional view. Cyan, red, and yellow indicate Si, Fe, and Cu respectively.
(b) Magnified HAADF-STEM image of FeCuSi and EDS point analysis for Si nanoparticle, iron silicide, and copper silicide.
Figure 2. 7.EDS line scan of FeCuSi. (a) Magnified HAADF-STEM image of FeCuSi. (b) Element profile according to line scanning in (a).
Figure 2. 8. Electrochemical characterization of FeCuSi with benchmarking samples in half-cell. (a) Voltage profiles of FeCuSi, C-SiOx, and FeSi2 at the formation cycle. (b) Reversible capacities of FeCuSi, C-SiOx, and FeSi2for 50 cycles. The formation cycle (a) and cycling test (b) were carried out at a rate of 0.1C and 0.5C, respectively. (1C was set as 1.3 A/g, 1.1 A/g and 1.7 A/g for FeCuSi, C-SiOx, and FeSi2, respectively.) All electrochemical tests were performed at 25 oC in 2032R coin-type cell.
Figure 2. 9. Optimization for heating temperature of FeCuSi. (a) Reversible capacities of FeCuSi as a function of heating temperature. (b) Coulombic efficiencies of FeCuSi with diverse heating temperature.
FeCuSi with 860 oC of heating temperature was optimized one.
Figure. 2. 10. Electrochemical characterization of FeCuSi anode with benchmarking samples in half- cell (a, b) and full-cell (c, d) and measurement of the thickness change of electrode (e). (a) Voltage profiles of FeCuSi, C-SiOx, and FeSi2at the formation cycle. (b) Reversible capacities and cycling CEs of FeCuSi, C-SiOx, and FeSi2 for 50 cycles. The formation cycle (a) and cycling test (b) in half-cell were carried out at a rate of 0.1C and 0.5C, respectively. (1C = 0.42 A/g.) (c) Voltage profiles of full- cell systems with LCO and different anodes of FeCuSi, C-SiOx, and FeSi2at the formation cycle. (d) Reversible capacities and cycling CEs of the full-cells for 300 cycles with 1C. The formation cycle (c) and cycling test (d) in full-cell were carried out at a rate of 0.1C and 1C, respectively. (1C = 3.0 mA/cm2) All electrochemical tests were performed at 25 °C in 2032R coin-type cell. (e) The change of electrode thickness of graphite, FeCuSi, C-SiOx, and FeSi2at lithiated state during 30 cycles. Electrode thickness at the lithiation state were measured with a micrometer after disassembling coin cells in Ar-filled glove box.
Figure 2. 11. Electrochemical properties of LCO. (a) Voltage profile of LCO at the formation cycle. (b) Reversible capacities of LCO for 100 cycles with 0.5C. The formation cycle (a) and cycling test (b) were carried out at a rate of 0.1C and 0.5C, respectively. (1C = 0.18 A/g) All electrochemical test were performed at 25 oC in 2032R coin-type cell.
Figure 2. 12. Various voltage profiles of FeCuSi (a), C-SiOx (b), and FeSi2 (c) plotted for 1st, 100th, 200th, and 300thcycle.
Chapter 3
Figure 3. 1. Material characterization of pristine SGC and benchmarking samples. Benchmarking comparison for physical properties with a) particle size distribution, citing D10, D50, and D90, b) specific surface area based on BET theory, and c) tap density after mechanically tapping a container.
Morphological comparison of C-SiOx(d-g), Si-G/C (h-k), and SGC (l-o), using SEM images with top
d-f) Various voltage profiles of (d) G/C-SiOx, (e) G/Si-G/C, and (f) G/SGC at the first, fiftieth, and hundredth cycle.
Figure 3. 4.Electrochemical performances of high-voltage LCO in half-cell. a) Voltage profile at the first cycle. b) Cycling performances at the charge/discharge rate of 0.5C. c) Voltage profiles at second, fiftieth, and ninetieth cycle. The surface modified LCO was used to improve structural stability even beyond 4.45 V. It showed high reversible specific capacity of 183 mAh/g with first cycle CE of 97.9%
and capacity retention of 92.1% at ninetieth cycle in the voltage range of 4.45-3 V.
Figure 3. 5.Electrochemical performances of G/C-SiOx, G/Si-G/C, and G/SGC in the prototype full- cell high-energy-density batteries. a) Voltage profiles of the prototype full cells at the first formation cycle. b) Cycling performances at the charge/discharge rate of 0.5C with CE plots for 400 cycles. Inset shows magnified areal capacity versus cycle number plotted for the early cycles. c) Rescaled form of CE at each cycle from 99 to 100% for 100 cycles. d-f) Voltage profiles of the prototype full cells at the first, hundredth, two-hundredth, and four-hundredth cycle.
Figure 3. 6.Electrode volume expansion after cycling and estimation of volumetric energy density. a- l) SEM images of the electrodes composed of (a-d) G/C-SiOx, (e-h) G/Si-G/C, and (i-l) G/SGC from top and cross-sectional views, describing the structural change of the electrodes before and after the cycling. m) ex-situ measurement of electrode volume expansion after cycling. n) Volumetric energy densities before and after 400 cycles.
Figure 3. 7.Morphological changes of (a-d) SiOx, (e-h) Si-G/C, and (i-l) SGC in the graphite-blended electrode after 400 cycles. a, e, i) SEM images of the Si composite on the electrodes cycled for 400 cycles. b, f, j) Cross-sectional images of SiOx, Si-G/C, and SGC after 400 cycles with EDS mapping (c, g, k). F, C, and Si are indicated by yellow, green, and red, respectively. d, h, l) HR-TEM images at the interfacial region.
Chapter 4
Figure 4. 1. Overview of the challenges and representative strategies associated with the Si anode. (a) Intrinsic properties of Si disadvantageous to charge transfer kinetics and to stable cycling behavior. (b) Unfavorable phenomena in the Si anode causing the active material loss and consumption of lithium ion in the cell. (c) Various representative strategies for addressing the unfavorable phenomena such as size control, surface coating, active/inactive alloy, void space engineering, and composite.
Figure 4. 2. Flow chart of the electrochemical cell design. The brief procedure of the electrochemical
assembly/evaluation.
Figure 4. 3.Photographs of the pouch-type full-cell with the cell capacity of 1.2 Ah. (a) Double-sided cathode and anode for stack type pouch cell. (b) Stacking type pouch cell with the dimension of 70 mm
* 90 mm * 2.5 mm. (c) Cross sectional photograph of the pouch cell.
Figure 4. 4. The relationship between the energy density and the electrode swelling and the measurement of the electrode swelling. (a) Energy density plot of Graphite/HVLCO and graphite- blended Si anode/HVLCO full-cells as a function of the electrode swelling. (b) The limits of electrode swelling in different specific capacities of graphite-blended Si anode where the energy density of graphite-blended Si anode and graphite become the same. The electrode swelling of graphite is set as 20%. (c) Electrode porosity versus electrode density in graphite. The electrode porosity is estimated with the true density of graphite, binder, and conductive agents. (d) Ex situmeasurement of the electrode swelling by micrometer and microscope. (e) In situ measurement of the electrode swelling with electrochemical dilatometry.
Figure 4. 5.The causes of the difference in the capacity fading between the half-cell and the full-cell.
(a) Contrasting lithium sources in the half-cell and in the full-cell. The cyclable lithium is infinitely supplied from the lithium metal in the half-cell, whereas the supply is limited to the capacity of the cathode in the full-cell. (b) Different voltage behaviors between the half-cell and the full-cell. While the cut-off voltages and SOC are fixed with the lithium metal reference/counter electrode, the cut-off voltages and SOC shift as a result of the degradation. (c) The difference in the amounts of the electrolyte for the coin-type half-cell and for the commercial full-cell such as a pouch-type cell. The coin-type cell for the half-cell test is generally filled with the excessive amount of the electrolyte, on the other hand, the commercial cell such as pouch-type cell contains the limited amount of the electrolyte.
List of Tables
Chapter 1
Table 1. 1.Parameters of various Si anodes regarding the volumetric energy density
Chapter 2
Table 2. 1. The peak list of Fe, Cu, Si, FeSi2, and Cu3.17Si with the index from the XRD analysis. The references of Fe, Cu, Si, FeSi2, and Cu3.17Si are ICSD 631729, 627117, 43403, 24360, 160694, respectively.
Table 2. 2.Summary of electrochemical performance of FeCuSi and benchmarking samples
Chapter 3
Table 3. 1.Battery testing protocols for the half-cell and the full-cell.
Table 3. 2. Volumetric energy density estimation
Table 3. 3. Summarized electrochemical performances of C-SiOx, Si-G/C, and SGC in half- and full- cell
Chapter 4
Table 4. 1.Detailed electrochemical cell designs for graphite and graphite-blended Si anodes
List of publications
I contributed to the following publications during my PhD course.
Peer-reviewed publications
1. Nam, G.; Son, Y.; Park, S. O.; Jeon, W. C.; Jang, H.; Park, J.; Chae, S.; Yoo, Y.; Ryu, J.; Kim, M. G., A Ternary Ni46Co40Fe14 Nanoalloy-Based Oxygen Electrocatalyst for Highly Efficient Rechargeable Zinc–Air Batteries. Adv. Mater. 2018, 1803372.
2. Han, J.-G.; Lee, J. B.; Cha, A.; Lee, T. K.; Cho, W.; Chae, S.; Kang, S. J.; Kwak, S. K.; Cho, J.; Hong, S. Y., Unsymmetrical fluorinated malonatoborate as an amphoteric additive for high-energy- density lithium-ion batteries. Energ Environ Sci 2018.
3. Lee, M.-J.; Lho, E.; Bai, P.; Chae, S.; Li, J.; Cho, J., Low-temperature carbon coating of nanosized Li1. 015Al0. 06Mn1. 925O4 and high-density electrode for high-power Li-Ion batteries.
Nano letters 2017,17(6), 3744-3751.
4. Kim, N.; Chae, S.; Ma, J.; Ko, M.; Cho, J., Fast-charging high-energy lithium-ion batteries via implantation of amorphous silicon nanolayer in edge-plane activated graphite anodes. Nature communications 2017,8(1), 812.
5. Chae, S.; Ko, M.; Kim, K.; Ahn, K.; Cho, J., Confronting issues of the practical implementation of Si anode in high-energy lithium-ion batteries. Joule 2017,1(1), 47-60.
6. Chae, S.; Kim, N.; Ma, J.; Cho, J.; Ko, M., One-to-One Comparison of Graphite-Blended Negative Electrodes Using Silicon Nanolayer-Embedded Graphite versus Commercial Benchmarking Materials for High-Energy Lithium-Ion Batteries. Adv. Energy Mater. 2017,7(15), 1700071.
7. Ko, M.; Chae, S.; Ma, J.; Kim, N.; Lee, H.-W.; Cui, Y.; Cho, J., Scalable synthesis of silicon- nanolayer-embedded graphite for high-energy lithium-ion batteries. Nature Energy 2016,1(9), 16113.
8. Chae, S.; Ko, M.; Park, S.; Kim, N.; Ma, J.; Cho, J., Micron-sized Fe–Cu–Si ternary composite anodes for high energy Li-ion batteries. Energ Environ Sci 2016,9(4), 1251-1257.
9. Son, Y.; Son, Y.; Choi, M.; Ko, M.; Chae, S.; Park, N.; Cho, J., Hollow silicon nanostructures
13. Ko, M.; Chae, S.; Cho, J., Challenges in accommodating volume change of Si anodes for Li- ion batteries. ChemElectroChem 2015,2(11), 1645-1651.
14. Park, M.-H.; Noh, M.; Lee, S.; Ko, M.; Chae, S.; Sim, S.; Choi, S.; Kim, H.; Nam, H.; Park, S., Flexible high-energy Li-ion batteries with fast-charging capability. Nano letters 2014,14(7), 4083- 4089.
15. Ko, M.; Chae, S.; Jeong, S.; Oh, P.; Cho, J., Elastic a-silicon nanoparticle backboned graphene hybrid as a self-compacting anode for high-rate lithium ion batteries. Acs Nano 2014,8(8), 8591-8599.
16. Kim, C.; Ko, M.; Yoo, S.; Chae, S.; Choi, S.; Lee, E.-H.; Ko, S.; Lee, S.-Y.; Cho, J.; Park, S., Novel design of ultra-fast Si anodes for Li-ion batteries: crystalline Si@ amorphous Si encapsulating hard carbon. Nanoscale 2014,6(18), 10604-10610.
Chapter 1
Integration of Graphite and Si Anodes
for the Commercialization of High-Energy Lithium-Ion Batteries
Abstract: Silicon (Si) has been considered as the most promising anode material for overcoming the theoretical capacity limit of a carbonaceous anode. Since the implementation of nanotechnology on Si anode, the significant progress has been made as addressing severe volume change during (de)lithiation.
However, the practical application of Si anodes in commercial lithium-ion batteries (LIBs) has been still stagnant. Nowadays, with the drastic increase in energy demands of diverse industries, co- utilization of Si and graphite has resurfaced as the commercially viable method for realizing high energy.
Herein, we highlight the necessity for the co-utilization of graphite and Si in terms of the commercialization, and carefully review the development of graphite/Si anodes. Representative Si anodes implemented in the graphite-blended electrode are covered and a variety of strategies for building graphite/Si composites are organized according to their synthetic method. Particularly noteworthy, the critical factors for the co-utilization of graphite and Si are systematically presented.
Finally, we provide insightful suggestions with regard to the co-utilization of graphite and Si for the commercialization.
Chapter 1 will be submitted to “Angewandte Chemie” in Dec. 2018.
1. 1. Introduction
Since the first commercialization of Li-ion batteries (LIBs), LIBs have been played an essential role in providing power to diverse cordless electric devices.1-4The enormous interest on high-tech electrical vehicles and electronics have constantly stimulated to improve the energy density of LIB.5-7As the battery technology regarding manufacturing process and material science has grown into maturity, the energy density has been marvelously increased. However, the conventional LIB system, which is comprised of lithium transition metal oxide and a carbonaceous material as cathode and anode respectively, is now facing the theoretical limit of the energy density. Therefore, the progress of LIB system through the material paradigm shift from conventional intercalation chemistry becomes highly desired for the further improvement of energy density.8-12
Among the alloy-type anode, Si has been vigorously investigated as one of the most promising active materials because of its ten times higher gravimetric capacity than that of conventional graphite (3579 mAh g−1for Si and 372 mAh g−1for graphite).13-16Its abundance and low working voltage (~0.2 V vs.
Li/Li+) consolidate a preeminent position as a next-generation anode.17-19However, its direct utilization is hampered by the huge volume change of Si (> 300%) during (de)alloying with Li, which causes fracture of Si and electrode deformation with swelling (Fig. 1.1).20-23The pulverization of Si caused by its repeated fracture accompanies the electrical isolation.24In addition, the ceaseless side reaction with electrolytes occurs at the newly exposed surface and consumes confined Li+ ions, resulting in the excessive formation of solid electrolyte interphase (SEI) layer during cycling.25-27Consequentially, the accumulated SEI layer increases the internal resistance of the cell.28-29 From these unfavorable phenomena from severe volume change, the electrochemical performances of Si anode are significantly deteriorated.28, 30-31Besides, with respect to the electrode level, the rearrangement of the components in the electrode would bring about the electrical isolation of Si by the disconnection from the current collector.18, 32The electrode swelling could also squeeze the electrolyte filled in the pore of the separator, which blocks the transportation of Li-ion.33Even worse, the severe electrode swelling causes the bulge of the cell package, which raises the safety concern.34
Figure 1. 3. Schematic illustration for the failure mechanism of Si anodes.
To address the issue of severe volume expansion, numerous efforts have been devoted to investigating the electrochemical and the mechanical behaviors of Si anode. Notably, reducing the particle size of Si to nano-size can prevent the crack evolution by alleviating the stress/strain, leading to the era of nano- structuring.20, 35-36 A variety of nano-engineered Si anodes, such as nanoparticles,37-38 nanowires,39 nanotubes,40and void-contained structures like yolk-shell,41-44have achieved significant improvement in cycling stability.45With these promising strategies, the practical application for high-energy LIB has been regarded as next agenda. Several studies have reported their industrial feasibilities with their scalable synthesis, high tap density, high-mass loading, high electrode density, improved volumetric energy density and so on.35, 42, 46-48However, the sole uitlization of Si is regarded as practically difficult to improve the volumetric energy density because of their large requirements of binder and conductive agent and severe electrode swelling.10, 49In this regards, the co-utilization of graphite, which is the most popular anode among various carbonaceous materials, and Si have been deemed as the best method for the current commercial LIB system to realize high-energy cell with Si anode.49-52The co-utilization would combine the established battery technology of the graphite anode with the innovative development of Si anodes, making a synergy.
In contrast to the previous reviews about Si anodes which mainly focused on the nanostructures of Si,53-55herein, we will first cover the co-utilization of graphite and Si anodes for the commercialization of high-energy LIB. First of all, the necessity for the co-utilization of graphite and Si will be discussed in the practical point of view. Then, we will systematically review the graphite/Si anode for high volumetric energy density, specifically divided into the graphite-blended Si anode and the graphite/Si composite anode. Besides, the critical considering factors for the development of graphite/Si anodes will be presented deliberately with the simple experimental demonstration.
1. 2. Necessity for co-utilization of graphite and Si in commercial level
For decades, the battery research is constantly aiming at reducing the size/weight of battery, increasing the energy of battery with low cost,56-57and extending the cycle life.10, 58The pioneering work
volumetric energy density, the development in the electrochemical cell design factors, such as the areal capacity, electrode density, electrode swelling, and average voltage, should be enhanced instead of just increasing the specific capacity (Fig. 1. 2). Improving the volumetric energy density is practically hindered by the influence of the factors on the battery performance such as cycle life and rate capability.
Therefore, the imprudent increase of the cell design factor can deteriorate the battery performance and even lower the volumetric energy density as well.10The innovative active material can overcome the limit of those factors and achieve high volumetric energy density along with great performances.47, 49
Figure 1. 4. Algorithm of the electrochemical cell design, from the demand of customer to the full- cell assembly/evaluation. Copyright: Elsevier, 2017.
Recently, as an investigation for the commercial viability, several studies focus on areal capacity with high mass loading or high electrode density. However, they focused on the particular factor, and frequently miss the other key factors for estimating volumetric energy density, such as areal capacity (or areal current density), loading level, electrode thickness, electrode density, electrode swelling, and average voltage. We summarized the information of various Si anodes for recent three years (Table 1.1).
We noted several values by the range depending on the different electrode fabrication for specific electrochemical testing.
Because of the scarce information regarding the average voltage of Si anodes and the difference in the cathode for the full-cell systems, the comparison of the volumetric energy density can be guessed with the areal capacity (mAh/cm2), the volumetric capacity (mAh/cc), and the electrode swelling (%).
The areal capacity reflects the volume/mass fraction of other battery components. In other words, it indicates that the high areal capacity decreases the volume/mass fraction of other components, thus leading to increase in the volumetric energy density. The volumetric capacity implies how densely the electrode is fabricated with specific capacity, and the electrode swelling shows how much the electrode would occupy additional volume during cycling. The high volumetric energy density can be obtained when improving all these electrochemical design factors together. For the commercial graphite as a standard, it is acknowledged that the areal capacity, the volumetric capacity, and the electrode swelling are about 3.3 mAh/cm2, about 570 mAh/cc (360 mAh/g for the specific capacity and 1.6 g/cc for the electrode density), and maximum 20%, respectively.
Unfortunately, the majority of Si anodes without graphite demonstrated high specific capacity, however they didn’t get high areal capacity and high volumetric capacity at the same time. Owing to the electrode instability from severe volume expansion and low electrical conductivity of Si anodes, achieving high areal capacity by high mass loading could bring about poor battery performances, and the severe side reactions of Li counter electrode at high current density could shorten the cycle life drastically in the half cell. In addition, there is no information about electrode thickness or electrode
electrochemical performances such as low irreversible capacity, robust cycle life, good rate capability, low volume expansion upon lithiation (~10%), and high electrical conductivity.8, 78-79 In this regard, making a sacrifice of specific capacity, the addition of graphite can compensate the defect of Si anode by imparting electrical conductivity to the Si anode,80-81mitigating the severe electrode swelling with its low volume change, and improving almost the whole electrochemical performances even with its low prices (Fig. 1. 3).82 In addition, the slippery and deformable properties of graphite allow the graphite/Si anode to be easily calendered for high electrode density with preventing severe damage of brittle Si, which effectively improves the volumetric energy density.9, 49 Finally, the most attractive advantage for the commercialization in the near future is that the co-utilization of graphite and Si anode is readily adaptable to the established battery manufacturing process which numerous efforts and huge financial investment have been already dedicated to.12, 57
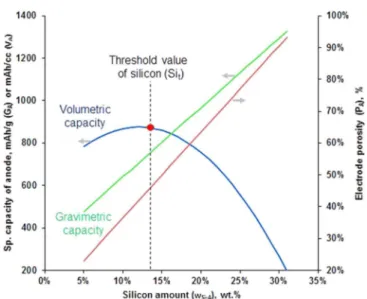
Improving the volumetric energy density with only Si anode is considered as theoretically impossible due to the significant volume expansion of Si. Recently, the theoretical limit of energy density in graphite/Si anode was investigated with a rational model. The theoretical model is based on the practical standard that the increase in the external dimensions of LIB is not allowed beyond 5% of the swelling limit. Depending on the anode porosity at lithiated state and the amount of conductive material and binder, the weight fraction of Si for the highest energy density can be changed, but its maximum value is limited to only 11.68 wt% in the ideal case (no conductive material and binder, and 0% anode porosity at lithiated state). The relationship between volumetric capacity and the weight fraction of Si is presented in Figure 1. 4as an example.51In this regard, co-utilizing graphite and Si is a rational way to improve the energy density instead of using Si anode only.
Active materials Graphite- included
Specific capacity (mAh g−1)
Initial CE (%)
Electrode composition[a]
(AM:BM:CM) Areal capacity (mAh cm−2)
Loading level (mg cm−2)
Electrode thickness ( m)
Electrode density (g cc−1)
Electrode swelling (%)
Mesoporous a-Si61 none 1679 64.6 60:15:25 1.24 0.7-1.2 - - -
Si nanosheet62 none 1780 79.4 70:15:15 - - - - -
Si/CNT/BTO63 none 2204 86.2 90:10:0 - - - - -
Si/carbon/graphite64 included 712 79.8 80:10:10 - 1.5 30 -
16.7%
@ 1 cycle and 33.3% @50 cycles
RGO-SiNPs65 none 1957 58 - 2.48 2.5 - - -
Fe-Cu-Si48 included 1287 91
80:10:10 for sole Si anode and 97:3:0 for graphite- blended electrode
1-3.44
1 for sole Si anode and 8.5 for graphite- blended electrode
- 1.6
49%
@ 30th cycle for graphite- blended electrode
SiMP@Gr66 none ~3300 93.2 90:10:00 4.5 0.8-2.5
15 (for 0.8 mg cm−2)
- 11%
@10 cyc
SGC47 included 517 92 95.8:3.2:1 3.3 6.5 42 1.6 38%
@100cyc Watermelon
Si/C67 included 620 89.2 90:5:5 2.54 4.1 37 1.1 30%
@100cyc
SEAG68 included 525 93.8 96:3:1 3.5 - - 1.6 -
Porous Si-C/
graphite52
included ~650 65 75:20:5 2.5-3 - 32 ~1.2 56%
@ 200 cyc
Silicene flower69 none 2000 74 80:10:10 - 0.9-1.5 13 - 7%
@ 100 cyc
Si@TiO270 none ~1562 65.8 70:15:15 - 0.8-2.1 14.7 1.4 -
d-SiO@vG71 none 1600 X(~75
%) 75:15:10 1.4 1.5 - - -
Si-PBI72 none 2133 60.27 80:10:10 - - 17 - 64.7%
@ 80 cyc
Si-SiOx-C 18%
Figure 1. 3. Schematic illustration for graphite/Si anode. The co-utilization of graphite and Si strengthens the advantages and makes up for the weakness of graphite and Si, in short, demonstrating their synergy effects.
Figure 1. 4. The relationship between Si amount in the anode and the specific volumetric capacity, where the electrode includes 5 wt% of binder and no conductive materials. Copyright: Nature Publishing Group, 2016.
1. 3. Research progress in co-utilization of graphite and Si
The co-utilization of graphite and Si can be carried out by blending the high-capacity Si anode with graphite in the electrode fabrication process or building the single graphite/Si composite (Fig. 1. 5). In this section, we have reviewed the research progress of graphite-blended Si anode and graphite/Si composite with diverse studies. The following extensive discussion on the research progress will allow researchers to better understand the development of graphite/Si anodes.
1. 3.1 Graphite-blended Si anodes
Considering practical application, various kinds of high-capacity Si materials have been investigated with fabricating the graphite-blended electrode. Here, we introduce several representative studies for graphite-blended Si anode including a combination between active Si and the inactive matrix such as silicon monoxide (SiOx)83-84, Si-metal alloys,85-88 and porous Si.52, 89 The studies have aimed at alleviating volume changes with following common strategies: 1) introduction of mechanical buffer matrix and 2) formation of void spaces for accommodating Si expansion. It is noted that the huge difference in volume change of active materials would result in electrical contact loss of graphite, leading to additional deterioration. Hence, the alleviation of volume expansion allows not only to secure cycling stability of high-capacity Si anodes, but also to improve the compatibility with the graphite.
It has been widely known that SiOxand Si-metal alloys exhibit high specific capacity of 1300-1500 and 800-1300 mAh g−1, respectively.83-88They effectively alleviate the volume change by surrounding nano-Si with mechanical buffer matrix (amorphous SiO2or metal silicides) on (de)lithiation. For SiOx, amorphous SiO2 generates undesirable irreversible byproducts including Li2O90 and Li4SiO4,91-92 so optimization of the oxygen contents in SiOxhas been a major issue to determine its cycling behavior.
For example, with granulated SiOxparticle (Fig. 1. 6a), S.-S. Suh et al. reported that the optimal amount of oxygen in SiOx is 1.06.93 Under high areal capacity (~3 mAh cm−2) and the high ratio of active materials (90 wt%), blending 3 wt% of SiO1.06with graphite demonstrated the initial specific capacity of 397 mAh g−1with capacity retention of 76% after 200 cycles in full-cell configuration (Fig. 1. 6b).
Similar with amorphous SiO2in SiOx, Si-metal alloys employ inactive silicide as a buffer matrix by the homogeneous formation of alloy phase in their structure, where the silicides contain both high mechanical stability and electrical conductivity.94-95 It is noticeable that the phase transition and crystallite size of silicide are strongly dependent on the annealing condition, which affects the electrochemical performance. S.-M. Lee and co-workers reported Ti-Si binary alloy@porous Si core- shell structure (C/S) composites.78 C/S composites were prepared by annealing Ti-Si alloys and following reaction with hydrofluoric acid to form porous Si at the interfacial region. As a result, C/S composites consist of a core which active Si and inactive binary silicide (TiSi2), and porous Si shell.
The formation of TiSi2 and the crystallite size of Si were tuned by annealing C/S composites at 600, 700 and 800 °C, which affected the pore sizes on the shell (Fig. 1. 6c-e) as well. The C/S composite annealed at 600 oC (denoted as MAE600) demonstrated the superior performance as shown in Figure 6f. To investigate the effect of the size of the graphite in the graphite-blended system, MAE600 was blended with spherical natural graphite SG1 (D50= 7 mm) and SG2 (D50= 12 mm) . MAE600 exhibited the initial specific capacity of 1006.2 mAh g−1with the initial efficiency of 83.4%. The graphite-blended MAE600 electrodes with SG1 and SG2 demonstrated the enhanced cycling stabilities by virtue of
graphite. Interestingly, the electrode with SG1 showed superior capacity retention than that of the electrode with SG2 during 50 cycles (Fig. 1. 6g). It was attributed to the similar particle size between MAE600 (D50 = 8 mm) with graphite, thereby leading to the uniform distribution of MAE600 and graphite in the electrode. This result implies that the compatibility of graphite and high-capacity Si anodes would have a considerable influence on the battery performances. Furthermore, it was obviously demonstrated that the cycle life was gradually improved as the content of graphite in the electrode increased (Fig. 1. 6h).
Besides, M. N. Obrovac and co-workers attempted to investigate the role of graphite in the graphite- blended Si anode where the commercial Si-based alloy, 3M alloy (L-20772 V6, denoted as V6), was utilized.9 Despite high cycle efficiency and stable microstructure of V6,50 calendering causes to the particle fracture (Fig. 1. 7a, b) and poor capacity retention as in Figure 1. 7c. Instead, in the graphite- blended electrode, the additional graphite (MAG-E and SFG6L) could buffer against calendering, thereby preventing particle fracture, mitigating volume expansion and enhancing cycling performance (Fig. 1. 7d, e). Therefore, even under high loading (4.5 mg cm−2) and mass ratio of active material (>
88 wt%), the graphite-blended electrodes achieved improved electrochemical properties and volumetric energy density, compared to the graphite-free V6 electrode (Fig. 1. 7f). Additionally, the smaller-sized SFG6L graphite, with average particle size of 3 mm, also improves the cycling performance, which is attributed to the homogeneous distribution and better interconnectivity among particles during calendering (Fig 1. 7g). As a result, V6/graphite electrode attained the estimated full-cell stack energy density approximately 15% higher than LiCoO2/graphite cell, confirming the possibility of commercial utilization (Fig 1. 7h). This work concretely shows the advantage of the co-utilization of graphite and Si for the practical implementation of Si anode with improved cycle life and volumetric energy density.
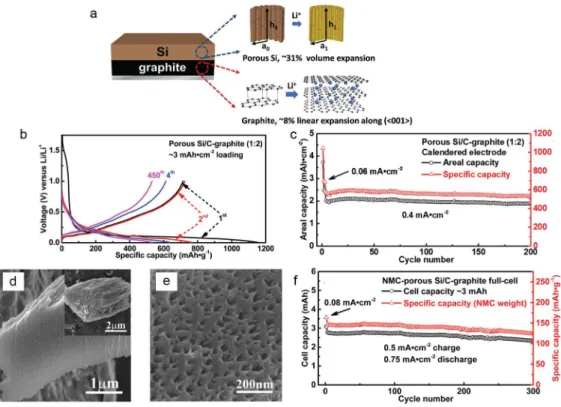
Porous Si has been also recognized as an attractive strategy in terms of accommodating volume expansion.96-97 As an investigation of the practical application, X. Li et al. fabricated the graphite- blended anode with their developed porous Si/C composite (Fig. 1. 8a).52They attempted to design the electrode which can satisfy below strict requirements: 1) higher specific capacity than graphite (372 mAh g−1); 2) high capacity retention (> 80% over ~500 cycles); 3) limited electrode swelling as low as graphite (~10%); 4) practical loading level (~3 mAh cm−2). The electrode, where the blending ratio of porous Si/C to graphite was 1:2, exhibited a specific capacity of ~650 mAh g−1with a high areal capacity (3 mAh cm−2) and low coulombic efficiency of ~63% (Fig. 1. 8b). Although there was a rapid capacity drop during early cycles, after then, it demonstrated excellent capacity retention of 90% over 200 cycles as shown in Figure 1. 8c. Interestingly, they inspected the effect of calendering on the porous Si/C composite. After the calendering process, the porous Si/C composite retained their own morphology (Fig. 1. 8d, e). However, in the calendered electrode, the polarization was increased by the reduced accessibility of the electrolyte, where only 85-90% of specific capacity was exhibited. Finally, with the graphite-blended electrode, the commercial feasibility of porous Si/C composite in the graphite-blended electrode was successfuly demonstrated with outstanding cycle life (>84% for 300 cycles) in the full- cell (Fig. 1. 8f), where the prelithiation was carried out for compensating the initial capacity loss.
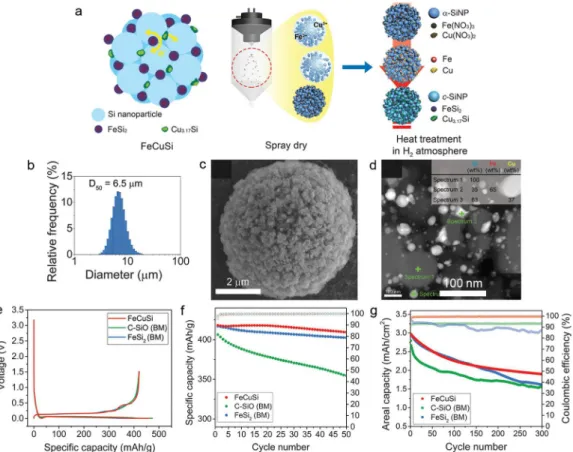
Recently, our group reported Fe-Cu-Si composites (FeCuSi) which were fabricated by spray drying and subsequent heat treatment (Fig. 1. 9a).48With the particle size (D50= 6.5 mm, Fig. 1. 9b) compatible to graphite, FeCuSi have spherical secondary particles where Si nanoparticles (< 150 nm) are
surrounded by metal silicides (FeSi2and Cu3.17Si) and void spaces (Fig. 1. 9c, d). Metal silicides act as glue binding Si nanoparticles to reinforce the secondary structure and reduce the volume change of each material by diluting the active phase. In addition, the high porosity in the secondary structure accommodates the volume expansion upon lithiation.35, 42FeCuSi exhibited the initial specific capacity of 1287 mAh g−1 with the high initial Coulombic efficiency of 91%. To investigate its commercial feasibility, the graphite-blended electrode was adopted to perform rational comparison with other benchmarking samples (SiO and FeSi2) under industrial standards such as high areal capacity (3.44 mAh cm-2), high electrode density (1.6 g cc−1), and large amounts of active materials (total 96 wt%).
By adjusting the blending ratio, the specific capacities of the three samples were fixed with 420 mAh g−1for a fair comparison, as shown in Figure 1. 9e. Among three graphite-blended electrodes, FeCuSi showed the highest discharge capacities and Coulombic efficiencies during long-term cycling in both half- and full-cell configurations (Fig. 1. 9f, g). Therefore, this work implies that the fabrication of graphite-blended electrode allows the rational comparison of high-capacity Si anodes for commercial feasibility.
In summary, industrially-developed Si materials, such as SiOx,49, 93 Si-metal alloys,9, 48, 50, 78 and porous Si52, 89 have mostly demonstrated their commercial viability in the graphite-blended anode.
Graphite plays a role in not only improving the electrochemical stability but also making various Si anodes applicable to conventional battery manufacturing process. We consider the evaluation method with graphite-blended Si anode, where the parameters for volumetric energy density are surely taken into account, will play important roles in the rational performance comparison and the feasibility study of emerging Si anode for high-energy LIBs.
Figure 1. 7.3M Si alloy (V6) for graphite-blended Si anode. a), b) SEM images of (a) uncalendered and (b) calendered V6 electrodes, respectively. c) Discharge capacities of uncalendered and calendered V6 electrodes. d), e) SEM images of (d) uncalendered and (e) calendered V6/SFG6L electrode, respectively. f) Discharge capacities of uncalendered and calendered V6/MAG-E electrode with different amounts of MAG-E. g) Discharge capacities of uncalendered and calendered V6/MAG-E and V6/SFG6L electrodes. h) Schematic design of cell stack model. Copyright: the Electrochemical Society, 2014.
Figure 1. 8. Porous Si for graphite-blended Si anode. a) Schematic design of porous Si/C-graphite electrode. b) Voltage profiles of porous Si/C-graphite electrode (1:2) at the first cycle. c) Discharge capacities of the calendered porous Si/C-graphite electrode (1:2) in the half-cell. d) Cross-sectional SEM image of porous Si/C particle in calendered electrode. Inset indicates corresponding low magnification SEM image. e) High magnification SEM image of (d). f) Discharge capacities of full- cell building with Li(Ni1/3Mn1/3Co1/3)O2 cathode and pre-lithiated anode over 300 cycles. Copyright:
Royal Society of Chemistry, 2017.
Figure 1. 9. Fe-Cu-Si ternary composites (FeCuSi). a) Schematic illustration of the structure of FeCuSi and its synthetic process. b) Particle size distribution of FeCuSi. c) SEM image of FeCuSi. d) Magnified cross-sectional HAADF-STEM image of FeCuSi and elemental analysis at Si and metal silicides phase in FeCuSi particle. e) Voltage profiles of graphite-blended FeCuSi and other benchmarking samples (C-SiOX, and FeSi2) at the first cycle. f) Discharge capacities and cycling CEs of the graphite-blended anodes for 50 cycles in half-cell configuration. g) Discharge capacities and cycling CEs of the graphite-blended anodes with LiCoO2 cathode for 300 cycles. Copyright: Royal Society of Chemistry, 2016.
1.3.2. Various synthetic methods for the graphite/Si composite
Since the first graphite/Si composite by Wang et al. in 1998,98various strategies were suggested to fabricate the graphite/Si composite to address issues coming from the massive volume changes of Si anodes during cycling. In this section, we categorized various graphite/Si composites according to synthetic methods, including ball-milling, spray drying, chemical vapor deposition (CVD), and liquid solidification. From the viewpoint of commercial feasibility, various representative graphite/Si composites synthesized by such methods were reviewed in terms of productivity, morphological features, electrochemical performances and current limitation.
1.3.2.1 High energy mechanical milling
The high energy mechanical milling including ball-milling has been used to pulverize bulk materials into fine particles through the collisions with high energy rotating balls.99Additionally, these collisions could lead to the formation of the secondary particle viarepeated flattening, fracturing, and rewelding of the particles.94, 100-102Such a method is highly attractive because of its simplicity, cost-effectiveness, and facile procedure compared to synthetic chemical routes, and it also has a potential of scale up to mass production.46, 103-107 However, excessive milling with high-energy could destroy the crystallinity of graphite and additional surface area, leading to unfavorable side reaction.
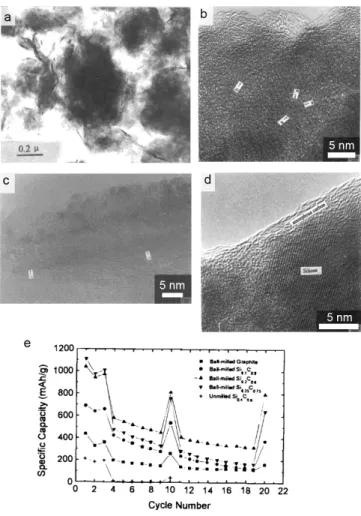
In 1998, C. S. Wang et al. firstly reported the graphite/Si composite synthesized by the ball-milling method for 150 h under Ar atmosphere.98The authors demonstrated a composite with well-distributed Si nanoparticles on graphite, which could utilize both the high gravimetric capacity of Si and excellent electrochemical stability of graphite as shown in Figure 1. 10a. From the microstructure observation, the ball-milled graphite has wrinkled layers with irregular thickness and a distribution of interlayer spacing (Fig. 1. 10b). It was expected that the unorganized carbon and microcavities could be formed along the edge of structural units. The ball-milled graphite in the composite piles up as distorted columns, and it encapsulates the Si as a form of amorphous layer (Fig. 1. 10c, d).
With various input ratios between graphite and Si, kinds of C1-xSix (x = 0, 0.1, 0.2, and 0.25)
Figure 1. 10.Graphite/Si composite fabricated by ball-milling. a) SEM image of the graphite/Si composites (C0.8Si0.2). b) HR-TEM image of the ball-milled graphite for 150 h. c) HR-TEM image of the ball-milled C1-XSiX composite. d) HR-TEM image at the surface region of ball-milled C1-XSiX
composites. e) Discharge capacities of ball-milled C1-XSiX (x=0, 0.1, 0.2, and 0.25) and unmilled C0.6Si0.4. Copyright: the Electrochemical Society, 1998.
To address the demolition issue of graphite in the high energy mechanical milling process, Y.S. Yoon et al. utilized spherical natural graphite, Si nanoparticles and pitch carbon as a glue layer with mild rotation speed and time (60 rpm and 2h).109 As shown in Figure 1. 11a, b, Si nanoparticles were uniformly attached on the graphite surface. However, secondary Si particles which were agglomerated during ball-milling were observed in some regions at the surface of graphite. The pitch-derived carbon bonds the Si nanoparticles with the graphite strongly (Fig. 1. 11c).
The relatively low milling time, the addition of Si nanoparticles, and pitch carbon successfully kept graphite intact. It was proved by X-ray diffraction pattern (XRD) (Fig. 1. 11d), where the interlayer distance (d002) of the graphite was determined to be 3.37 Å which is close to the ideal crystalline graphite (3.36 Å). Furthermore, the intercalation and de-intercalation of lithium with graphite were detected in the differential voltage curve (dQ/dV vs. V), which corresponds to the small and broad peak at ~0.13 V during the 1st discharge and the three peaks at ~0.11 V, ~0.15 V and ~0.23 V during charging (Fig.
1. 11e). Accordingly, the preservation of the original form of graphite let the graphite/Si composite have a high reversible capacity of 655 mAh g−1with initial Coulombic efficiency (CE) of 86% with avoiding the additional side reaction. The composite also achieved outstanding capacity retention of 71.4% over 300 cycles in 100 mAh grade full-cell configuration with LiCoO2cathode (Fig. 1. 11f).
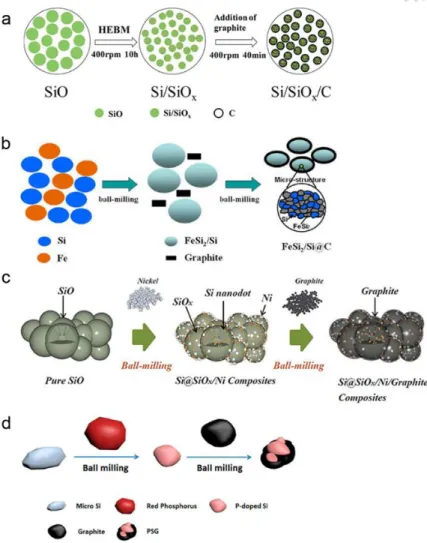
Recently, various Si/inactive matrix anodes, such as SiOx,103 Si-Fe,110 Si-Ni,107 and Si-P,104 were utilized to build a composite with graphite by the high energy mechanical milling method (Fig. 1. 12).
They used the graphite as an outer shell for imparting the high electrical conductivity and shielding the Si anodes from additional side reactions. Owing to the synergistic effect of the inactive matrix and the graphite in the composite, the composites exhibited stable cycling behavior with high specific capacity.
However, the severe demolition of graphite including pulverization and crystal transformation is remaining issue, causing inevitable side reactions between the graphite and electrolyte. It would be required to carry out the high energy mechanical milling delicately for minimizing the additional side reaction.
In terms of industrial approach, ball-milling method is one of the most advantageous techniques to synthesize graphite/Si composite owing to its simple cost-effective process and feasibility of mass production for commercialization.46, 103-107Besides, ball-milling can be strong method in the point that it the introduction of, improves not only adhesion strength between graphite and Si but also electrical conductivity with the formation of the continuous electrical network.111-119Furthermore, implantation of the inactive matrix into Si suppresses a severe side reaction with electrolyte, as well as the strain induced by the volume change of Si.46, 102-104, 107, 110, 120-121However, in spite of these noticeable merits, several challenges of ball-milling technique still have remained as a practical limitation for commercial application, such as structurally damaged graphite or an immoderately increased surface area, which brings about an excessive irreversible capacity and lowering initial CE.
Figure 1. 12. Si/inactive matrix/graphite composites by ball-milling. a) Schematic illustration of fabrication process of Si/SiOx/C composite. Copyright: Royal Society of Chemistry, 2017. b) Schematic illustration of fabrication process of FeSi2/Si@C composite. Copyright: American Chemical Society, 2012. c) Schematic illustration of the fabrication process for SiO/Ni/graphite composites.
Copyright: Wiley-VCH, 2015. d) Schematic illustration of the synthetic process for nanostructured P- doped Si/graphite composite. Copyright: American Chemical Society, 2017.