Introduction
Motivation
Problem Statement
Objectives
Outline
Related works
Process mining
Process mining can also be understood in the broader context of BI and BAM [34], but with the aim of offering insight into processes (Where is the bottleneck?). Traditionally, based on the process information stored in the log, process mining focuses on the discovery process model.
Application of process mining in manufacturing
Cost and quality mining in process mining
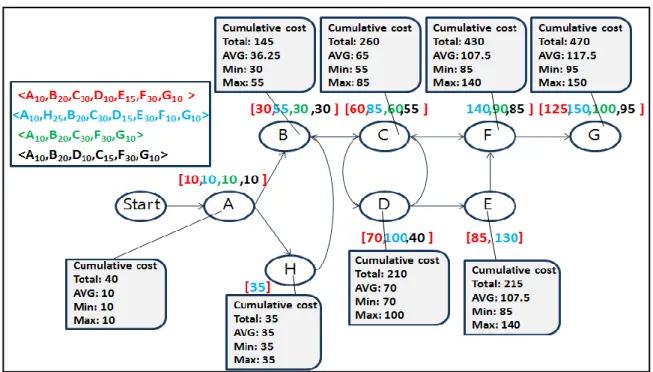
A measurement function is a function that generates some cost values based on a bag of measurements, e.g. sum, average, min., max. Start event as = {Cutting}, end event ae = {Packing out}. The graph shows the occurrence of nodes, e.g.
Performance Analysis
Cost-related KPIs
- Activity-Based Costing (ABC)
- Manufacturing Cost
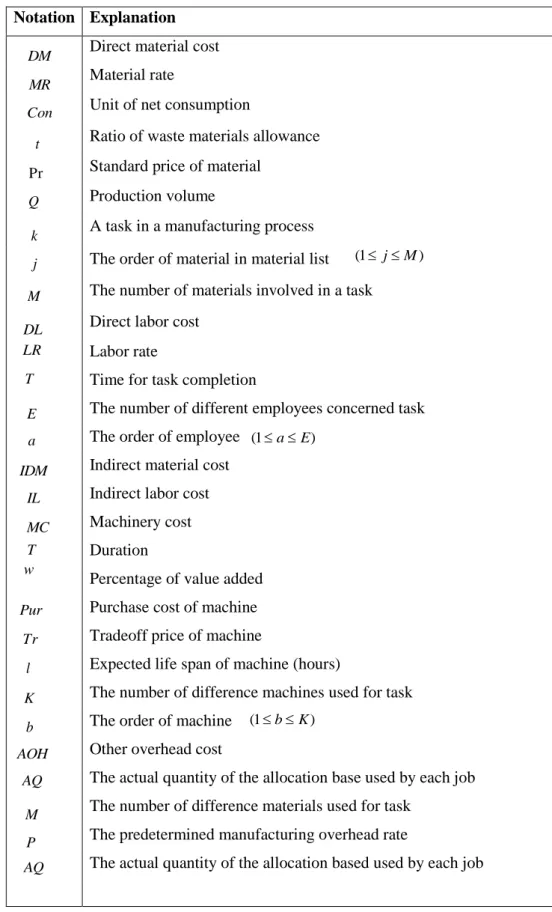
- Direct material cost
- Direct labor cost
- Overhead cost
The actual amount of allocation base used by each job. Number of different materials used for the job. The overhead (OH) of task k can be expressed as:. 3) Machinery costs are the costs of all machines used in the production process.
Quality-related KPIs
- Defect rate
- First pass yield
- Repitition
Regarding the event log extension with cost-related KPIs, a cost model and cost database model creation for producing cost model extracts are defined in the following subsections. A cost model and an event log provide input for event log-augmented manufacturing costs. Extending Event Log with Cost of Manufacturing (LCM) Input: an event log L, a cost model CM.
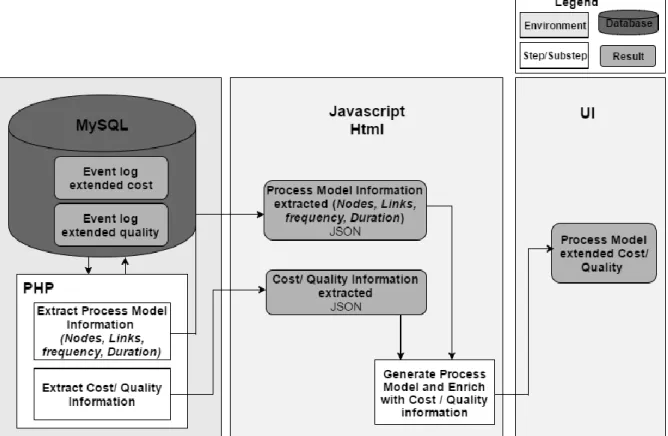
The quality functions contain all the functions that support the calculation of the quality index in the event log. We discuss in this section the extended event log cost and the extended event log quality. As shown in Fig.9, the inputs for the improved production information from the process model are the production cost extended in the event log and the process quality extended in the event log.
Regarding the extension of the event log with costs, a cost model and the creation of a cost database model for the extraction of cost models were presented.
Performance Analysis in Manufacturing Process
Overview
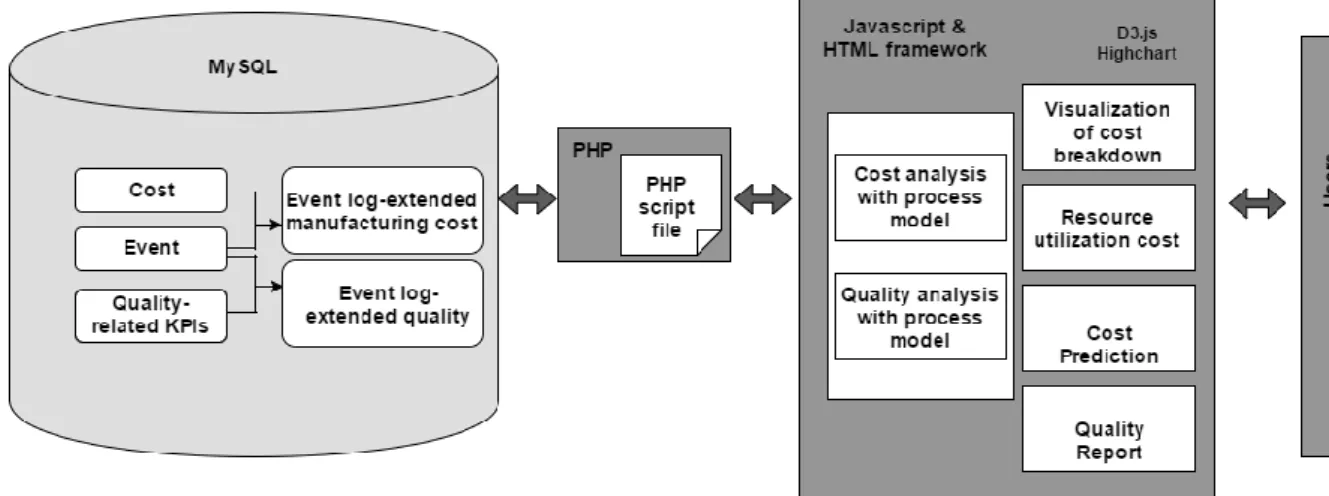
2, the proposed framework consists of two main steps: (1) an augmentation of event logs with manufacturing information and (2) a performance analysis of manufacturing processes. First of all, this work formalizes the event logs of a manufacturing process for a plan with actual data. This study uses both planned and actual data for cost prediction, which is presented in Section 4.4.2.3.
Regarding the expansion of the event logs with costs, a cost model is presented and a cost database model is created for the extraction of the cost model. For event logs extended with quality, we offer guidelines for drawing up a quality model and calculating quality-related KPIs. Finally, we form the event logs, including production information, which serve as input for various visualization techniques for both the cost and quality perspectives as discussed in step 2.
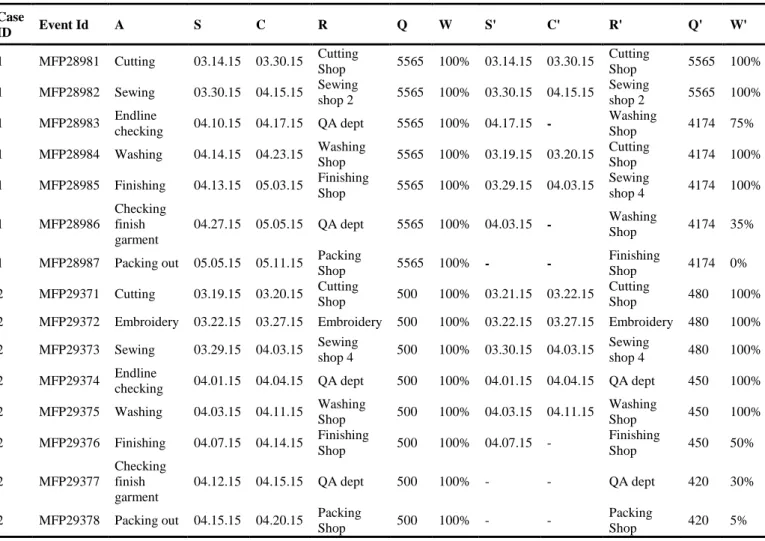
Let the activity set attributes in the planned and actual data be denoted as follows: S and S' sets of start timestamps, R and R' sets of resources, Q and Q' sets of production volumes, W and W' sets of work progress (0≤ 𝑊 ≤ 1 ).

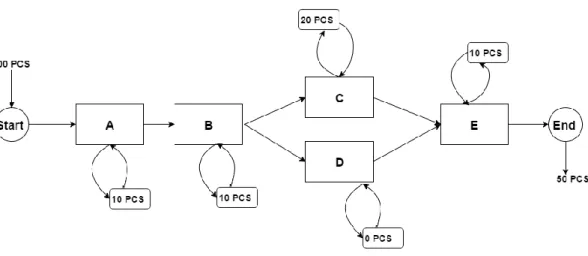
Running Example
Extension of event log with manufacturing information
- Extension of event log with cost-related KPIs
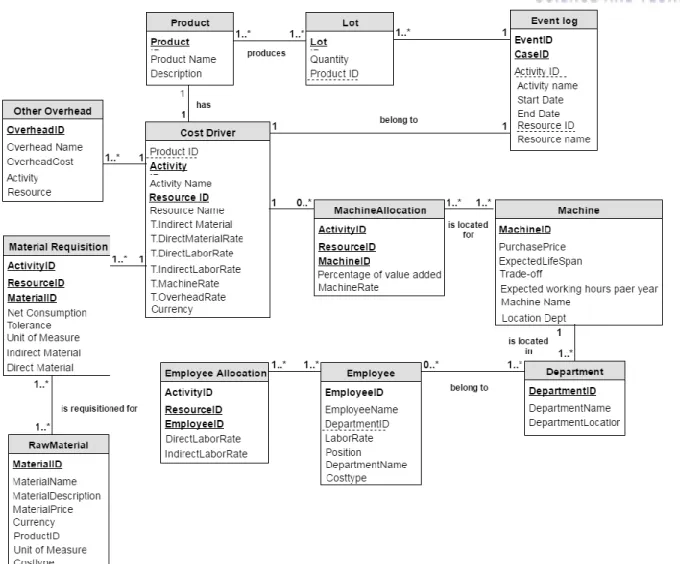
- Cost database model
- Event log-extended manufacturing cost
- Extension of event log with quality-related KPIs
- Quality-aware Event log
- Computation of quality-related KPIs index
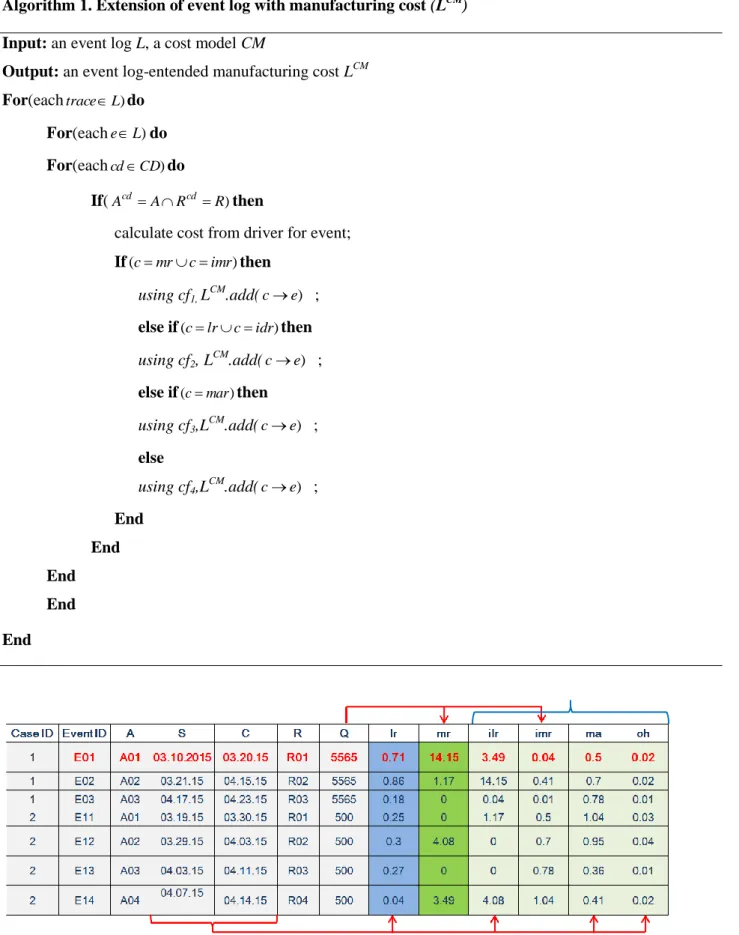
Denote by A a distinguishable set of activities from L, R' a set of real resource from event log L, AR' AR' a set of unordered pairs of activity from A and resource from R' of event log L Fig. 4 shows a fraction of an event log extended cost consisting of instances, events, timestamps, work progress, resources, and production volume. While the cost characteristics of an event log are linked to a cost model that satisfies the matching of activity and resource from both sides, we can calculate the quality index directly in the event log by using its characteristics in response to the quality perspective .
How to measure and aggregate into an event log using a quality model is shown in Algorithm 2. Then, the associated data is collected and updated for each event in the event log. At the same time, based on the quality-related KPIs, a quality model is created that supports functions for calculating the quality index from the updated event log.
The input for the calculation of the quality-related KPI index is the updated event log, which is well defined in the previous section, together with the quality model.
Performance analysis
- Manufacturing information analysis with process model
- Cost Analysis
- Visualization of cost breakdown
- Resource utilization cost
- Cost prediction
- Quality Analysis
- Quality report
Based on this result, we can derive the detailed cost of execution time of each activity or resources in the process. While a process model extended cost only gives an overview of the costs of activities involved in a process, cost breakdown visualization shows, on the one hand, a detailed overview of specific cost components of each activity in the process. On the other hand, resource utilization costs deal with all information related to the cost of resources, i.e.
We assume that the cost of an event in a log refers to a set of costs of that event in the traces indicated by . The bar graph on the left indicates the total cost of the process, distributed by activity in which each bar represents a specific activity. By comparing them, users can know the highest or lowest cost of each activity or cost type.
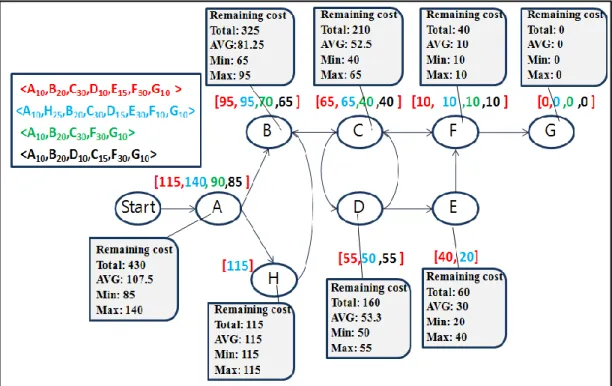
By checking the graph, we can find out the accumulated cost and the remaining cost for each activity included in the process.

Implementation
Process model-enhanced manufacturing information
The proposed approach includes three main steps: (1) extracting information about the process model and extracting production data such as cost or quality from the process quality augmented by the event log; (2) generating a process model based on frequent sequential mining and enriching it with cost or quality information; Alternatively, users can use the mouse wheel to zoom in or out on the process map. By checking the costs of Jean's manufacturing process enhanced by the process model in Figure 10, users can obtain information about the number of activities, their frequency, and the detailed costs of each activity involved in this process.
So equipped with this overview of the allocation of costs per activity involved in the process. Based on this, process managers or management can prevent risks, adjust unreasonable points, prevent waste and optimize the process. Furthermore, this plugin gives users access to the execution time of each activity involved in the process.
Sewing” activity has the longest execution time of 21 days, and “Embroidery” activity has the shortest execution time of only 4,333 days.
Cost perspective
- Visualization of cost breakdown
- Resource utilization cost
- Cost prediction
As we can see in Figure 11, the material cost is the highest; while machine costs and other overheads are not significant. In terms of cost type, for example from IDM, the activity “Cutting” is the highest with a cost of $246,036 USD and higher than the activity “Finishing” which costs $112,506. In terms of activity, for example the activity 'Check Garment Finish', IDL is responsible for the largest part of the cost value with $5813, OtherOH is lower with cost of $110, and the lowest are DL, DM, IDM and MaC with cost from $0.
By clicking on each bar, users can see the detailed cost components, visualized in the pie chart and legend table. By comparing them, users can quickly determine whether the most expensive is 'Check Garment'. If we look at Figure 14, we can find out that the direct material costs cover three months of March, April and May.
Process model-extended costs, visualization of the cost breakdown, resource usage, analyze the data only after completion of an activity or a case.

Quality report
Levialdi, "Performance Analysis of a Flexible Manufacturing System: A Statistical Approach", International Journal of Production Economics, vol. Kerdprasop, "Performance analysis of a complex manufacturing process using a sequential data mining technique," International Journal of Control and Automation, vol. Zhu, "An Integrated Approach for Evaluating Ship Block Manufacturing Process Performance: A Case of a Korean Shipbuilding Company," International Journal of Production Economics, vol.
Tonchia, "Performance measurement systems-models, characteristics and measures", international journal of operations and production management, vol. Bourne, "Theory and Practice in SME Performance Measurement Systems", International Journal of Operations and Production Management, Vol. Steeple, "A framework for auditing and improving performance measurement systems", International Journal of Operations and Production Management, Vol.
Crowe, "An integrated dynamic performance measurement system for improving manufacturing competitiveness," International journal of production Economics, vol.
Conclusions & Future Works
Summary of contributions
For manufacturing companies, it is critical to obtain detailed and reliable insight into their manufacturing processes in terms of cost and quality. The main contributions of this thesis are: (i) a proposed method to augment the manufacturing process event log with manufacturing information, i.e. guidance for creating a quality model and calculating quality-related KPIs indices was introduced in the response to the event log extension with quality as well.
For the second contribution, production costs and process quality, augmented with a process model, were presented in Section 4.4.1. These are cost analysis with a process model, visualization of cost breakdown and resource utilization costs. Cost analysis with a process model is a systematic method that allows users to access the detailed costs of a specific activity or individual resource involved in the production process.
A cost breakdown visualization identifies different types of costs, including material costs, labor costs, and overhead costs, which comprise the total cost of a task during the execution of a process.
Future works
Raghuraman, "Cải thiện chất lượng thông qua năng suất đầu tiên sử dụng phương pháp kiểm soát quy trình thống kê", Tạp chí khoa học ứng dụng, tập Gong, "Nhận dạng tài nguyên nhàn rỗi trong các mô hình kế toán chi phí và tiêu thụ tài nguyên dựa trên hoạt động theo thời gian", Tạp chí nghiên cứu kế toán quản lý ứng dụng , tập Tôi xin viết lá thư cảm ơn đặc biệt này tới người thân và bạn bè thân thiết của tôi.
Tôi muốn gửi lời cảm ơn sau đây tới những người bạn của Tae ở quê nhà đã ghé thăm. Cảm ơn Mai Lan vì những ngày tay trong tay đi du lịch, vì những phút giây chia sẻ tâm tư và những lời khuyên bổ ích. Cảm ơn Chị 3 và dì Tý vì những lời xúc phạm có chủ ý đã cho Tae biết rằng cuộc sống là một đòn mạnh để giẫm đạp lên dư luận.
Cảm ơn người hướng dẫn của tôi, anh Bình, đã lắng nghe, giúp đỡ và giải đáp những câu hỏi ngớ ngẩn và khó khăn của tôi.