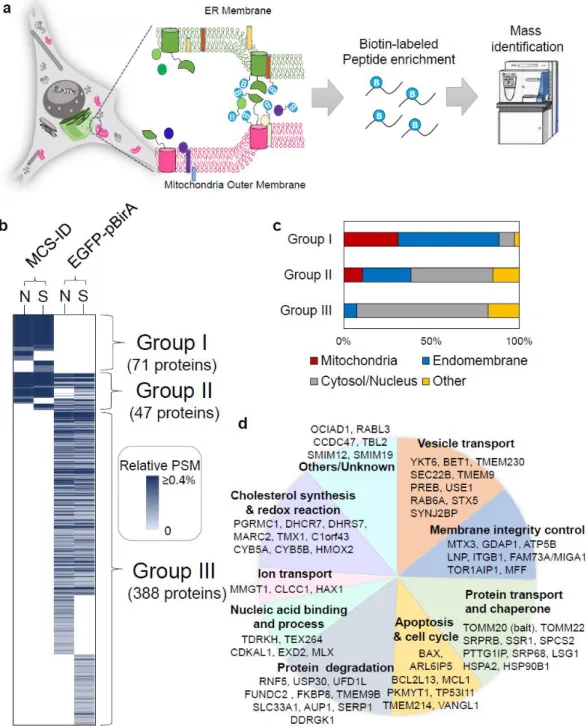
We named this system MCS-ID and targeted it to the endoplasmic reticulum (ER) membrane and outer mitochondrial membrane (OMM), respectively, in mammalian cells using anchoring transmembrane proteins and identified biotinylated proteins using mass spectrometry. Schematic representation of MAM proteome profiling and features of MAM proteome revealed by MCS-ID. For this reason, proximity labeling methods have recently been used in the biological community to profile the proteome present in particular organelles.
In general, the proximity labeling method uses an enzyme conjugation with a targeting signal sequence or protein of interest. After targeting these enzymes, an enzyme-catalyzed proximity labeling reaction is performed in the living cell state.
Limitations of proximity labeling method in membrane contact sites (MCS)
Physiological importance of MCS proteome
For subcellular localization marker, mito-BFP was a gift from Gia Voeltz (Addgene plasmid . #49151) and EGFP-LC3 was a gift from Karla Kirkegaard (Addgene plasmid #11546).
Antibodies
Cell culture and Transfection
48 h after transfection, the cell culture medium containing the lentivirus was collected and filtered through a 0.45 μm syringe filter. Two days after infection, cells were transferred to complete FBS media containing 2 µg/ml blasticidin for selection.
Fluorescence microscopy
Electron microscopy
A freshly diluted solution of 1 mg/ml (2.8 mM) DAB free base was combined with 10 mM H2O2 in chilled buffer, and the solution was added to cells for 5 min. To stop the reaction, we removed the DAB solution and the cells were rinsed with chilled buffer 3 × 5 min. Post-fixation staining was performed using 2% (w/v) osmium tetroxide (Electron Microscopy Sciences) for 1 h in chilled buffer.
Cells were brought to room temperature, washed in distilled water, and then carefully scraped off the plastic, resuspended, and centrifuged at 1600 ´g for 1 min to generate a cell pellet. After removing the resin, the sample was once again exchanged with 100% resin for 2 h before transferring the sample to fresh resin, followed by polymerization at 60°C for 48 h.
Immunoprecipitation analysis
LC-MS/MS sampling and analysis
To concentrate and denature lysates, we load the lysates onto an Amicon filter (Merck Millipore, UFC801096) followed by centrifugation at 7500 × g for 20 min. 3 ml of denaturing solution (8 M urea in 50 mM ammonium bicarbonate (ABC)) was added and centrifuged at 7500 x g for 20 min. Then, lysates were centrifuged at 7500 x g for 20 min, and alkylation solution was added and centrifuged again under the same conditions.
To remove urea, the final centrifugation was done with 1ml of 50mM ABC buffer and the concentrated sample was transferred to a 1.5ml Eppendorf tube. Sodium chloride (final concentration as 1 mM) was added and incubated with shaking at 900 rpm overnight at 37 °C.
Desalting
After cell lysis, all steps are performed at room temperature or higher to avoid precipitation of detergents. The denaturation step was additionally performed and protein alkylation was introduced with 3 ml of denaturing solution containing 10 mM iodoacetamide without stirring for 30 minutes in the dark. Collection of the remaining sample was followed by washing the filter unit with 200 µl of 50 mM ABC buffer and the final urea concentration was adjusted below 200 mM.
To enrich labeled peptides, 150 µl of streptavidin beads (Pierce) were mixed with digested peptide and incubated for 1 h with rotation.
Mass spec detection of labeled peptide
MS data processing
Image analysis
A rolling background subtraction with a width of 8 pixels was applied to improve the signal-to-noise ratio in the fluorescent images.
Molecular dynamics simulation analysis
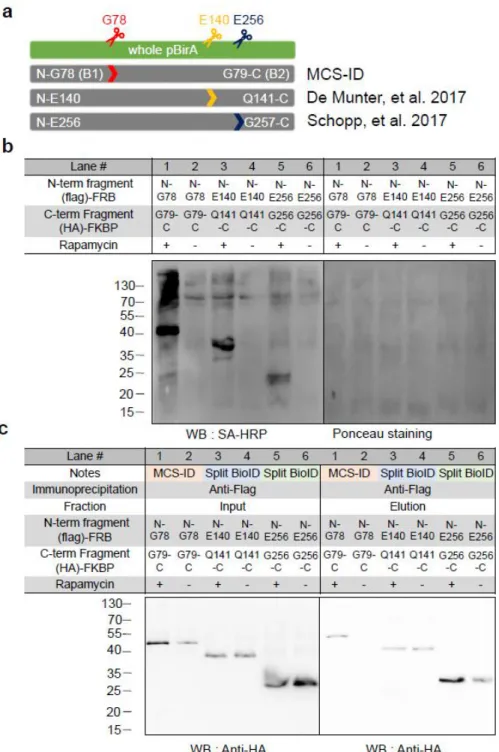
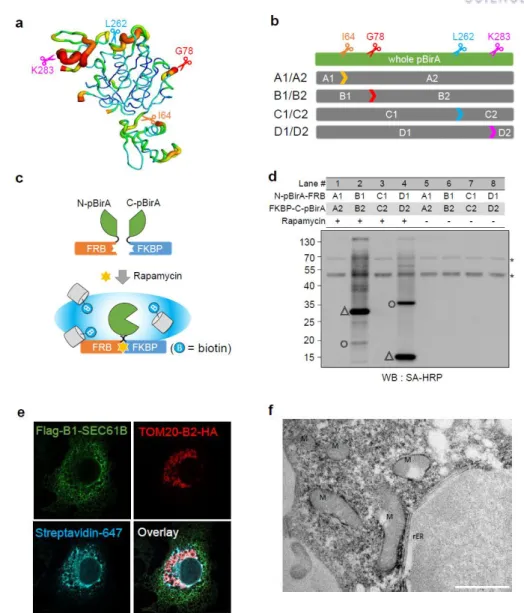
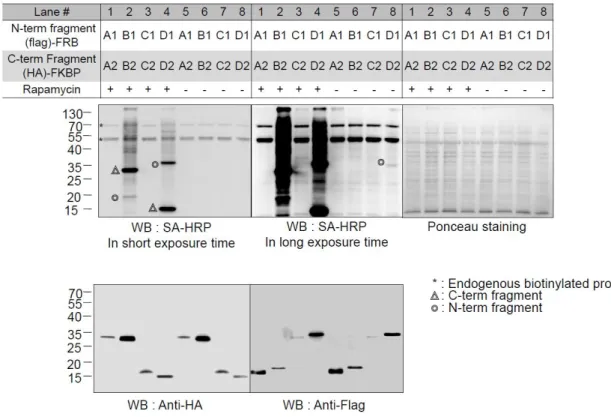
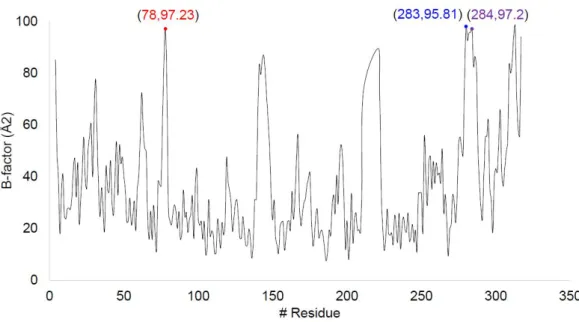
We thus wanted to select for functionally cleaved pBirA fragments that had no intrinsic affinity at all. Tube representation of conformational flexibility in pBirA and schematic overview of the cleaved pBirA pairs. Expression level of each cleaved pBirA fragment measured by Western blot signal using Flag and HA antibodies.
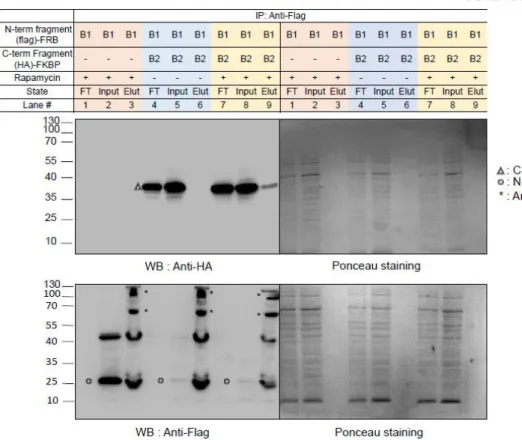
Among our attempted constructs, we observed that the cleaved pBirA pair (N-G78 and G79-C) showed significant biotinylating activity in the presence of rapamycin (100 nM), and these constructs showed no biotinylating activity under the control condition ( eg rapamycin treatment) (Figures 3b and 4). Data from immunoprecipitation experiments confirmed that the cleaved pBirA pair (N-G78 and G79-C) did not physically interact with each other (Figure 5), whereas other constructs such as the cleaved pBirA pair K283-E284 showed detectable intrinsic binding affinity have (Figure 5). 1 and 4).
Identification of the MAM proteome by MCS-ID
Using the power of the MCS-ID system in identifying MAM proteins, we further tested whether MCS-ID was applicable under specific physiological conditions, such as nutrient starvation. For this purpose, we performed MS analysis of MCS-ID samples together with control samples of ERM-pBirA, OMM-pBirA and EGFP-pBirA, under conditions of bovine serum starvation (FBS)34 for 12 h. It is also worth noting that most of the MCS-IDome was recovered from either the whole PBirA ERM or OMM, and this result is reasonable given that MAM-resident proteins should originate from both the ERM and OMM.
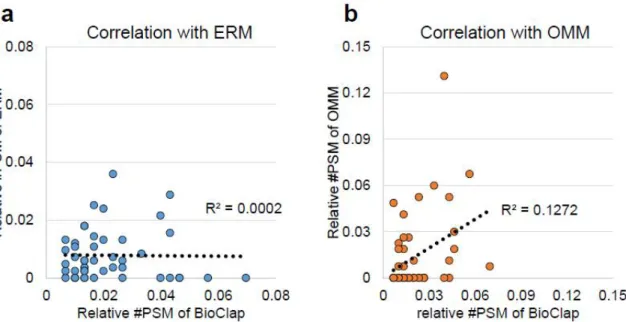
However, we found that the relative Peptide Spectrum Match (PSM) values (e.g., the identified PSM value of each protein divided by the total PSM value) in the MCS-IDome did not track the relative PSM values, including in the dataset of ERM-pBirA or OMM-pBirA. The relative PSM number of 72 proteins found in MAM was compared with those in ERM-pBirA and OMM-pBirA.
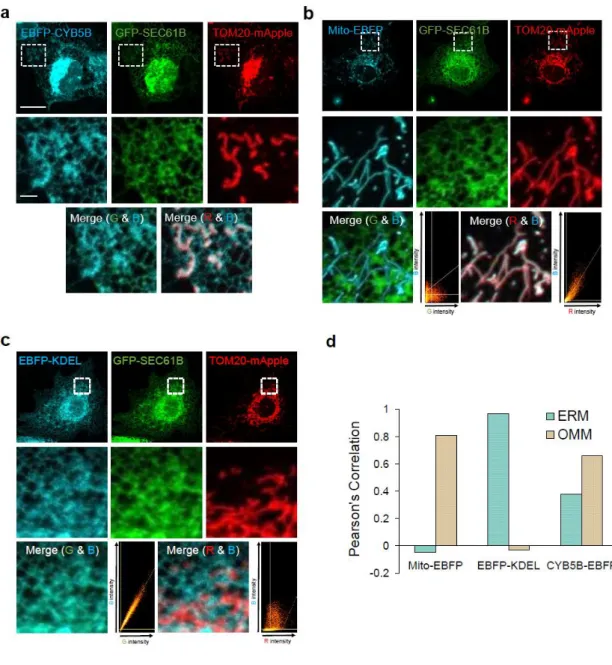
CYB5B and FKBP8 dually localized at the ER and mitochondria via MAM
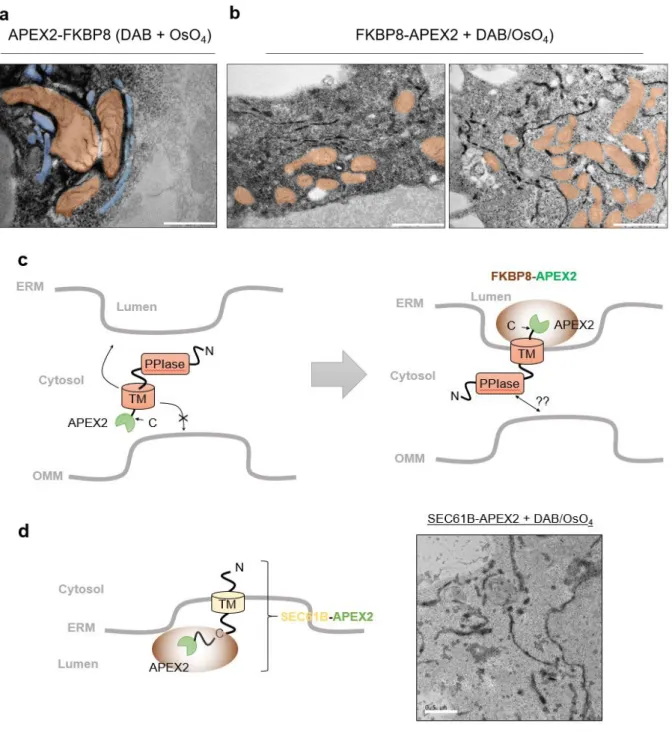
To test this hypothesis, we attempted to image the subcellular localization of FKBP8 via EM by generating a fusion between FKBP8 and engineered ascorbate peroxidase 2 (APEX2), which could be imaged by EM after DAB polymerization and osmium tetroxide staining ( OsO4)39. Because FKBP8 has a transmembrane helix region in the C-terminal domain, it was expected that the OMM targeting of FKBP8-APEX2 would be compromised. Interestingly, we observed that DAB/OsO4 staining of FKBP8-APEX2 occurred in the lumen of the ER and its tubules were surrounded by mitochondria (Figure 9b).
This result indicated that the membrane topology of FKBP8 was the same in the OMM and ERM, with the N-terminal domain localized in the cytosolic space. In addition, we also hypothesized that the cytosolic domain of FKBP8 may be associated with the creation of more ER–mitochondria bound junctions, because cells transfected with FKBP8 showed more mitochondria and ER clusters compared to control cells (overexpressed proteins that target per ER lumen) in Figure 9d.
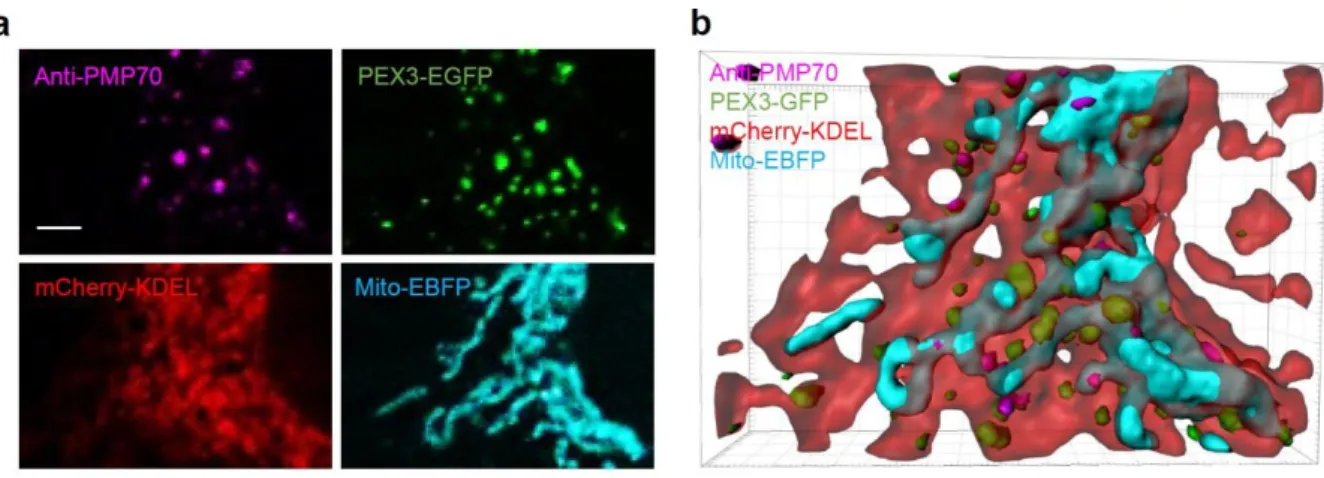
The peroxisomal membrane protein ABCD3 localized to the MAM
Localization of PMP70 colored in magenta and ER (KDEL), Mitochondria (Mito), peroxisome (PEX3) markers in confocal imaging. Compared to PEX3, a closer localization of PMP70 is shown between ER and mitochondria in 3D reconstruction.
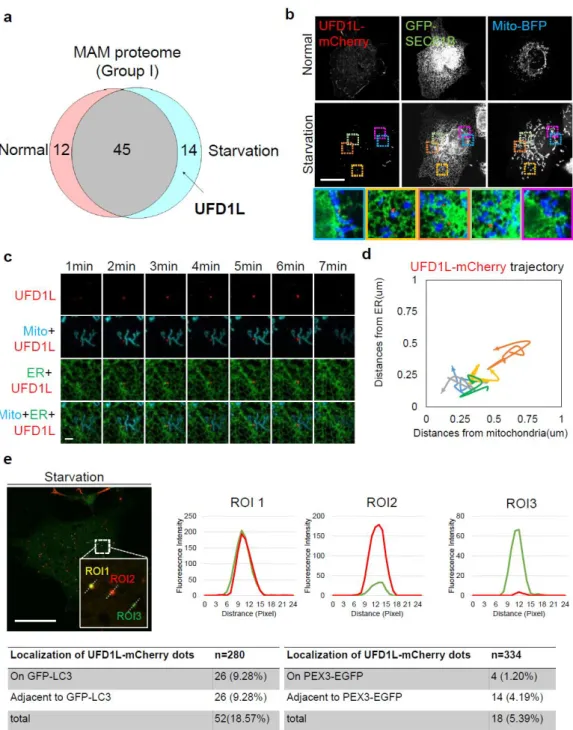
Starvation induced UFD1L localization at the MAM
Quantification of co-localized UFD1L-mCherry dots with GFP-LC3 and PEX3-EGFP (a peroxisome marker). We also performed live cell imaging analysis with UFD1L-mCherry and found that the UFD1L-mCherry dots oscillated dynamically at the interface of the ER and mitochondria, with a distance of <1 µm from both organelles during the 10 min after their formation. at the MAM (Figure 12c, d and Supplementary Figure 1). As shown in Figure 12e and Supplementary Figure 2, we observed that 18% of UFD1L-mCherry spots co-localized next to or with GFP-LC3, while a negligible portion (5.4%) of UFD1L-mCherry spots near the peroxisome marker protein, PEX3, is localized. -GFP.
Data from imaging experiments with GFP-LC3, EBFP-KDEL (ER), and anti-TOM20 (mitochondria) showed that UFD1L-mCherry puncta formed 2 separate populations in the MAM and lysosome. Although it is not fully characterized whether UFD1L-mCherry dots are membrane-enclosed vesicles, we previously hypothesized that UFD1L complexes may first form at the MAM and ultimately fuse with lysosomes, as occurs in the autophagosome life cycle51-52. Furthermore, UFD1L is known to be an adapter protein for the VCP complex, which mediates ER membrane protein degradation and OMM53- protein degradation.
55. Although the VCP complex is known to degrade ER-membrane and OMM proteins, there is no approach to explain it by MAM localization. Thus, we hypothesized that if UFD1L as one of the VCP complexes is localized to the MAM, efficient degradation of OMM and ER-membrane proteins is possible compared to those separately localized to the ER-membrane or OMM. We believe that this hypothesis is related to our finding which ubiquitin-related enzymes, including UFD1L, RNF5, USP3, cluster in the MAM to ubiquitinylate its substrates.
Further investigation of UFD1L related to mitophagy may be necessary to prove this hypothesis in the future. By specifically labeling under starvation condition, UFD1L is thought to be translocated into the MAM for efficient complexation with VCP and Npl4 present in the ER. Although it is unclear how ubiquitin-related proteins undergo degradation pathway in detail, translocation from under starvation condition suggests changes of protein degradation mechanism.
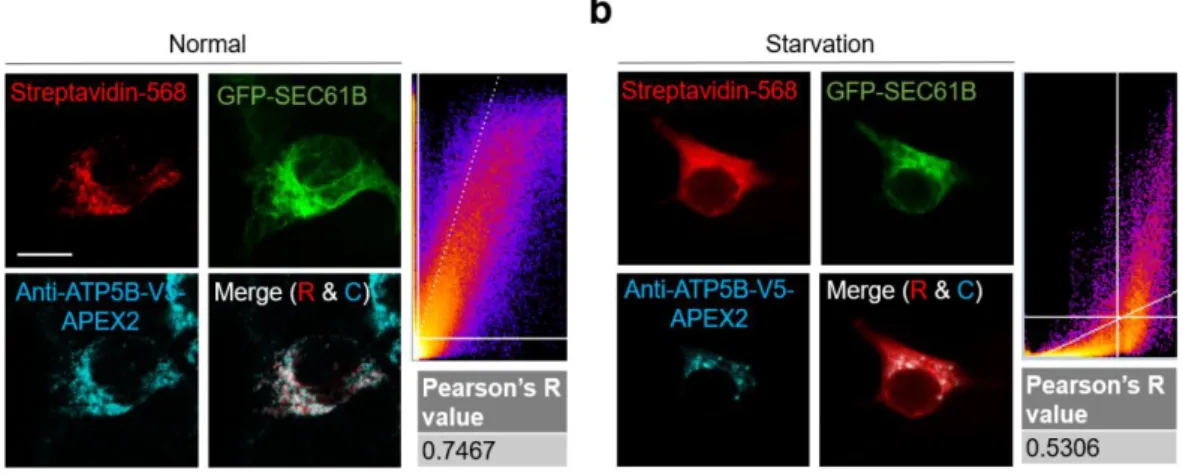
ATP5B accumulated at the OMM during starvation
Because MAM is known to have a “lipid raft” property21, 61, we postulate that the membrane protein components of those MAM-derived vesicles may be initially clustered at the MAM. We also found that biotin-tagged sites using the MCS-ID system are useful for identifying membrane protein topologies in living cells. Because pBirA labeling occurred at the cytosolic face of the ERM or OMM, the labeled site must be localized to the cytosolic side.
Based on the identified membrane topologies in UniProt, we confirmed that the membrane topologies of 27 proteins were in good agreement with our findings (Figure 15 and Appendix D). We also found that our tagged site information did not match the known membrane topologies of several proteins (e.g., TOM22 and TOR1AIP1). We think that our labeled site information may reveal the possibility of double membrane topologies of these proteins in living cells.
Further investigations may be required to confirm our proposed membrane protein topologies shown in Figure 15. Of the 54 TM proteins, half are correlated with our results and 25 proteins were newly identified in this study because so far no has topology information. M.; Gesson, K.; Thomas, G., Folding of oxidative proteins in the endoplasmic reticulum: close connections with the mitochondria-associated membrane (MAM).
Kamijo, K.; Taketani, S.; Yokota, S.; Osumi, T.; Hashimoto, T., The 70-kDa peroxisomal membrane protein is a member of the Mdr (P-glycoprotein)-related ATP-binding protein superfamily. Gartner, J.; Valle, D., The 70 kDa peroxisomal membrane protein: an ATP-binding cassette transporter protein involved in peroxisome biogenesis. Iwashita, S.; Tsuchida, M.; Tsukuda, M.; Yamashita, Y.; Emi, Y.; Kida, Y.; Komori, M.; Kashiwayama, Y.; Imanaka, T.; Sakaguchi, M., Multiple organelle-targeting signals in the N-terminal portion of peroxisomal membrane protein PMP70.
Mizushima, N.; Yamamoto, A.; Matsui, M.; Yoshimori, T.; Ohsumi, Y., In vivo analysis of autophagy in response to nutrient starvation using transgenic mice expressing a fluorescent autophagosome marker. Xu, S.; Peng, G.; Wang, Y.; Fang, S.; Karbowski, M., AAA-ATPase p97 is essential for the outward turnover of mitochondrial membrane proteins. Sorice, M.; Malorni, W., Evidence for the involvement of lipid rafts localized to ER-mitochondria-associated membranes in autophagosome formation.
Co-localization of UFD1L-mCherry dots with peroxisome marker (PEX3-EGFP) shown in minor correlation.
Appendix
Acknowledgements