To overcome the challenges, big data analytics is expected to be an effective solution to increase the practical efficiency in the shipbuilding industry. In this thesis, the reference model for big data analysis in the shipbuilding industry is developed.
Introduction
Research Background
The existing studies of the big data analysis have focused on the way to analyze big data such as method, algorithm and architecture. The value chain provides the overview of the area big data analytics is applied to create the value.
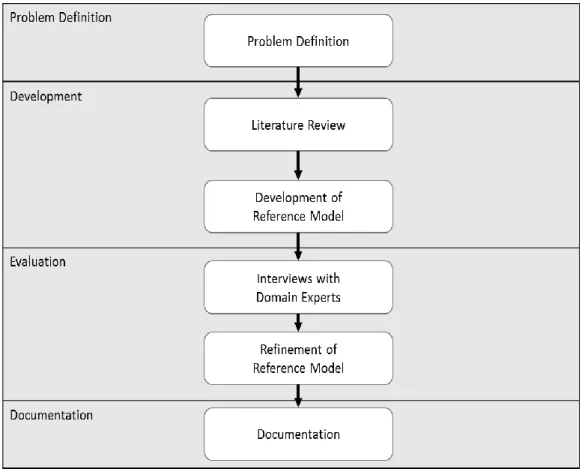
Research Method
Related Works
Big Data Analysis in Manufacturing Industry
Big Data Analysis in Shipbuilding Industry
Big data analytics is needed in the shipbuilding industry because it has many opportunities. The reference model should include overall big data analytics and guide the analysis in the shipbuilding industry.
This is because understanding of the relevant area for the data analysis is increased in terms of the practitioner. Finally, the parts used in the case are found out as the result of the analysis method. Contract in the shipbuilding industry is concluded with the negotiation depending on the specification of the ship.
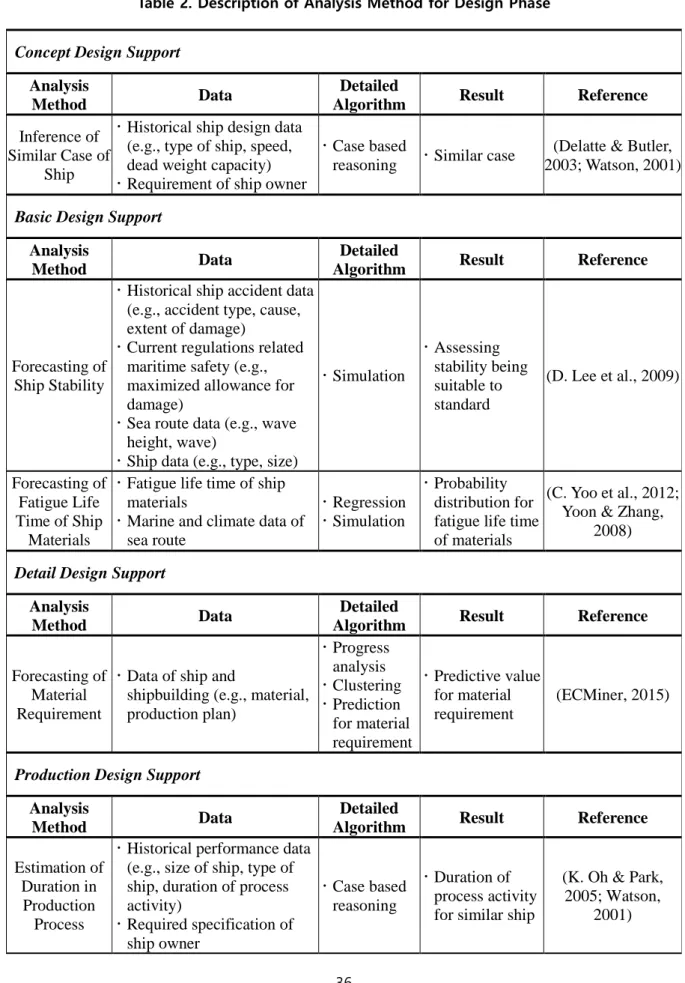
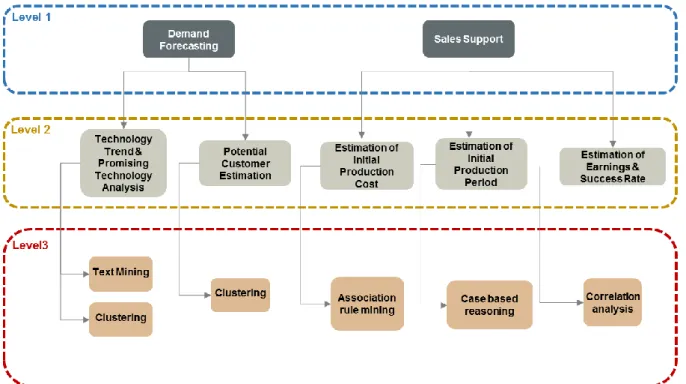
As for the detailed algorithm, case-based reasoning is applied to the data for the analysis (K. Oh & Park, 2005). Case-based reasoning predicts the outcome of a new case based on the results of the historical cases (Watson, 2001). Case-based reasoning predicts the outcome of a new case based on the results of the historical cases (Watson, 2001).
The ships are grouped based on the property and the standard for classification of the ship is re-established. In addition, automatic classification will be performed based on the result through condition diagnosis analysis of the ship's equipment. However, the category includes all the activities of the production phase on the value chain.
In addition, the data analysis methods of the literature on the production phase were classified according to such a categorization. This guidance will increase the understanding of the practitioner for the application of the data analysis in the shipbuilding industry. The importance of the analysis methods was determined based on the survey results in the interviews.
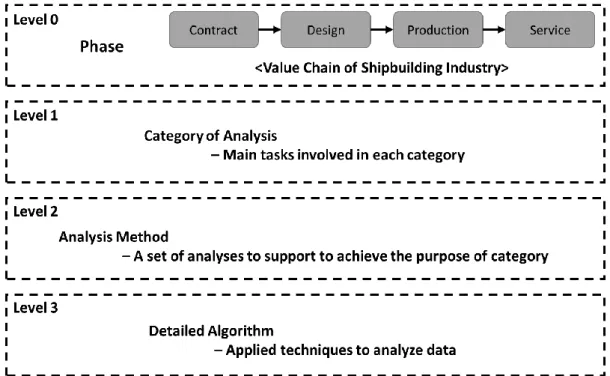
Value Chain in Shipbuilding Industry
Development of A Reference Model for Big Data Analysis in Shipbuilding Industry
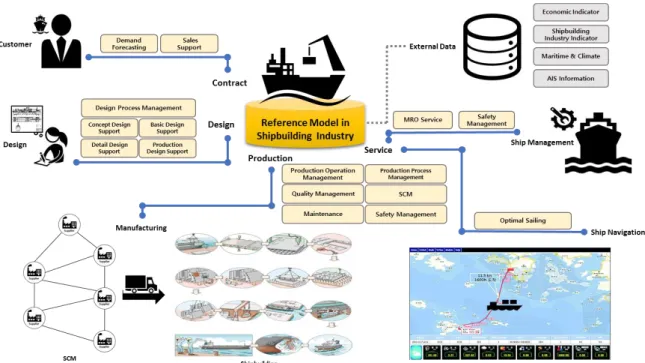
Overview
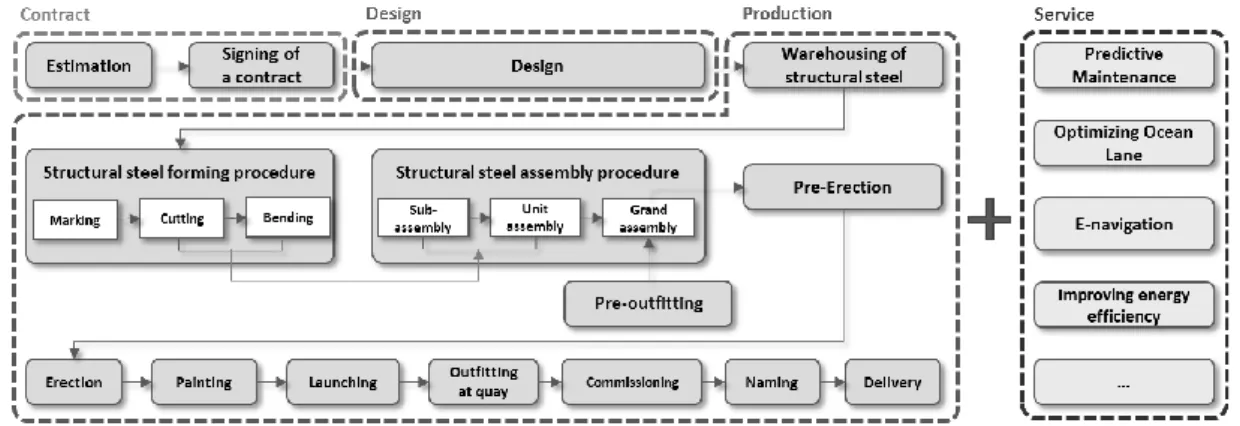
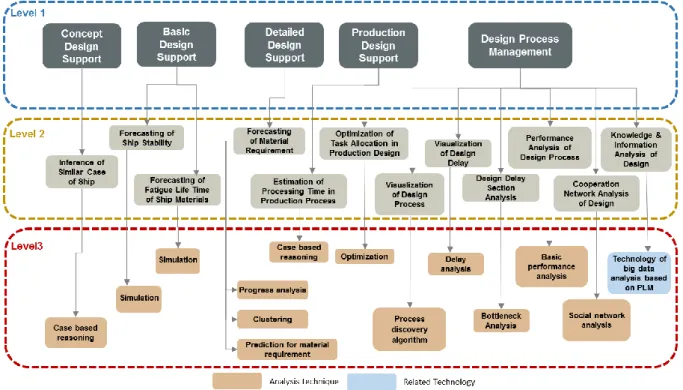
It provides useful data analysis for the shipbuilding industry against the four stages of the value chain in Figure 3, e.g. contract, design, manufacture and service. In the reference model, data, detailed algorithms, results are given at the level of the analysis method.
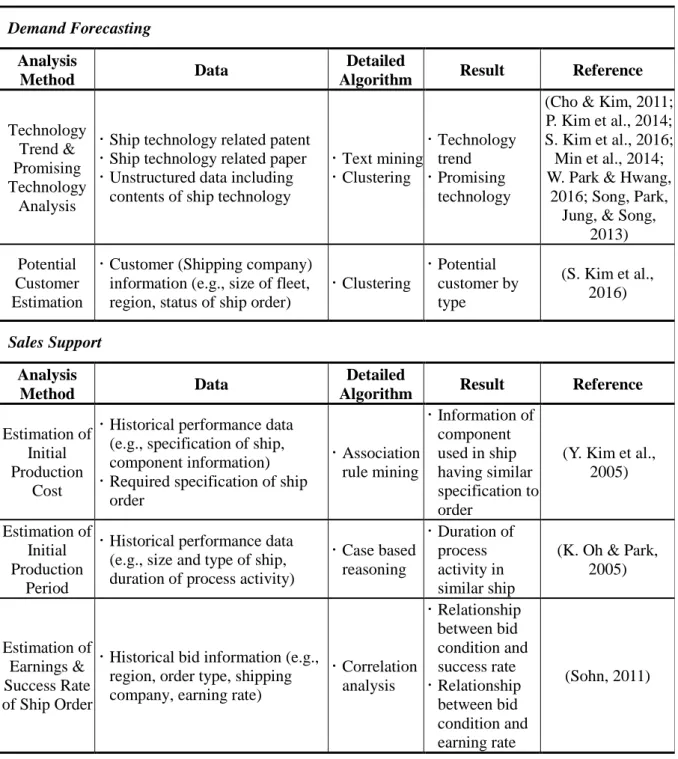
Data Analysis in Contract Phase
- Contract Phase
- Data Analysis Description
Finally, groupings of potential customers according to the standard are generated as a result of the analysis method. A more accurate estimate of the production period is available through the estimation of the initial production period.
Data Analysis in Design Phase
- Design Phase
- Data Analysis Description
Due to the complex flow of the design work, it is difficult to understand the connection between the design works clearly. By visualizing the flow of design works and establishing the design process model based on the event log of the design work, it is possible to understand the connection between the design works. Due to the delays in the design process that occur in practice, it is necessary to understand the period in which the delay occurs and the flow of the workers.
By visualizing the delays in the planning phase, it is possible to know the current state of delay in each planning process and the cause of the delay. For the effectiveness of the design process, it is necessary to analyze the performance of the design process in terms of the performance of each part and worker and the workload of the design process. By analyzing the performance of the planning process for each case, job and worker, according to the frequency of the work and the time spent, it is possible to diagnose the current state of the process.
By analyzing the execution of the design process on each case, work and work, it is possible to diagnose the current state of the process based on the frequency of the work and the time consumed. It is possible to visualize the primary relationship above the standard, depending on the frequency of the relationship between the workers.
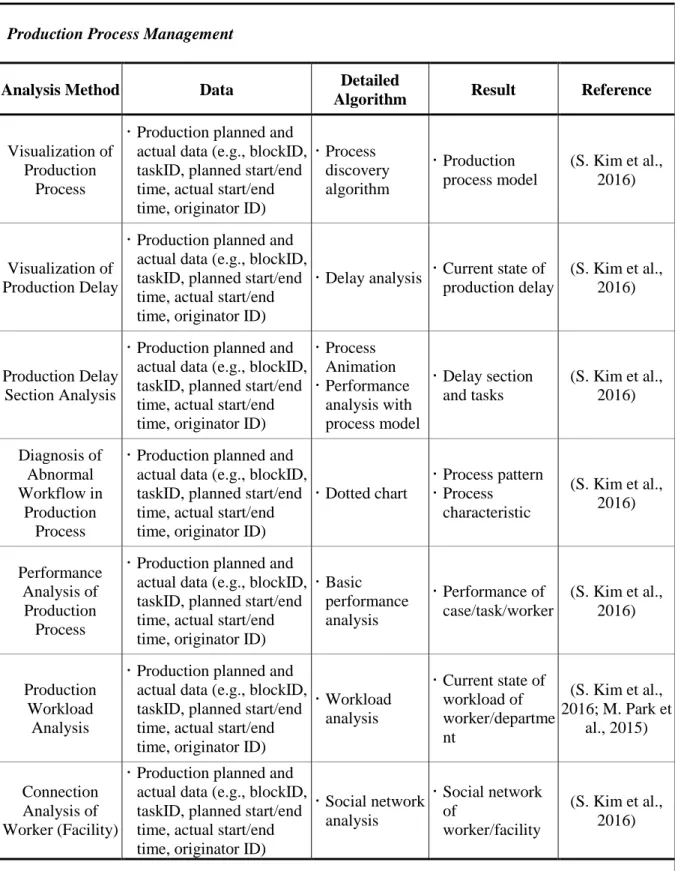
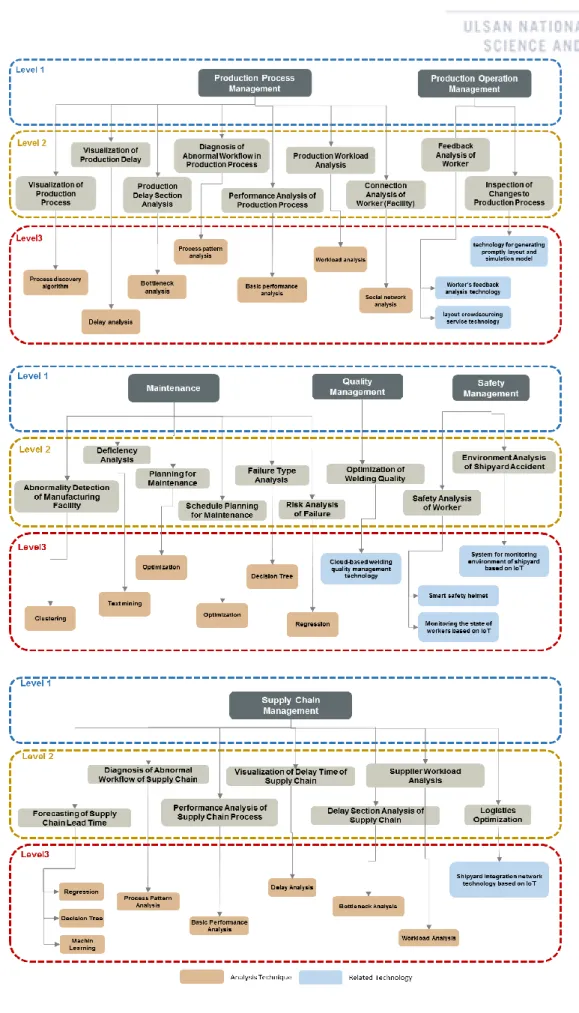
Data Analysis in Production Phase
- Production Phase
- Data Analysis Description
With comparative analysis between plan and actual data, the current state of production delay can be categorized from the period of the delay. From the analysis based on a dot diagram, it is possible to understand different patterns of processes. In addition, it is possible to minimize the delay of production processes by quick actions.
This is based on a problem level analysis that predicts asset life from asset usage data and condition information. From the diagram one can understand the cause of the shortage and the related problem. By analyzing supply chain data for furnishing products, it is possible to find the factors that affect the flow time and predict the flow time for each supply process.
By visualizing the delay in the supply chain, it is possible to understand the current state of delays in the supply of materials and components and to diagnose the cause of the delay. From the analysis, it is possible to find the bottleneck and the delayed process in the supply chain. It is possible to know the current state of the supplier's workload compared to the plans and to assess the efficiency of supply in each supply chain.
By applying this technology to the shipyard, it is possible to manage the location of the ship's blocks and transporters and to properly operate the shipyard.
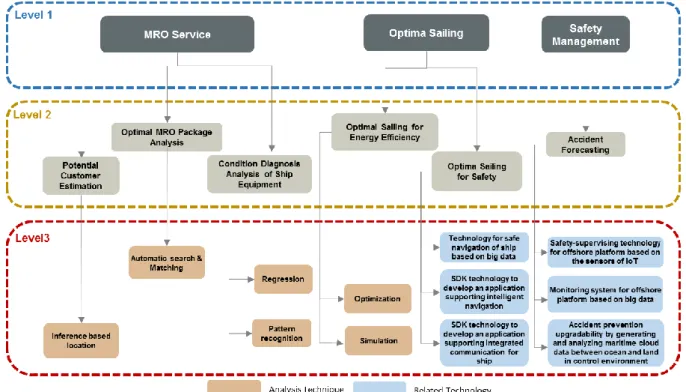
Data Analysis in Service Phase
- Service Phase
- Data Analysis Description
By supporting ship-to-ship and ship-to-land communication data exchanges in the wireless communication environment, it is possible to monitor the ship's condition and support the ship to navigate safely. The technology supports the development of software that adapts to complex ship management and the smooth sailing environment. Moreover, due to the support of ship collision avoidance data, it is possible to prevent marine collision accidents and improve comfort and safety for mariners.
For efficient use of the limited space of the ship and platform at sea, various facilities are densely installed. It is also possible to prevent accidents by magnifying and detecting potential disasters in the shipbuilding/sailing environment. In addition, by monitoring the health of workers, it is possible to minimize the loss of life from accidents and ensure the safety of workers.
By monitoring the marine environment, collecting data on the devices on the offshore platform and their comprehensive management, it is possible to monitor potential accidents during operation. In addition, ship navigation can be managed more efficiently by sharing ship information in real time.
Evaluation
Interview
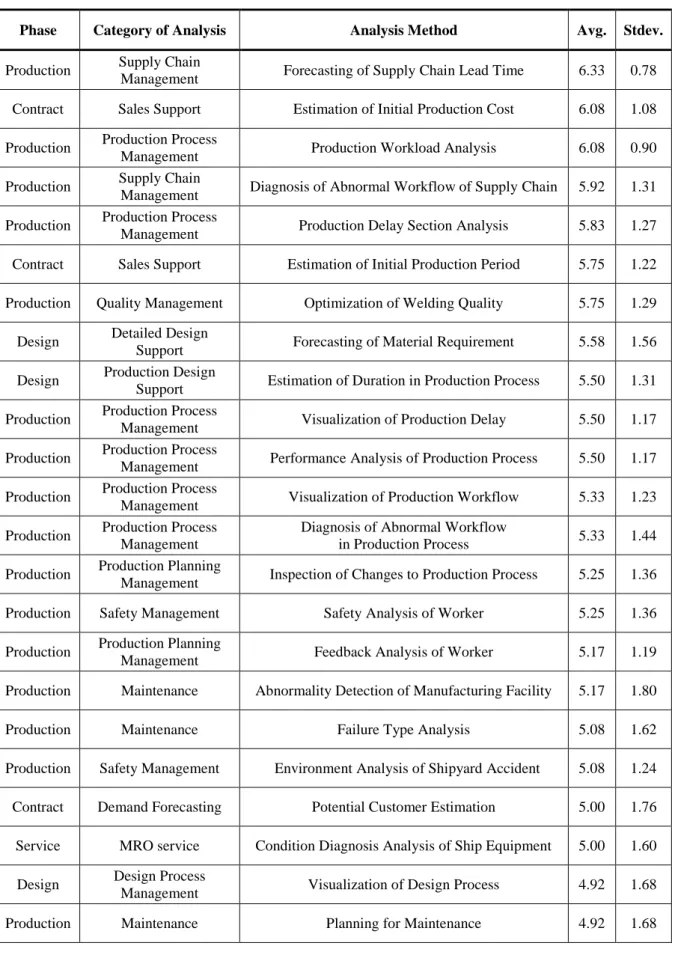
Results
Management forecast of supply chain lead time 6.33 0.78 Estimation of contract sales support of initial production costs 6.08 1.08 Manufacturing production process. Management Production delay Section analysis 5.83 1.27 Contract sales support Estimation of initial production period 5.75 1.22 Production quality management Optimization of welding quality 5.75 1.29. Management inspection of changes in the production process 5.25 1.36 Production safety Management safety analysis of employee 5.25 1.36 Production production planning.
Production Safety Management Environmental Analysis of Shipyard Accidents 5.08 1.24 Contract Demand Forecast Potential Customer Estimation 5.00 1.76 Service MRO Service Condition Diagnosis Ship Equipment Analysis 5.00 1.60. Management connection relationship Analysis of employee (facility service Optimal sailing Optimal sailing for energy efficiency 4.08 1.08 Design Initial design support Inference from similar case of ship 4.00 1.04. However, phases of design and services are rated as a less important phase for big data analysis in the shipbuilding industry.
Collaborative network analysis of design is the least important, with the method's average score being the lowest. There are three analysis methods that are most important, which are supply chain lead time forecasting, initial production cost estimation, and production workload analysis.
Discussion
They commented that the process mining technique would be useful and suitable for data analysis for supply chain management. Importance was assessed as the importance of the area in which the data analysis is applied or the impact of the data analysis. In terms of feasibility, the reference model does not consider some data analysis factors such as cost, data availability, and others.
However, the reference model provides such a feasible data analysis method that it was already implemented in the literature. The literature involves data analysis in the shipbuilding industry or similar fields applicable to the shipbuilding industry. Furthermore, this study provides insight into the data analysis for the practitioner in the shipbuilding industry.
In general, professionals in the shipbuilding industry have difficulty using big data analysis because they do not know what value they can derive in which area by performing data analysis. This thesis provides guidance on what data analysis can be performed to find results for a specific area in the shipbuilding industry.
Conclusion
Although most of the analysis methods are from the literature, there are some analysis methods that have not been verified. As for future work, more research needs to be done on how to apply big data analysis to the shipbuilding industry. For big data analysis, there are several prerequisites such as data acquisition, processing, storage and management.
Although this study only focused on the data analysis, it could be used to develop a reference model for the value chain of big data, from data generation to data analysis, in the shipbuilding industry. With the development of analysis techniques, it is required that the reference model be continuously updated. The scope of the analysis will be expanded, as currently impossible analyzes will be applicable in the future.
Fault pattern analysis and recovery prediction model Construction of pole transformer using data mining techniques. A pilot study on applying text mining tools in analyzing trends in the steel industry: A case study of the steel industry for the company “P”.