KEEI Research Report 17-25
Reform of the Progressive Electricity Tariff System and the New and Renewable Energy Market
Jinyeong So
Research Staff
Head Researcher: Jinyeong So, Research Fellow
Research Associates: Sangmin Jo, Research Fellow
Dasom Yun, Guest Researcher
Dain Kim, Public Intern
Euijong Jeong, CEO, Ace ENC
ABSTRACT 1. Background and Research Objective
One of the national agendas of the Moon administration is to supply 20% of the total power generation from renewable energy by 2030, and the government is formulating the ‘Renewable Energy 3020 Implementation Plan.’ Although no detailed plan has been announced yet, it seems that a total 53 GW of new installed capacity of renewable energy needs to be deployed by 2030, and 80% of them needs to come from solar photovoltaic (PV) and wind power (Ministry of Trade, Industry and Energy, 2017c, p. 1).
Small-scale renewable energy for household can be a good alternative for achieving the deployment targets of the Renewable Energy 3020. For example, the continuous decrease in the installation cost of a solar PV increased the economic feasibility of roof-top solar PV, and thus, more households could afford the system without government aid. Such economic feasibility was based on progressive electricity tariff system with excessive rate increases. However, the drastic easing of progressive rate at the end of 2016 has degraded the economic feasibility of a renewable energy for household and it may shrink relevant markets.
The purpose of this study is to quantitatively analyze the effect of the progressive electricity tariff system reform on renewable energy markets. Changes in the progressive electricity tariffs will have effects only on the electricity tariff for households, and, in turn, on the market for renewable energy mainly for households, which becomes the focus of this study.
It is also the purpose of this study to provide suggestions and recommendation for policy directions and measures in the case that the negative effects are big enough for the government to consider intervention to achieve the deployment targets.
2. Summary of Findings
Currently, only solar PV and fuel cell are deployed for households. In addition, the Act on Promotion of the Development, Use and Deployment of Renewable Energy classifies energy storage system (ESS) as one of the “renewable energy equipment.” So, the renewable energy sources for this study are confined to solar PV, fuel cell and ESS for households.
First, a model for economic feasibility analysis appropriate for reflecting the tariff change was constructed. A representative residential consumer with a representative installed capacity by each renewable energy source was assumed and used for economic analysis by applying the tariff schedule before the reform, first. It was assumed that a 3 kW roof- top solar PV system, a 1 kW fuel cell and a 3.3 kWh ESS was installed for each household with the average monthly consumptions of 350 kWh, 600 kWh and 450 kWh respectively. NPV (Net Present Value) of each case was calculated.
The calculated NPV of solar PV for the representative household was KRW 1,034,691. From the financial perspective, the NPV under the progressive electricity tariff system before the reform was more than zero. Accordingly, the representative household would have been to install a solar PV system without government support.
The NPV of the fuel cell was KRW -12,591,606. From the financial perspective, the negative NPV means that the representative household does not have economic incentive for installation of a fuel cell without government support under the progressive electricity tariff system before the reform.
The NPV of ESS was KRW 105,203. From the financial perspective, the NPV under the progressive electricity tariff system before the reform was more than zero. Accordingly, the representative household has an economic incentive to install an ESS without government support.
Second, the economic analysis schemes developed above was utilized to see how the market of each renewable energy source was affected qualitatively and quantitatively by the reform. The analysis results indicates that households with average monthly consumption of 310 kWh or more have economic incentive for installation of 3 kW roof-top solar PV, as their NPVs are greater than zero under the tariff system before the reform. However, the threshold becomes the average monthly consumption of 334 kWh after the reform and the potential markets shrinks accordingly.
As for fuel cells, the threshold of the average monthly consumption of electricity for economic feasibility was 807 kWh before the reform, but no households have economic incentives for installation of fuel cell after the reform, as the NPVs for entire range of average monthly consumption of electricity had a negative (-) value. In other words, before the reform, there was a small number of potential households that had an economic incentive to install fuel cells without government
of 442 kWh per month before the reform, but the reform eliminated economic incentives for entire range of households, like fuel cell.
Next, an economic analysis under the progressive tariff system after the reform was conducted for smaller installed capacities than 3 kW, the standard for a roof-top solar PV system in South Korea. The unit costs for the 3 kW system was applied, first. The result shows that a considerable number of households, which had showed no economic feasibility with installed capacity of 3 kW, came to have an economic incentive by installing a smaller capacity. In the case of 1 kW, the threshold was 212 kWh and it was 273 kWh in the case of 2 kW. Furthermore, the NPVs of the 1 kW system was highest among three installed capacities for the monthly power consumption of 212~300 kWh range. The NPV of the 2 kW system was highest among them for the monthly power consumption of 300~380 kWh ragge. 3 kW showed the best economic feasibility for 380 kWh or above. This result demonstrates that economic feasibility is not proportional to the installed capacity, and an adequate capacity of roof-top solar PV must be determined depending on the power consumption of each household. It also indicates that the market for the roof-top solar PV can be enlarged by deploying roof-top solar PV with various installed capacities.
Finally, another economic analysis was conducted under the assumption that the surplus power, which was carried over to the next month but was still not consumed and thus not compensated under the current net-metering system, came to be compensated by electricity retail price. It turned out that the economic impact varied depending on how the surplus power was dealt with; however, the range of effect was restrictive.
3. Implications
From the above analysis results, the following policy suggestions have been derived to enlarge the markets of renewable energy systems for residential use. First, we found that the economic feasibility of roof-top solar PV system is not proportional to the installed capacity of the system and smaller installed capacity can be appropriate size for households with low electricity consumption. Thus, it is recommended that the foundations for deploying roof-top system with smaller installed capacities need to be strengthened, while maintaining the existing deployment policy of the 3 kW standard model.
Second, the analysis revealed that the economic feasibility of renewable energy system for households was deteriorated significantly as the result of the reform. Accordingly, it is necessary to revise the details of the policy measures and programs in a way to increase unit support level, as well as entire budget for support programs, if the government intends to maintain or increase the level of renewable energy deployment as committed in the Renewable Energy 3020.
Third, reform of the net-metering system may increase the economic feasibility, which can possibly contribute to the expansion of the market. However, it has to go with development of the relevant infrastructure, such as the Advanced Metering Infrastructure (AMI), and new tariff system, such as the time-of-use (TOU).
Finally, increase in public awareness on economic benefits of smaller size of installed capacity of roof-top solar PV may help attract relevant consumers and targeted campaign using the result of the economic analysis could help to increase the awareness. Also, dissemination of accurate information on radiation data or capacity factors in the regional level or locational level and others information could aid consumers’ informed decision making.
Table of Contents
Chapter 1. Introduction ... 10
Chapter 2. Conditions and Status of the New and Renewable Energy Market ... 13
1. New and Renewable Energy in Korea Today ... 13
A. New and Renewable Energy Supply ... 13
B. Household New and Renewable Energy in the Power Generation Sector ... 17
C. Global New and Renewable Energy Trends ... 20
2. Electricity Tariff System for Households ... 22
A. Electricity Tariff Rates ... 22
B. Net Metering ... 26
C. Nighttime Electricity ... 27
3. Household Electricity Consumption and the New and Renewable Energy Market ... 27
A. Distribution of Households by Home Type ... 28
B. Residential Electricity Consumption ... 28
C. Potential for Household PV Installations ... 31
Chapter 3. Financial Feasibility of New and Renewable Energy... 33
1. Overview... 33
A. Literature Review ... 33
B. Preconditions ... 35
2. Financial Feasibility Analysis of PV Installations ... 37
A. Main Assumptions... 37
B. Financial Feasibility Analysis ... 38
3. Financial Feasibility of Fuel Cells ... 45
A. Main Assumptions... 46
B. Feasibility Analysis ... 47
4. Energy Storage Systems (ESS) ... 49
A. Main Assumptions... 50
B. Feasibility Analysis ... 50
Chapter 4. Effects of the Electricity Tariff Rate Reform... 54
1. Quantitative and Qualitative Changes in the PV Market ... 54
A. New and Renewable Energy Market Prior to Tariff Reform ... 54
B. Post-Reform Market ... 55
C. Effect of the Electricity Tariff Reform on the Potential PV Market ... 59
2. Quantitative and Qualitative Changes in the Fuel Cell Market ... 61
A. Pre-Reform Market ... 61
B. Post-Reform Market ... 63
C. Effects of Electricity Tariff Reforms on the Potential Household Fuel Cell Market ... 64
3. Changing Feasibility of ESS ... 65
4. Analysis of the Feasibility of PV Installations Under the Current Progressive Tariff System ... 67
A. Analysis of the Feasibility of Small-Scale PV Installations ... 67
B. Net-Metering Effects of Surplus Power by PV Installation Capacity ... 70
Chapter 5. Policy Implications ... 71
1. Distributing Smaller-Scale PV Installations to Reduce Progressive Tariffs... 71
2. Updating Policy Support Measures... 71
3. Diversifying Household Electricity Tariffs and Preparing for Net Metering ... 72
4. Providing Trustworthy Information and Strengthening Public Relations ... 72
5. Improving Market Conditions... 73
References ... 75
List of Tables
Table 2-1. New and Renewable Energy Outputs by Year ... 14
Table 2-2. New and Renewable Energy Output by Year ... 16
Table 2-3. HESP 2017 Criteria by Energy Type ... 17
Table 2-4. HESP Subsidies Awarded by Year ... 18
Table 2-5. HESP Subsidy Trend ... 19
Table 2-6. Electricity Tariff Rates Differentiated by Function ... 24
Table 2-7. Electricity Tariff Rates for Households by Bracket (Before Tariff Reform) ... 24
Table 2-8. Electricity Tariff Rates for Households by Bracket (After Reform) ... 25
Table 2-9. Average Monthly Electricity Bill Before and After the Tariff Reform (Low-Voltage Households) ... 25
Table 2-10. Number of Users Entering KEPCO Net-Metering Contracts by Year... 27
Table 2-11. Household Distribution in Korea by Housing Type and Total Floor Area (2016) ... 28
Table 2-12. Distribution of Homes by Type: Homes with Registered Household Heads (2016) ... 28
Table 2-13. Electricity Supply Statistics by Contract Type ... 29
Table 2-14. Distribution of Households by Average Monthly Electricity Consumption Level (2016) ... 30
Table 2-15. Distribution of Households by Home Type and Electricity Consumption Level (December 2016)... 30
Table 2-16. Potential Increases in Household PV Installations by Home Type (2016) ... 32
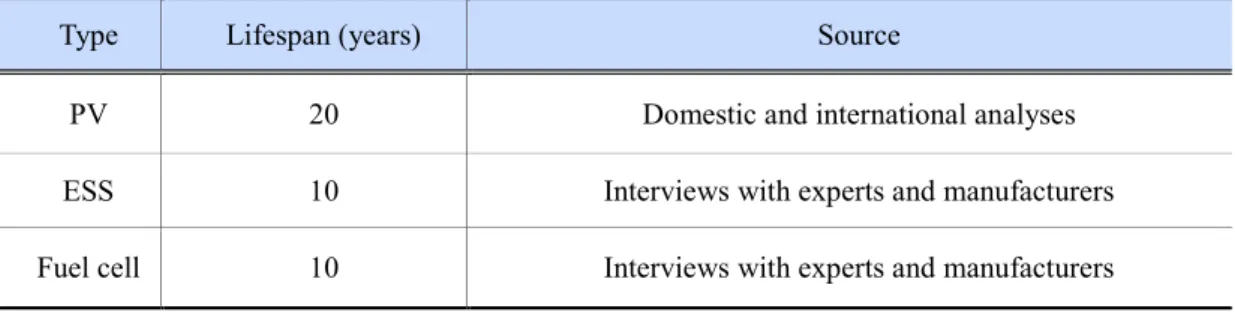
Table 3-1. Representative Capacities of Household New and Renewable Energy Systems for the HESP ... 36
Table 3-2. Expected Lifespan of Household New and Renewable Energy Systems ... 36
Table 3-3.Unit and Total Costs of Installation: PV System ... 37
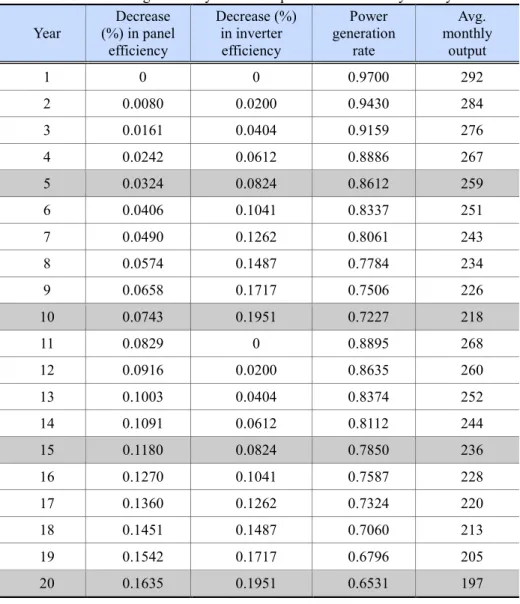
Table 3-4. Rate of Performance Decline: PV System ... 38
Table 3-5. Main Assumptions and Preconditions for Analysis: PV System ... 38
Table 3-6. Average Monthly Power Output of a 3-kW PV System by Year ... 39
Table 3-7. Pre-Reform Electricity Bills by Consumption Level ... 40
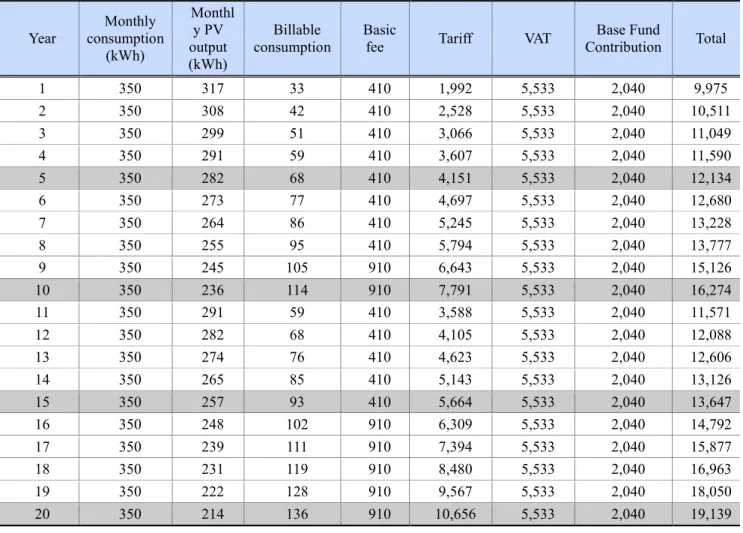
Table 3-8. Average Monthly Electricity Bill by Year: Representative Household with a PV Installation ... 41
Table 3-9. Net Cash Flow for a PV-Installed Household by Year ... 42
Table 3-10. NPV Sensitivity Analysis for the Representative Household PV System: Variations in Installation Costs and Discount Rates ... 43
Table 3-11. Average Monthly Electricity Bill by Year: PV System, Operating Rate of 14.93% ... 44
Table 3-12. NPV Sensitivity Analysis for the Representative Household PV System: Variations in Installation Costs and Operation Rates ... 45
Table 3-13. Main Assumptions and Preconditions of Analysis: Household Fuel Cell ... 47
Table 3-14. Monthly Price of City Gas for Fuel Cell Operation ... 47
Table 3-15. Net Cash Flow by Year: Fuel Cell ... 48
Table 3-16. NPV Sensitivity Analysis: Fuel Cell ... 49
Table 3-17. ESS Specifications ... 50
Table 3-18. Main Assumptions and Preconditions of Analysis: ESS ... 50
Table 3-19. Monthly Electricity Consumption by Year Following ESS Installation: Subject to the Residential Tariff Rate
... 51
Table 3-20. Monthly Electricity Billing Amounts After ESS Installation ... 51
Table 3-21. Net Cash Flow for an ESS-installed Household by Year ... 52
Table 3-22. NPV Sensitivity Analysis: ESS ... 53
Table 4-1. NPVs of PV Installations Under the Six-Stage Electricity Tariff System (Pre-reform) ... 54
Table 4-2. Household Electricity Tariffs After Reform ... 56
Table 4-3. Monthly Electricity Bill of the Representative Household by Year After PV Installation ... 57
Table 4-4. Annual Cash Flow of a Representative Household with a PV Installation ... 58
Table 4-5. NPVs of PV Installations Under the Three-Stage Progressive Electricity Tariff System (Reformed System) ... 59
Table 4-6. Potential Size of the Household PV Market: Before and After Electricity Tariff Reform ... 60
Table 4-7. Comparison of NPVs for PV-Installed Households Before and After the Electricity Tariff Reform ... 60
Table 4-8. Monthly City Gas Prices for the Operation of Fuel Cell Installations ... 62
Table 4-9. NPVs of Fuel Cell-Installed Households Under the Six-Stage Progressive Electricity Tariff System (Pre- reform System) ... 62
Table 4-10. Annual Cash Flow of the Representative Fuel Cell-Installed Household (Post-reform) ... 63
Table 4-11. NPVs of Fuel Cell-installed Households Under the Three-Stage Progressive Electricity Tariff System (Post- reform) ... 63
Table 4-12. Comparison of NPVs for Household Fuel Cells Before and After Tariff Reform... 64
Table 4-13. Electricity Bill of a Representative ESS-Installed Household After Tariff Reform ... 66
Table 4-14. Annual Cash Flow of a Representative ESS-Installed Household After Tariff Reform ... 66
Table 4-15. Comparison of NPVs for the Representative ESS Installation Before and After Tariff Reform ... 67
Table 4-16. NPVs for PV Installations by Capacity and Monthly Electricity Consumption ... 68
Table 4-17. NPVs of PV Installations by Capacity and Monthly Electricity Consumption: Readjusted Unit Prices ... 69
List of Figures
Figure 2-1. Present Status and Future Outlook: Energy-Generating Facilities Worldwide ... 21
Figure 2-2. New and Renewable Energy Policies Worldwide by Sector ... 21
Figure 2-3. Structure of the Electricity Market in Korea ... 22
Figure 2-4. Unit Electricity Bills Before and After the Tariff Reform ... 26
Figure 2-5. Daily Load Pattern of Household Electricity Consumption and Household PV Power Output ... 26
Figure 2-6. Trends in Household Use of Nighttime Electricity ... 31
Figure 3-1. NPV Sensitivity Analysis for the Representative Household PV System: Variations in Installation Costs and Discount Rates ... 43
Figure 3-2. NPV Sensitivity Graph for the Representative Household PV System: Variations in Installation Costs and Operation Rates ... 45
Figure 3-3. NPV Sensitivity Graph: Fuel Cell ... 49
Figure 3-4. NPV Sensitivity Graph: ESS ... 53
Figure 4-1. NPVs of PV Installations Under the Six-Stage Electricity Tariff System (Pre-reform) ... 55
Figure 4-2. NPVs of PV Installations Under the Three-Stage Progressive Electricity Tariff System (Reformed System) ... 59
Figure 4-3. Comparison of NPVs for PV-Installed Households Before and After the Electricity Tariff Reform ... 61
Figure 4-4. NPVs of Fuel Cell-Installed Households Under the Six-Stage Progressive Electricity Tariff System (Pre- reform System) ... 62
Figure 4-5. NPVs of Fuel Cell-installed Households Under the Three-Stage Progressive Electricity Tariff System (Post- reform) ... 64
Figure 4-6. Comparison of NPVs for Household Fuel Cells Before and After Tariff Reform ... 64
Figure 4-7. Comparison of NPVs for the Representative ESS Installation Before and After Tariff Reform... 67
Chapter 1. Introduction
As part of its policy agendas, the Moon Jae-in Administration plans to increase the share of new and renewable energy in Korea’s total power generation to 20 percent by the year 2030. To achieve this goal, the South Korean government has assembled a joint committee of civil officials and private-sector experts, tasked with the development of the Renewable Energy Implementation Plan (REIP) 3020. While the committee has yet to finalize the details of the plan, the general expectation is that new renewable energy facilities capable of generating up to 53 gigawatts (GW) will be established in Korea by 2030, and approximately 80 percent of the required capacity will be provided by solar photovoltaic (PV) and wind energy (Ministry of Trade, Industry, and Energy (MOTIE), 2017c, p. 1).
Some question, however, whether these are realistic targets that can actually be achieved in Korea. These doubts stem mainly from: financial worries, such as what will happen if the increased supply of renewable energy fails to raise electricity tariff rates; the recognition of physical limitations, as in, the shortage of required resources; and technical issues, such as whether the existing power grid system can stably accommodate the proposed increase in renewable energy supply. In some cases, the willingness (or lack thereof) of local communities to accept renewable energy may also prove to be a hindrance as well. The joint committee is taking time to review each of these important issues before finalizing any type of plan.
Increasing the installation of household renewable energy facilities, as opposed to utility-scale facilities, may be an integral part of overcoming many of the financial, physical, and political issues associated with the REIP 2030. Household renewable energy facilities may provide a solution for several reasons. First, the majority of utility-scale sources of new and renewable energy fall short of grid parity and therefore cost more than conventional energy sources to generate power.
New and renewable energy still represents a relatively small share of Korea’s power system, and has therefore not yet exerted enough pressure on the economy to increase tariff rates. As the supply of new and renewable energy continues to increase, however, electricity tariffs may rise in the future. Household PV installations, on the other hand, are the only form of renewable energy installation that has reached grid parity without government aid and are therefore relatively free from concerns associated with energy tariffs. However, government subsidies for these installations draw upon the Base Fund for the Power Industry or other parts of the public budget. These subsidies may not directly raise tariff rates, but might end up passing the financial burden of subsidization onto the public in the form of taxes and other fees.
Second, some sources of new and renewable energy, such as PV and wind power, tend to be more land-intensive than fossil fuels. Unlike utility-scale facilities for new and renewable energy, household PV systems are typically installed in relatively small areas, such as on the rooftops or balconies of residential buildings, and rarely require additional space.
Household PV installations are an attractive energy option because they maximize the generation of new and renewable energy using the limited space available in Korea.
Finally, many projects for the utility-scale development of new and renewable power facilities have run into the resistance of local communities. Since household PV systems are installed on an individual basis, they are virtually unaffected by this political problem. Since households PV systems are small-scale systems that only provide power for the individual homeowner, they rarely, if ever, generate conflict in the local community.
There is indeed a growing emphasis worldwide on increasing the distribution of small-scale and decentralized systems for the generation of new and renewable energy. Bloomberg New Energy Finance (BNEF, 2017, p. 35), for example, projects that decentralized and small-scale PV energy will increase its share in the gross power output from three percent (as of 2016) to 10 percent by 2040. Projections like this strongly suggest that Korean policymakers ought to give priority consideration to small-scale new and renewable facilities, including household installations, in order to successfully realize the REIP 3020.
The continued decrease in the cost of PV installation has, in fact, increased the financial feasibility of household installations, as well as the number of households installing these systems without any government financial aid. Industry insiders estimated in 2014 that an average of 5,000 households newly installed PV systems without government subsidies each year, and projected that this number would only continue to increase in the coming years. In fact, the unit cost of installing a household PV system dropped by 23 percent, from between KRW 2.3 to 2.6 million per kilowatt (kW)1 as of 2014 to between KRW 1.8 million per kW as of early 2017. In 2014, the Korean government dropped households with PV systems from their subsidies list, recognizing that these households had reached grid parity by generating and consuming an average of at least 450 kilowatts per house (kWh) per month. The Korean government also sought to increase household PV installations by introducing a PV system rental business model and encouraging private-sector PV developers to
1 The unit cost of KRW 7,000,000 to 8,000,000 per three kW in Table 4-3 of So (2014, p. 85) has been converted into the cost per kW.
actively participate in the model.
Another important factor that has contributed to the growing financial appeal of household PV installations is the progressive electricity tariff for households in Korea. The electricity tariff system consists of six tariff brackets, and households in the highest bracket pay 1170 percent more in electricity tariffs than households in the lowest bracket. Under this system, households using large amounts of electricity have a strong incentive to install PV systems because the tariff rate in the highest tariff bracket is greater than the cost of PV installation. However, in 2016, the Korean government finalized and announced plans to reform the progressive tariff scheme, a decision which is expected to have far-reaching effects on the Korean power market. The Taskforce of Administration Officials and Governing Party Members for Electricity Tariff Reforms began their discussion of possible progressive tariff rate reforms in response to high power demands in the summer of 2016 (for air-conditioning due to the intense heat). The government accepted the taskforce’s Plan for the Alteration of the Electricity Supply Agreement, which called for: lowering the progressive tariff rates for households; increasing discounts for minorities and schools; and introducing new incentives and lowered tariff rates for households making eco-friendly investments in energy. More specifically, the reform plan involved replacing the six- bracket progressive scheme of 1170 percent with a three-stage progressive scheme of 300 percent (MOTIE, 2016a, p. 2).
This decrease in household electricity tariff rates is expected to exert various effects on the new and renewable energy market in Korea. For example, the reformed tariff system introduces different variables that alter the financial appeal and incentives associated with new and renewable energy and have the power to change the market for better or worse. At the present time, there are worries that the drop in the electricity tariffs under the reform plan could suppress the growth of the new and renewable energy market by decreasing the financial feasibility of household installations of PV energy, fuel cells, and so forth.
Before hastily deriving policy implications from this pessimistic projection, we must carefully examine and analyze the direction, magnitude, and specific effects that the reformed tariff system could potentially exert on the new and renewable energy market. Government intervention in the renewable energy market would only be justified if the potential harmful effects of the tariff reform were sufficiently large. The exact form of appropriate intervention, if any, should also be determined through the collection and analysis of all pertinent information. In other words, quantitative and qualitative analyses are needed to determine whether it is necessary to revisit and change/supplement the new and renewable energy programs established under the older tariff system, and, if so, what kinds of measures and tools should be used.
This study aims to provide a quantitative analysis of the potential effects of the reformed tariff system on the new and renewable energy market in Korea. More specifically, this study examines how the reformed tariff system affects the financial feasibility of household energy installations, and how changes in financial feasibility affect the household new and renewable energy market, which had been tailed to the former progressive electricity tariff system. In addition, this study analyzes whether policy intervention is needed, and, if so, what kinds of policy changes are needed to ensure the growth of the new and renewable energy industry in Korea and meet the targets of the REIP 3020.
Considerable amounts of public resources and the active participation of all stakeholders will be needed to realize the goals of REIP 3020. By analyzing how the distribution of household renewable energy installations—relatively free of the political and financial issues associated with utility-scale power facilities—contribute to the Moon Administration’s new and renewable energy goals, and identifying the policy changes needed to increase the distribution of household installations, this study may help policymakers establish and achieve the national goals of renewable energy supply in a more cost-effective way.
This study is structured as follows. Chapter 2 provides an analysis of the basic statistics needed to accurately estimate the likely impact of the progressive tariff reform on the new and renewable energy market in Korea. Chapter 2 also provides information on the existing tariff system and the distribution of households in Korea by monthly energy consumption as well as an analysis of the changes introduced by the tariff reform.
Chapter 3 surveys existing literature and introduces diverse models that are used to analyze the financial feasibility of new and renewable energy. This chapter also presents a new feasibility analysis model that has been developed by the author for the purpose of estimating changes in household use of different types of new and renewable energy. Following its introduction, the model is then used to determine the financial feasibility of each type of renewable energy using the specs of a hypothetical average household and system. A variety of hypotheses and assumptions are tested to analyze the financial feasibility of renewable energy, and sensitivity analyses are conducted to test the robustness of each model. Since the cost of household PV installations has been rapidly declining and is expected to continue to do so in the coming years, the sensitivity analysis of PV installation costs can also be seen as an analysis of potential decreases in future installation costs. The feasibility analysis model (and its technical details) as well as test hypotheses and assumptions were developed
Chapter 4 provides a comparison of the size of the renewable energy market before and after tariff rate reforms were introduced, using the framework of analysis provided in Chapter 3. The average monthly electricity consumption levels of marginal households—who have the motive to install renewable energy systems at their own expense without government aid—were estimated before and after the tariff reform, and the number of target households was also estimated using the distribution of households by average monthly electricity consumption. An additional analysis was also performed to determine how the financial appeal of household renewable energy installations could be increased under the reformed tariff system. Chapter 5 discusses policy implications and proposes measures for fostering the renewable energy market based upon the results of the foregoing analyses.
Chapter 2. Conditions and Status of the New and Renewable Energy Market 1. New and Renewable Energy in Korea Today
A. New and Renewable Energy Supply
New and renewable energy output in the primary energy sector has increased an average of 10.9 percent a year since 2006. In 2015, this output reached 13,293,000 tons of oil equivalent (TOE), representing 4.6 percent of the nation’s gross output in the primary energy sector. Renewable energy accounted for an overwhelming percentage—98.2 percent—of this output, with new energy playing only a small role. However, new energy output has also continued to increase at an astounding rate of 72.9 percent a year on average.
As of 2015, energy from waste (EfW) accounted for the majority (63.5 percent) of new and renewable energy output, followed by bioenergy (20.8 percent). Together, these sources account for nearly 85 percent of all new and renewable energy generated in Korea, indicating a disproportionate preference in Korea for these two alternative energy sources. Solar PV energy accounted for only 6.4 percent; however, its output has increased 68.5 percent a year on average since 2006.
Wind energy, which was more popular than PV energy up until 2010 or so, saw its share reduced to 2.1 percent as of 2015.
Fuel cell energy output has also been growing rapidly at 72.8 percent a year on average. Solar and hydro energy, which were the two main forms of alternative energy distributed nationwide in the early years of new and renewable energy, have seen their respective outputs continue to decrease. Heat from seawater, which was included as a renewable energy for the first time in 2015, accounted for 4,791 TOE of the new and renewable energy generated the same year. Integrated gasification combined cycles (IGCCs), also categorized as new energy for the first time in 2015, produced an output of 1,285 TOE that same year.
Table 2-1. New and Renewable Energy Outputs by Year
Type 2006 2007 2008 2009 2010 2011 2012 2013 2014 2015
Rate of increase (2006–
2015) Total (TOE) 5,225,192 5,608,776 5,858,481 6,086,249 6,856,284 7,582,845 8,850,739 9,879,207 11,537,36
6
13,292,99
0 10.9%
Renewable subtotal 5,223,522 5,606,944 5,854,113 6,067,056 6,813,938 7,519,502 8,768,229 9,756,791 11,337,99 7
13,061,53
2 10.7%
New subtotal 1,670 1,832 4,367 19,193 42,347 63,344 82,510 122,416 199,369 231,458 73.0%
Re- newable
energy
Solar 33,018 29,375 28,036 30,669 29,257 27,435 26,259 27,812 28,485 28,469 -1.6%
PV 7,756 15,325 61,128 121,731 166,152 197,198 237,543 344,451 547,430 849,379 68.5%
Wind 59,728 80,763 93,747 147,351 175,644 185,520 192,674 242,354 241,847 283,455 18.9%
Hydro 867,058 780,899 660,148 606,629 792,294 965,373 814,933 892,232 581,186 453,787 -6.9%
Marine n/a n/a n/a n/a 223 11,246 98,310 102,077 103,848 104,731 242.3%
Geother
mal 6,208 11,114 15,726 22,126 33,449 47,833 65,277 86,959 108,472 135,046 40.8%
Heat from seawater
n/a n/a n/a n/a n/a n/a n/a n/a n/a 4,791 n/a
Bio 274,482 370,159 426,760 580,419 754,623 963,363 1,334,724 1,558,492 2,821,996 2,765,657 29.3%
Wastes 3,975,272 4,319,309 4,568,568 4,558,131 4,862,296 5,121,534 5,998,509 6,502,414 6,904,733 8,436,217 8.7%
New energy
Fuel
cells 1,670 1,832 4,367 19,193 42,347 63,344 82,510 122,416 199,369 230,173 72.9%
IGCCs n/a n/a n/a n/a n/a n/a n/a n/a n/a 1,285 n/a
Source: Korea Energy Agency (KEA, 2016, pp. 22-23).
In 2015, total new and renewable energy output amounted to 37,079 gigawatts per hour (GWh)—up 37.9 percent from the previous year—and represented 6.6 percent of the nation’s gross energy output. As for the capacity of power generation facilities, the combined capacity of new and renewable facilities and installations was 13.7 GW—up 15.8 percent from the previous year—and accounted for 11.9 percent of the gross facility capacity. Renewable energy output has been growing by 28 percent annually on average, while new energy output has been growing at an astounding rate of 76.2 percent a year on average, thanks largely to the growing demand for fuel cells.
In 2105, EfW output was 22,469 GWh, or 60.6 percent of the entire new and renewable energy output. Bioenergy was the next-largest source of new and renewable energy output, accounting for 15.0 percent, followed by PV, the third-largest, at 10.7 percent. In the power generation sector, much as in the primary energy sector, EfW and bioenergy were the predominant sources of new and renewable energy output, accounting for 75 percent of total new and renewable power generation. The share of bioenergy grew steadily from 4.0 percent in 2006 to 9.9 percent in 2009, before it began to decrease. The dramatic increase in energy output from wooden pallets in 2014, however, raised the share of bioenergy to 17.3 percent that year. The share of PV energy in the entire new and renewable energy output was insignificant in 2006 at only 0.8 percent, but the continued increase in the capacity of PV energy facilities raised the source’s share to 10.7 percent by 2015. The share of wind energy, which rose from 6.1 percent in 2006 to 14.8 percent in 2009, has been decreasing steadily since 2009, dropping to as low as 3.6 percent in 2015. This decrease stems from the fact that PV energy is now preferred to wind energy. In 2006, hydropower accounted for the largest proportion (89 percent) of the total new and renewable energy output, but dropped significantly to 5.8 percent in recent years due to the lack of new hydropower plants and dwindling output from existing plants.
Table 2-2. New and Renewable Energy Output by Year
Type 2006 2007 2008 2009 2010 2011 2012 2013 2014 2015
Rate of increase (2006-
2015) Total (MWh) 3,899,368 4,394,830 4,227,477 4,617,886 5,889,553 17,345,64
7
19,498,06 4
21,437,82 2
26,882,19 0
37,078,86
3 28.4%
Renewable
subtotal 3,892,687 4,386,308 4,207,167 4,528,616 5,692,594 17,051,02 6
19,108,40 0
20,859,24 4
25,939,13 4
35,983,51
4 28.0%
New subtotal 6,681 8,522 20,310 89,270 196,960 294,621 389,664 578,578 943,056 1,095,349 76.2%
Re- newable
energy
PV 31,022 71,279 284,315 566,191 772,801 917,198 1,103,227 1,605,182 2,556,300 3,979,159 71.5%
Wind 238,911 375,641 436,034 685,353 816,950 862,884 912,760 1,148,179 1,145,557 1,342,439 21.1%
Hydro 3,468,233 3,632,089 3,070,458 2,821,530 3,685,090 4,490,107 3,862,087 4,228,112 2,753,924 2,150,013 -5.2%
Marin
e n/a n/a n/a n/a 1,039 52,307 465,924 483,777 492,172 496,354 243.4%
Bio 154,521 307,299 416,359 455,542 416,713 524,623 1,027,251 1,839,568 4,656,237 5,546,583 48.9%
Waste
s n/a n/a n/a n/a n/a 10,203,90
7
11,737,15 1
11,554,42 6
14,334,94 4
22,468,96
6 21.8%
New energy
Fuel
cells 6,681 8,522 20,310 89,270 196,960 294,621 389,664 578,578 943,056 1,089,260 76.1%
IGCC
s n/a n/a n/a n/a n/a n/a n/a n/a n/a 6,089 n/a
Source: KEA (2016, pp. 24-25).
B. Household New and Renewable Energy in the Power Generation Sector
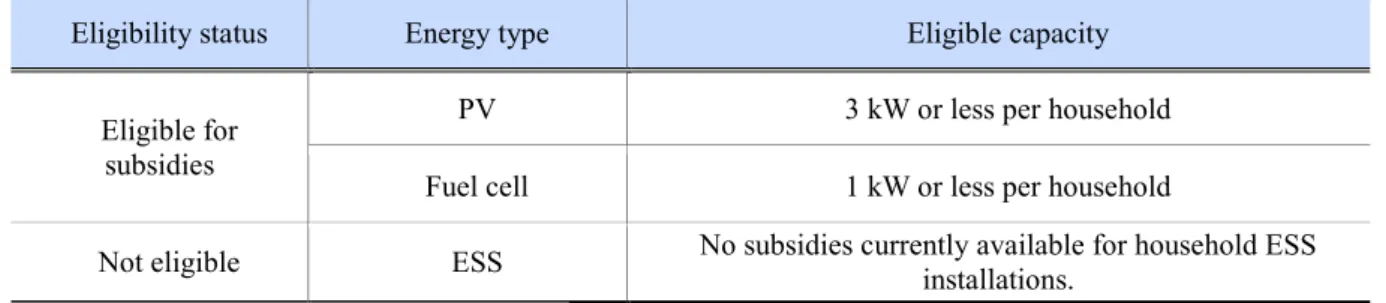
This study focuses primarily on household installations of new and renewable energy subject to the direct effects of the electricity tariff system reform. Table 2-3 summarizes tariff subsidization criteria by energy type and installation capacity level, as outlined in the Household Energy Subsidization Program (HESP) by the MOTIE (2017a, p. 3). As can be seen in the table, the types of new and renewable energy eligible for government subsidies are PV, solar, geothermal energy, and fuel cells. However, only PV and fuel cells are eligible for subsidies for facility installation; to date, there have been no recorded installations of geothermal facilities for household use in Korea. Subsidies for household PV installations vary by housing type— detached houses vs. collective housing (e.g., apartments). Subsidies for detached households are subdivided based on each household’s average monthly electricity consumption—up to 2.0 kW for the first category and from 2.0kW to 3.0 kW for the second category. Subsidies for households in the first category (2.0 kW and below) range from KRW 410,000 to KRW 1,380,000 per kW, while subsidies for households in the second category (greater than 2.0 kW) range from KRW 350,000 to KRW 1,170,000 per kW. For collective housing, each self-standing unit may claim subsidies of up to 30 kW of PV energy generated, at a flat subsidy rate of KRW 1,320,000 per kW.
Subsidies are provided for fuel cell installations with a capacity of up to 1 kW, at a flat rate of KRW 22,750,000 per kW.
The government provides larger subsidies for PV and fuel cell installations for households located on islands.
Table 2-3. HESP 2017 Criteria by Energy Type
(Unit: KRW 1,000, including V.A.T.)
Energy type Subsidy type* Unit subsidy Unit subsidy
for islands
PV (fixed)
Detached houses
Up to and including 2.0
kW
Above 650kWh 410/kW 490/kW
600kWhto 650kWh 550/kW 660/kW
550kWh to 600kWh 690/kW 830/kW
500kWh to 550kWh 830/kW 1,000/kW
450kWh to 500kWh 1,240/kW 1,490/kW
450kWh or below 1,380/kW 1,660/kW
Greater than 2.0 kW and up
to and including 3.0
kW
Above 650kWh 350/kW 420/kW
600kWh to 650kWh 470/kW 560/kW
550kWh to 600kWh 580/kW 700/kW
500kWh to 550kWh 700/kW 840/kW
450kWh to 500kWh 1,050/kW 1,260/kW
450kWh or below 1,170/kW 1,400/kW
Collective housing
Up to and including 30W
per self-standing unit 1,320/kW 1,580/kW
Solar
Flat-panel and vacuum- tube types
7.0㎡ and less
Greater than
10.0MJ/m2·day 590/m2 710/m2
7.5MJ/m2·day to
10.0MJ/m2·day 550/m2 660/m2
7.5MJ/m2·day or below 500/m2 600/m2 Greater than
7.0㎡ and up to and including
14.0㎡
Greater than
10.0MJ/m2·day 520/m2 620/m2
7.5MJ/m2·day to
10.0MJ/m2·day 480/m2 570/m2
7.5MJ/m2·day or less 440/m2 520/m2 Greater than
14.0㎡ and up to and
Greater than
10.0MJ/m2·day 470/m2 560/m2
7.5MJ/m2·day to
10.0MJ/m2·day 430/m2 510/m2
Energy type Subsidy type* Unit subsidy Unit subsidy for islands including 20㎡ 7.5MJ/m2·day or less 390/m2 460/m2 Natural
cycle water heaters
6.0㎡ 2,670/unit 3,210/unit
Geothermal Horizontal-closed 10.5kW or less 640/kW 760/kW
10.5kW to17.5kW 490/kW 590/kW
Fuel cells Up to and including 1kW 22,750/kW 27,300/kW
Source: MOTIE (2017a, p. 3).
Note: *Subsidies contingent upon household and installation type, average monthly level of electricity consumption, installation capacity levels, and installation performance.
Table 2-4 summarizes the amount of government subsidies awarded each year on behalf of the HESP. The amount of money spent on subsidies and the number of recipient households increased up until 2012 under the Lee Myung-bak Administration, due to the government’s emphasis on “green growth” and increasing the supply of new and renewable energy during this time. This subsidization trend, however, began to subside in 2013 after the Park Geun-hye Administration came to power.
Table 2-4. HESP Subsidies Awarded by Year
Year Number of
households
Amount (KRW 1,000,000)
2004 310 6,300
2005 907 15,764
2006 5,964 48,920
2007 7,467 50,456
2008 10,021 60,572
2009 19,193 93,991
2010 29,822 94,969
2011 35,602 88,220
2012 52,356 97,499
2013 31,658 64,984
2014 14,305 55,466
2015 15,690 50,929
2016 28,096 44,913
Total 251,391 772,983
Source: KEA (2017b, p. 240).
Table 2-5. HESP Subsidy Trend
Type ~2010 2011 2012 2013 20141) 20151) 20161) Total
PV Number of households 64,899 28,990 43,280 25,875 10,859 12,647 25,663 212,213
Supply (kW) 66,150 19,104 36,222 20,625 22,337 20,999 27,542 212,979
Amount (KRW 1,000,000) 287,580 49,993 54,824 26,045 21,195 18,672 21,297 479,606
Fuel cells Number of households 957 292 245 232 175 308 304 2,513
Supply (kW) 209 292 245 232 175 305 303 1,761
Amount (KRW 1,000,000) 9,760 11,991 8,075 7,941 5,525 8,654 6,668 58,614
Small wind Number of households 25 0 327 0 0 0 0 352
Supply (kW) 60 0 6 0 0 0 0 66
Amount (KRW 1,000,000) 415 0 44 0 0 0 0 459
Total Number of households 65,881 29,282 43,852 26,107 11,034 12,955 25,967 215,078
Supply (kW) 66,419 19,396 36,473 20,857 22,512 21,304 27,845 214,806
Amount (KRW 1,000,000) 297,755 61,984 62,943 33,986 26,720 27,326 27,965 538,679 Source: KEA (2017b, p. 240).
Note: The figures for 2014 and 2015 reflect only subsidies that were approved.
Table 2-5 details HESP subsidies provided for the power generation sector only. Increases and decreases in the program budget by year are reflected in the increases or decreases in the number of subsidized households and the amounts of PV and fuel cell subsidies provided. In general, PV installations far outnumbered fuel cell installations in terms of both the number of benefitting households and the amounts of the subsidies provided throughout the years. Although the Korean government briefly subsidized small wind energy installations, no new installations have been constructed in recent years.
While energy storage systems (ESS) are not exactly sources of new and renewable energy, select ESS users are eligible for government aid under Article 2.12 of the Enforcement Rules of the Act on the Promotion of the Development, Use, and Diffusion of New and Renewable Energy (APNRE). According to the Implementation Rules of the Basic Supply Agreement of the Korea Electric Power Corporation (KEPCO, 2017a, pp. 150-152), ESS users can receive discounts on both their electricity base fees and consumption tariffs. However, tariffs discount rates vary by ESS battery capacity2 and only apply to general, industrial, and educational ESS installations (capable of opting for differentiated tariff rates by season or hour) and not for households. The MOTIE (2017b) recently announced in a press release its plans to expand the scope of tariff discounts for new and renewable energy installations and to introduce new incentives for ESS installations, but even these expanded discounts will only be available to general and industrial users. While ESS is not subject to nighttime electricity charging services, it will likely be subject to such services in the future. However, tariff discounts would only be applied, most likely, when the electricity stored on the ESS is used to power air-conditioning and heating systems during peak hours. In February 2016, KEPCO entered a technological collaborative agreement with private-sector companies to develop standard specifications for ESS-aided air-conditioning and heating systems. In October of the same year, the corporation released the Operating Standards for ESS-Aided Air-Conditioning and Heating Systems.3 Under the new standards, ESS users can save energy by operating their ESS at night and using the saved energy to power air systems during other hours.4
The review of new and renewable energy installations for household use and the associated policy support measures previously mentioned in this study support the inclusion of household PV, fuel cells, and ESS installations as proper subjects for this study’s analysis of the financial feasibility of new and renewable energy. However, at the present time, there is neither a government program that supports household ESS installations nor a market for these installations in Korea. As a result, household ESS installations are included in this study’s financial feasibility analysis, but excluded from its market analysis.
C. Global New and Renewable Energy Trends
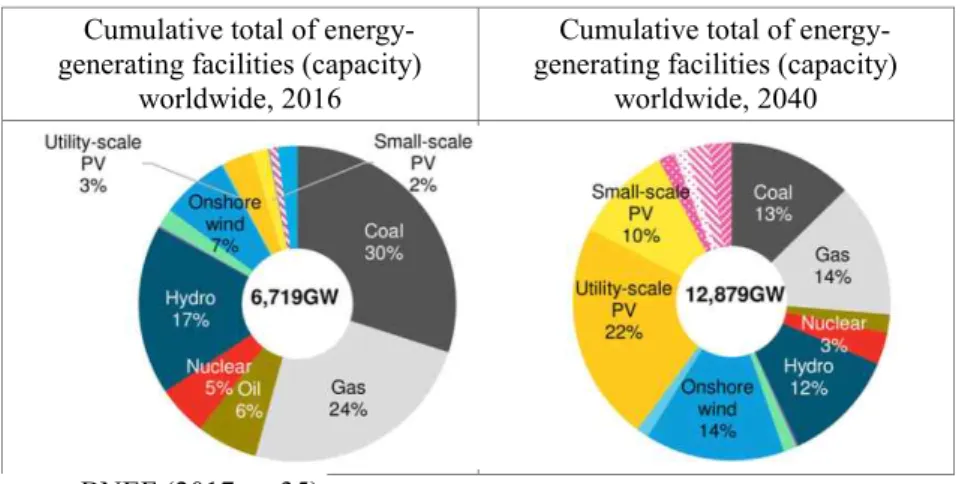
Figure 2-1 presents an analysis conducted by Bloomberg New Energy Finance (BNEF) on the respective shares of different types of new and renewable energy represented in the cumulative total capacity of energy installations around the world as of 2016. The analysis also shows how the makeup of new and renewable energy worldwide is expected to change by the year 2040 (2017, p. 35). According to BNEF, the shares of conventional energy facilities, including fossil fuels and nuclear power, as well as hydropower will continue to decrease, while the shares of wind and PV energy will increase. It is important to note that the share of utility-scale PV facilities is expected to increase the most dramatically, from its current three percent to 22 percent by 2040. The share of small-scale household PV installations is also expected to increase by eight percent, from 2 percent to 10 percent by 2040, whereas the share of onshore wind energy is expected to increase by seven percent, from 7 percent to 14 percent.
2 For more information on ESS-related electricity tariff discounts, see KEPCO (2017a, pp. 150-152), the Implementation Rules of the Basic Supply Agreement.
3 KEPCO (2016).
4 Today Energy, February 19, 2016,http://todayenergy.kr/news/articleView.html?idxno=111511 (retrieved October 29, 2017).
Figure 2-1. Present Status and Future Outlook: Energy-Generating Facilities Worldwide Cumulative total of energy-
generating facilities (capacity) worldwide, 2016
Cumulative total of energy- generating facilities (capacity)
worldwide, 2040
Source: BNEF (2017, p. 35).
Figure 2-2 shows the number of countries that implemented new and renewable energy support/regulation policies from 2014 to 2016 by sector (power generation, heating, and transport; REN21, 2017, p. 120). Of all the sectors, the power sector was the largest recipient of different countries’ new and renewable energy efforts, with 126 countries implementing relevant policies as of 2016. This suggests that power generation is a top priority for many policymakers. The next-largest sector was transportation, with 68 countries (as of 2016) mandating the supply of biodiesel, ethanol, and other more sustainable sources of fuel. During this same time, only 21 countries adopted relevant policies on heating.
The number of countries that launched new policies supporting alternative energy in the power generation sector continued to increase in each of the years represented in Figure 2-2, while few countries introduced new policies supporting alternative energy in the transportation and heating sectors. This further emphasizes the fact that many governments worldwide are focusing their new and alternative energy efforts on the power industry.
As for the specific measures countries adopted in support of new and renewable energy power generation, the greatest number of countries adopted feed-in tariff (FiT) policies to support power generators. Many countries also introduced net metering policies to foster small-scale and decentralized power generation in households and elsewhere. As of 2016, 41 states in the United States had adopted net metering policies. The Australian government also revised its existing renewable energy program to apply net metering to household PV systems (REN21, 2017, p. 124).
Figure 2-2. New and Renewable Energy Policies Worldwide by Sector
Source: REN21 (2017, p. 120).
As suggested by the BNEF analysis and projections, small-scale power-generating facilities, particularly PV systems, will likely play a pivotal role in global governments’ efforts to promote new and renewable energy. A great number of governments worldwide have already introduced a variety of policy measures to encourage the distribution of small-scale PV systems. This can be attributed to the fact that PV energy offers clear and distinct benefits. Farrell (2016, p. 14), for example, argues that, in light of the costs and losses associated with the transmission of electricity over long distances, small-scale PV plants located near sites of demand offer at least as many economic benefits as large-scale new and renewable power plants located farther away. While the unit cost of small-scale PV energy generation is significantly higher than that of utility-scale power plants, the financial feasibility of utility-scale PV electricity is determined based on wholesale prices, while the feasibility of small-scale PV energy is determined based on retail prices, which are, in essence, already higher than wholesale prices (Farrell, 2016, p. 20).
2. Electricity Tariff System for Households A. Electricity Tariff Rates
In terms of competitiveness, the Korean electricity market is at an intermediate stage of development, with competition seen only in the generation sector (as the government’s horizontal monopoly on electricity generation was removed only recently). At the present time, the retail sector remains free from competition. The now open and competitive power generation sector in Korea is comprised of the six subsidiaries of KEPCO, private-sector power generators, and small-scale and self-sustaining power generators. KEPCO still has a monopoly over transmission and distribution. The corporation purchases electricity from generators according to the price determined by the wholesale market and sells it to end users at retail prices. The Korea Power Exchange (KPX) is in charge of operating the power market and systems.
Figure 2-3. Structure of the Electricity Market in Korea
Source: KEPCO (http://home.kepco.co.kr/kepco/KO/C/htmlView/KOCCHP001.do?menuCd=FN05030301, retrieved on October 13, 2017).
정부 전력거래소 구역전기사업자 고객(전기사용)
Government KPX
District electricity providers End users
발전자회사(6) Power-generating subsidiaries (6)
(화력5, 수력원자력1) 민자발전회사등 KEPCO 그룹사(4)
(5 fossil-fuel plants, 1 hydro/nuclear plant) Private-sector generators, etc.
KEPCO affiliates (4)
감독 거래 시장운영 관련사업
Supervision Transaction
Market management Related businesses
송배전+판매 Transmission and distribution
The electricity tariffs in Korea are determined based on the principle of “compensating the total cost of electricity supply, based upon the cost of acquisition involved therein” (Article 8.1, MOTIE Announcement). The “total cost of electricity supply” consists of “appropriate costs” and “appropriate returns on investment.”5 The tariff scheme is a dual structure featuring both fixed basic fees and tariffs proportional to use. In order to ensure the efficient allocation of resources, tariffs differ by contract type, season, and hour, and progressive rates apply to households. Users are also allowed to choose from different rates offered for different loads. Discounts are provided for low-income household, minorities, large families, and life-sustaining devices.
The policy of differentiated tariff rates by contract type involves applying different tariff rates to various contract types based on the cost of supplying electricity for each type. In its Basic Supply Agreement, KEPCO lists eight types of contracts: residential, general, educational, industrial, agricultural, public lighting, reserve, and provisional. When compiling its electricity statistics, KEPCO collects information on the daytime and nighttime trends of every contract type except for reserve and provisional contracts. Table 2-6 summarizes the tariff rates for each different type of contract, according to the statistics provided by KEPCO.
The policy of differentiating tariff rates by season and hour involves charging higher rates at peak seasons/hours and lower rates at non-peak seasons/hours. Higher rates are applied in the summer and the winter, and at peak hours. Spring and autumn, sub-peak and off-peak hours are subject to lower tariff rates. Households, which are the main subject of this study, are exempt from this season- and hour-differentiated tariff policy. Instead, households are subject to the progressive tariff rate scheme. Under the progressive tariff rate scheme, KEPCO differentiates tariff rates by load, with fixed basic fees and use-proportional tariffs that consider users’ average electricity consumption and maximum electricity consumption over a certain period of time.
Table 2-6. Electricity Tariff Rates Differentiated by Function Contract
type Example Tariff rates
Residential Households
Ÿ 3-stage progressive scheme (300% for low-voltage, 275% for high- voltage)
Ÿ Credits for necessary consumption levels, super users General
Public and commercial establishments
Ÿ Differentiated by season (June through August: peak rates) Ÿ Differentiated by hour for high-voltage users
Ÿ Low-voltage, High-voltage A/B/C
Educational Schools, museums, etc.
Ÿ Differentiated by season (June through August: peak rates) Ÿ Differentiated by hour for high-voltage users (1,000 kW or more) Ÿ Low-voltage, High-voltage A/B/C
Industrial
Mining, manufacturing,
etc.
Ÿ Differentiated by season (June through August: peak rates) Ÿ Differentiated by hour for high-voltage users
Ÿ Low-voltage, High-voltage A/B/C Agricultural Agricultural,
fishing, etc.
Ÿ Flat rates (Agricultural-A, Agricultural-B, low-voltage) Ÿ Differentiated by season for High-voltage Agricultural-B users Public
lighting
Street lamps, security lights,
etc.
Ÿ A (fixed), B (metric)
Nighttime For all contract
types* Ÿ A (heating), B (air-conditioning)
Source: KEPCO, http://cyber.kepco.co.kr/ckepco/front/jsp/CY/H/C/CYHCHP00104.jsp (retrieved October 13, 2017);
Park (2017, p. 4).
Note: Voltage levels: Low (220 to 380V); High A (22.9 kV); High B (154 kV); High C (345 kV).
*Excluding Agricultural (A), public lighting, reserve, and provisional power usage.
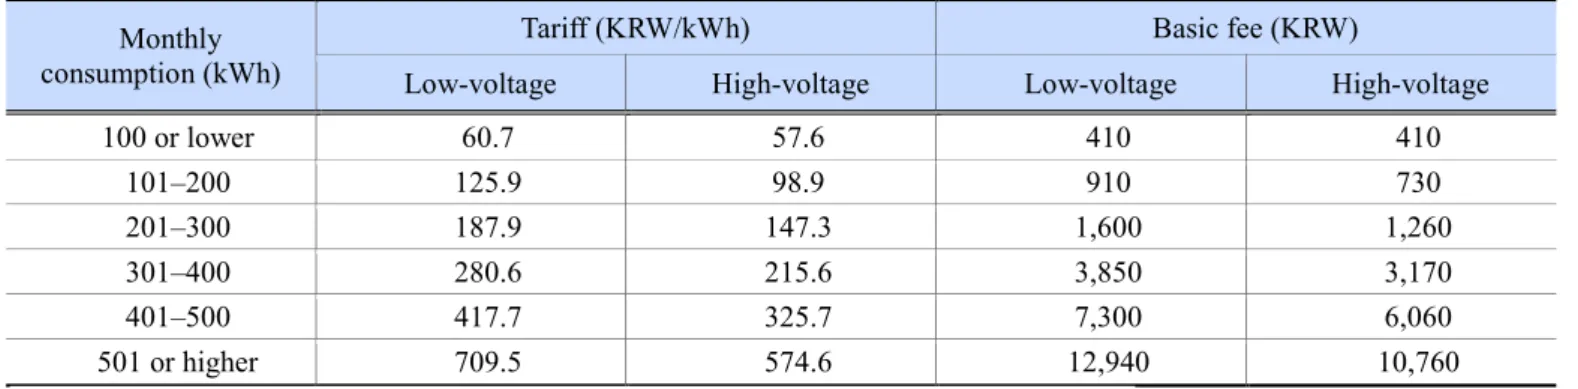
Prior to the reform of electricity tariff rates, household rates were divided into six tariff brackets, with the highest bracket’s rate (KRW 709.5/kWh) 1170 percent greater than the lowest bracket’s rate (KRW 60.7/kWh).
Table 2-7. Electricity Tariff Rates for Households by Bracket (Before Tariff Reform) Monthly
consumption (kWh)
Tariff (KRW/kWh) Basic fee (KRW)
Low-voltage High-voltage Low-voltage High-voltage
100 or lower 60.7 57.6 410 410
101–200 125.9 98.9 910 730
201–300 187.9 147.3 1,600 1,260
301–400 280.6 215.6 3,850 3,170
401–500 417.7 325.7 7,300 6,060
501 or higher 709.5 574.6 12,940 10,760
Source: Korea Electric Association (KEA, 2014, p. 133), quoted by Jo and Park (2015, p. 20).
In the summer of 2016, unprecedented high temperatures caused electricity demands for air-conditioning to skyrocket.
When public outcry erupted over the six-bracket tariff system, which placed an excessive financial burden on households, the Korean government changed the tariff system into a three-bracket system, with the highest bracket paying triple the amount of the lowest bracket. Accordingly, the tariff rate for the highest bracket was drastically lowered from KRW 709.5/kWh to KRW 280.6/kWh, while the tariff rate for the lowest bracket was raised from KRW 60.7/kWh to KRW 93.3/kWh.
Table 2-8. Electricity Tariff Rates for Households by Bracket (After Reform) Monthly
consumption (kWh)
Tariff (KRW/kWh) Basic fee (KRW)
Low-voltage High-voltage Low-voltage High-voltage
200 or lower 93.3 78.3 910 730
201–400 187.9 147.3 1,600 1,260
401 or higher 280.6 215.6 7,300 6,060
Source: KEPCO, http://cyber.kepco.co.kr/ckepco/front/jsp/CY/E/E/CYEEHP00101.jsp (retrieved on October 26, 2017).
After the tariff reform, the Korean government also introduced the Minimum Electricity Consumption Guarantee Credit, a discounted tariff rate program for low-income households. Under the credit system, eligible households consuming 200 kWh or less of low-voltage electricity a month are given a discount of up to KRW 4,000 off their monthly charges. Eligible high-voltage households are given a discount of up to KRW 2,500 off their monthly charges (KEPCO, 2017a, p. 154).
The final electricity bill that each consumer pays, irrespective of the tariff reform, includes both the basic (fixed) fee and the tariff, as well as a 10-percent value-added tax and a 3.7-percent Contribution to the Electricity Industry Base Fund.
Eligible households receive discounts off their final bill as per the Minimum Electricity Consumption Guarantee Credit program. The value-added tax and Contribution to the Base Fund are based upon the sum of the basic fee, tariff, and any applicable discounts.
Table 2-9 compares the average monthly electricity bill of households, before and after the tariff reform. Households consuming 100 kWh of electricity a month on average pay slightly less (from KRW 7,400 to KRW 7,100) under the reformed tariff system. The reduction in fees is even greater at KRW 4,500 for households consuming 200 kWh a month.
While households consuming 300 kWh a month see no difference in their average monthly electricity bills, households consuming more than 400 kWh a month or more benefit from significant discounts. In particular, households consuming 1,000 kWh a month pay less than half of what they used to pay under the previous system.
Table 2-9. Average Monthly Electricity Bill Before and After the Tariff Reform (Low-Voltage Households) (Unit: KRW 1,000) Average monthly consumption (kWh)
100 200 300 400 500 600 700 800 1000
Before 7.4 22.2 44.4 78.9 130.3 217.4 298.0 378.7 540.0
After 7.1 17.7 44.4 65.8 104.1 136.0 168.0 199.9 263.7
Difference -0.3 -4.5 - -13.1 -26.1 -81.3 -130.1 -178.8 -276.4 Source: Average Monthly Electricity Bill Before and After the Tax Reform (Low-Voltage Households), provided by the author.
Note: The amounts seen in the table above are based on final bill amounts, which include the basic fees, tariffs, Minimum Consumption Guarantee Credit discounts, value-added taxes, and Contributions to the Electricity Industry Base Fund.
Figure 2-4 illustrates changes in electricity bill amounts per unit of electricity consumption before and after electricity tariff reforms. These bill amounts have been obtained by dividing the final monthly bill by the electricity consumed in the given month. As with the final bill amounts, the unit amounts for the electricity prices were also charged per kWh; however, these prices reflect all the components of the bill amounts, including not only the changed tariffs, but also the basic fees, taxes, discounts, and so forth. As such, these amounts can be compared to the unit prices of electricity that reflect the total underlying costs, such as the levelized cost of electricity (LCOE). While the unit amount for households consuming 201 to 300 kWh a month showed no change with the tariff reform, the unit amounts for households consuming more than 300 kWh a month showed changes after the tariff reform. The line on the graph begins to shift as the basic fees change. After the initial jump, the effects of changes to the basic fee are diffused due to increasing amounts of electricity consumption.
Accordingly, the rate of increase in the unit bill slows down.
Figure 2-4. Unit Electricity Bills Before and After the Tariff Reform
개편후 개편전
After reform Before reform 월전력소비량, kWh/월
원/kWh
Monthly consumption, kWh/month KRW/kWh
B. Net Metering
Households with PV installations in Korea can benefit from the net metering policy. At present, the net metering policy applies to PV installations with a capacity of 1,000 kW or less, and requires that the unit cost of the surplus electricity be the same as the unit price of the electricity received.6 Figure 2-5 illustrates an example of a single day’s load pattern of an electricity-consuming household and the amount of PV electricity that the household generates from its own installation.
On a day when the household generates more electricity than it consumes, the surplus electricity is sent back into the power grid. On other days, the household receives electricity from KEPCO via the power grid. PV installations come with the installation of additional meters intended to measure the amount of surplus electricity sent back to KEPCO.
Figure 2-5. Daily Load Pattern of Household Electricity Consumption and Household PV Power Output
Source: Lee (2016), p. 6.
가정용 전력소비 및 태양광발전 Household electricity consumption and PV power generation
6 See MOTIE (2017d), “Directive on the Exchange, Etc. of New and Renewable Energy Generated by Small-Scale Systems,” Article 18.1 and Article 18.3.
한전으로부터 수전 잉여전력
자가소비
Received from KEPCO Surplus power
Consumed at home
가정용 전력소비 가정용 태양광 발전
Household consumption Household PV power generation
The net metering system was first introduced in Korea in 2005. Before charging household basic fees and tariffs, KEPCO subtracts the amount of surplus electricity generated by the household’s own PV installation, as measured by its own meter, from the amount of electricity received as indicated on the KEPCO meters. The V.A.T. and the Contributions to the Electricity Industry Base Fund are based upon the amount of electricity received, not the net-metering amount of electricity consumed. In any given month, if a household’s surplus electricity is greater than the amount of energy it received, the surplus is applied as credit to the next month. Minimum Electricity Consumption Guarantee Credit discounts are applied only when the net-metering amount of electricity is 200 kWh or below.
Table 2-10 shows the number of Korean electricity users that entered net-metering agreements with KEPCO from 2011 to 2016. This number increased by nearly six times from 28,484 in 2011 to 167,559 in July 2016. In addition to PV installations, wind, fuel cell, and other installations are also eligible for policy benefits. However, PV users make up the vast majority of eligible users (115,090 out of 115,583 as of the end of 2014). Out of all PV users, 111,691 were residential contracts, 3,691, were general contracts, 64 were industrial contracts, and 137 were other contracts (KPMG Korea, 2016, p. 21).
Table 2-10. Number of Users Entering KEPCO Net-Metering Contracts by Year
(Unit: number of users/households)
Year 2011 2012 2013 2014 2015.6 2016.7
Number 28,484 44,330 65,375 96,706 115,583 167,549
Source: KPMG Korea (2015, p. 20) for figures from 2011 to 2015; Ahn (2016, p. 6) for figures from 2016.
C. Nighttime Electricity
The nighttime electricity policy involves producing heat, hot water, or ice using electricity during the night (when the electricity demand is low), and using these products for air-conditioning, heating, or hot water during hours of high demand.
As such, the policy applies to heat-storage and air-conditioning systems only. These systems are subject to lower tariff rates and installed with additional meters that measure the amount of electricity these systems use at night.
The policy defines “nighttime” as the hours between 11 p.m. and 9 a.m. the next morning. Nighttime electricity is divided into two types: A and B. A refers to heat-storing heating and hot water systems, and B refers to air-cooling systems for air- conditioning. The rate for A-type electricity is KRW 76.8 per kWh during the wintertime and KRW 55.4 per kWh in other seasons. The minimum monthly bill starts with the tariff for 20 kWh. The B-type nighttime electricity is subdivided into types I and II. B-I electricity is supplied to systems that do not receive electricity from the power grid, while B-II electricity is supplied to systems that do. The rate for B-I is KRW 62.3 per kWh in the wintertime and KRW 45.2 per kWh in other seasons. Again, the monthly bill starts from 20 kWh. The rate for B-II is the same as for B-I at night and KRW 88.4/kWh at other hours. The basic fee for B-II electricity is determined by applying the formula, 7,160 ×
. The minimum monthly fee is KRW 710 / kWh.7
3. Household Electricity Consumption and the New and Renewable Energy Market
7KEPCO Cyber Branch, https://home.kepco.co.kr/kepco/CY/K/htmlView/CYKDHP00102.do?menuCd=FN02070401# (retrieved
A. Distribution of Households by Home Type
Table 2-11 below summarizes the distribution of households in Korea by home type and total floor area, based upon 2016 housing information collected by Statistics Korea (2017, p. 64). At the time of data collection, there were 16,692,230 homes in Korea, 60.1 percent or 10,029,644 of which were apartments, and 23.8 percent, or 3,967,776 of which were detached houses. Multi-unit homes totaled 2,000,783 in all and represented 12 percent of the household distribution in Korea. There were 492,469 row homes, which only made up three percent of the household distribution (Statistics Korea, 2017, p. 91).
Table 2-11. Household Distribution in Korea by Housing Type and Total Floor Area (2016)
(Units: 1,000 homes, percentage) Total floor
area Total Detached
houses Apartments Row homes
Multi-unit homes
Homes in non- residential premises
Total 16,692 3,968 10,030 492 2,001 202
(100.0) (100.0) (100.0) (100.0) (100.0) (100.0) 40㎡ or
less
2,168 440 984 48 678 18
(13.0) (11.1) (9.8) (9.8) (33.9) (8.9)
40㎡ to 60㎡
4,993 660 3,281 201 829 22
(29.9) (16.6) (32.7) (40.8) (41.4) (10.9)
60㎡ to 100㎡
6,577 1,445 4,383 205 479 64
(39.4) (36.4) (43.7) (41.7) (23.9) (31.8)
100㎡ to 165㎡
2,140 730 1,303 28 13 66
(12.8) (18.4) (13.0) (5.8) (0.7) (32.8)
Greater than 165㎡
814 693 79 9 1 32
(4.9) (17.5) (0.8) (1.9) (0.1) (15.7)
Source: Statistics Korea (2017), p. 64.
Table 2-12 presents the findings of Statistics Korea’s Population and Housing Survey (2017) in terms of the types of homes associated with household heads (i.e., households officially registered with the government). According to the survey, there were 19,366,000 households with resident registration records in Korea as of 2016, 48.6 percent of which lived in apartments and 34.3 percent of which live in detached houses.
Table 2-12. Distribution of Homes by Type: Homes with Registered Household Heads (2016)
(Units: 1,000 households, percentage) Detached
houses Apartments
Row homes and multi-unit
homes
Homes in non- residential
areas
Residences other than
homes
Total
6,639 9,422 2,219 316 770 19,368*
(34.3) (48.6) (11.5) (1.6) (4.0) (100.0)
Source: Statistics Korea (2017), p. 44.
Note: All the numbers add up to 19,366,000 households, so the original total cited above seems to be an error.
B. Residential Electricity Consumption
KEPCO’s statistics on the number of electricity-consumption households and the distribution of homes vary significantly from those provided by Statistics Korea (2017). KEPCO’s statistics are based upon electricity supply contracts and include married couples with separate residences, students living away from home, other residences that are not officially registered, and homes that are connected to the power grid, but remain uninhabited. As a result, KEPCO’s number of households is greater than the number provided by Statistics Korea.