THE COSTS OF A RENEWABLE-ENERGY BASED ELECTRICITY SUPPLY
SYSTEM ON JAVA AND BALI
Matthias Günther
Swiss German University, Tangerang, Banten E-mail: [email protected]
Abstract
There is a growing consciousness about the necessity to transform our energy supply systems into more sustainable systems. In particular the usage of renewable energy resources comes to the fore. However, sometimes it is still considered to be a question of costs whether the transition of the energy systems to more sustainable ones should be realized in a near future or rather later. The present study examines the costs of an electricity supply based on exclusively renewable resources in the Java-Bali grid. It argues that within the quite manageable time horizon of 30 years (target year 2050) electricity generation costs can be achieved that are competetitive with current generation costs in many countries. This is a strong argument to pursue the gradual restructuring of the electricity generation system towards a renewable-resource based one.
Keywords:electricity cost, energy storage, Java-Bali grid , time series analysis
Introduction
Methodology
An electricity consumption and generation scenario is designed in form of time series. First, a load scenario is designed for the target year 2050. It is a time series with an hourly resolution. The chosen load scenario is a scale-up of the real load curve of the Java-Bali grid in the year 2014 in accordance with a consumption scenario that was designed on the basis of assumptions about the population growth, the productivity development and the elasticity of power demand with respect to the economic development. That consumption scenario renders a consumption of 640 TWh for the year 2050. The generation scenario is designed as a time series that corresponds to the load scenario in the sense that the load is covered at any hour during the target year. It takes into account the following energy resources: the geothermal heat flow, the river run-off, biomass, and solar radiation. The capacity of geothermal power plants and hydropower plants is fixed according to the existing plants, the plants contained in the PLN business plans, and assumptions about some additional capacity that reasonably could be constructed until the target year 2050 (5.5 GW for geothermal power plants, 5.8 GW for hydropower plants). The geothermal power plant capacity factor is fixed at 0.85 while for the hydropower plants monthly capacity factors are chosen according to the typical rainfall during the respective month. Bioenergy is limited to an amount that can be obtained from using agricultural waste on Java and Bali. The rest of the energy demand must be covered by solar energy. Table 1 shows the resulting power plant mix and the energy supply shares:
Table 1. Power plant mix and annual energy supply
Power plant type Installed capacity [MW] Annual energy supply [TWh]
Geothermal power 5,500 41 (6%)
Hydropower 5,800 18 (3%)
Bioenergy 4,000 7 (1%)
PV Open parameter 574 (90%)
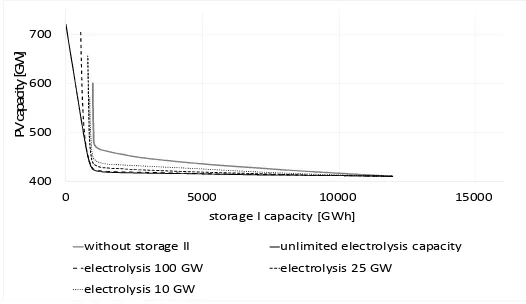
We consider two types of storage. One storage system (storage I) constists of pumped storages (with an installed capacity of 100 GWh) and batteries (covering the remaining needed capacity). A second storage system (storage II) is a synthetic methane storage system (storage II) as a possible additional long-term storage.
The outcome is a three-dimensional space of system configurations that is represented in
without storage II unlimited electrolysis capacity
electrolysis 100 GW electrolysis 25 GW
electrolysis 10 GW
Figure 1. Possible system configurations
The task of the present study is to allocate costs to the identified system configurations and to identify the most cost-efficient configurations. The economic comparison of the different system configurations is done with respect to the electricitygenerationcost only. Transmission and distribution are not considered. We will consider a stable system, i.e. a system that is not modified over time with the exception of the regular renovation of system components according to their limited lifetime. And we assume that each system component type (power plants and storages) is represented in a homogeneous age continuum so that every year a constant share of the respective component has to be renewed. Every year is exactly the same in terms of operation, maintenance and modernization expenses, which simplifies the calculation considerably.
In a first step we will neglect capital costs, i.e. we consider only operation and maintenance expenses and the renovation of the system components without considering any discounting effects. We call these costs therunning costs. In a second step we will take into consideration capital costs in an exemplary way (assuming a unique interest rate that is applied to the capital bound in all the system components). Then we speak abouttotal costs.
A major challenge of the determination of the optimum configuration is the definition of the future cost of components and their lifetime. As we consider the year 2050 these assumptions may be more or less vague for some of the system components.
Cost assumptions
With reference to the target year 2050 we make the following assumptions about component costs, operation costs, and lifetimes.
For photovoltaics we assume for ground-mounted systems 275 €/kWp for the whole system without inverter, and for roof-mounted systems 350 €/kWp. The lifetime is 25 years. For the inverter we calculate with 25 €/kWp and a lifetime of 15 years. The operations costs are 10 €/kWp per year for ground-mounted systems and 12 €/kW per year for roof-mounted systems (Agora Energiewende, 2015). The roof-top capacity is estimated to be 60 GW.
the investment (Conrad, 2014). We calculate with an installed capacity of 100 GWh (20 GWh are currently planned or under construction).
Battery costs are currently around 300€/kWh after a deep drop in the last years. Battery manufacturers and market observers estimate that in a medium-term future costs of about 100€/kWh can be reached (Agora Energiewende, 2014). We calculate with a lifetime of 12 years with a remaining capacity of 60%.
The methane storage consists of several components that have to be considered: electrolyzers, methanation units, methane gas storages, and combined cycle power plants for the conversion of the stored chemical energy back into electrical energy. These power plants also contain carbon dioxide capture systems in order to provide a closed carbon cycle. For electrolyzers we assume future costs of 700€/kW with annual operational costs of 4% of the investment costs and a lifetime of 30 years. For methanation units we assume costs of 550€/kW, annual operational costs of 2% of the investment costs and a lifetime of 25 years (Albrecht, 2013). We assume that the hydrogen storages are very small and that hydrogen is directly converted into methane. Methane gas storages are inexpensive and can be neglected in the calculation. For combined-cycle power plants we assume investment costs of 750€/kW and a lifetime of 30 years. The annual operational costs are 17 €/kW. Carbon cioxide sequestration requires an additional investment of 450 €/kW and annual operational costs of 20€/kW (Hartmann, 2014).
For hyropower plants we assume investment costs of 2000€/kW and annual operations costs of 2% of the investment cost. Modernization costs of 270€/kW have to be covered every 40 years (Irena, 2012a). For geothermal power plants we assume investment costs of 4000€/kW and modernization costs of 500€/kW that have to be covered every 30 years. Annual operational costs are considered to be 2% of the investment costs (Irena, 2015). Biopower plants are basically steam power plants that are fed with solid agricultural waste and a very small share biogas plants based on palm oil mill effluent from the few palm oil production sites in Banten and West Java. We assume investment costs of 2000
€/kW, annual operational costs of 6% of the investment cost, and a lifetime of 20 years (Irena, 2012b).
Results
In a first step we identify the economic optimum configurations under the mentioned assumptions. The following figure shows the annual configuration-specific costs (i.e. only the costs that vary among the different configurations) for the system without storage II. The optimum is at a storage capacity of 1040 GWh. The related PV capacity is at around 475 GW.
990 1040 1090 1140 1190
co
The complete annual running system costs include additional the non-variable costs which amount to about 2.5 bn €. The minimum annual running system costs are, hence, about 27 bn €. In terms of the generated electricity this renders 4.2 €ct/kWh. Including storage II the annual configuration-specific costs are shown in figure 3.
23
400 500 600 700 800 900 1000 1100 1200
co
Figure 3. Configuration-specific costs for the system including storage II
At the assumed battery cost of 100€/kWh the inclusion of a gas storage does not have a clear economic advantage, and a small charging capacity is preferable. For small electrolyzer capacities of 5 to 10 GW the annual running system costs are in the same range as in the system without storage II.
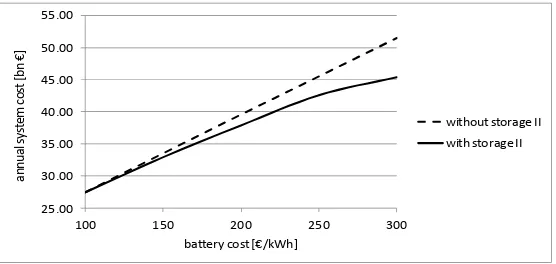
For higher battery costs it makes sense to integrate a special long-term gas storage into the sytem. Figure 4 shows the minimum annual running system costs in dependence on the battery cost. At current battery costs of 300 €/kWh a gas storage is clearly economically favourable, but the advantage gradually disappears as the battery cost approaches the mentioned mid-term battery cost target of 100€/kWh.
25.00
100 150 200 250 300
a
Figure 4. Minimum annual running system costs in dependence on the battery cost
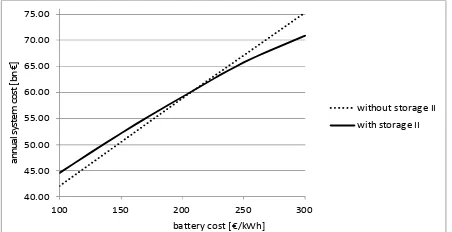
40.00
100 150 200 250 300
a
Figure 5. Minimum annual total system costs in dependence on the battery cost
The second conclusion, besides the conclusion that a power supply that is completely based on renewable resources is economically conceivable, is, hence, that capital costs (if applied uniformly to all components) makes a gas storage even more dispensable under realistic future battery costs. This holds at least for a grid that has to deal with relatively low seasonal power generation fluctuations.
Acknoledgement
This study was supported by Swiss German University with an internal research support scheme.
Literature
Agora Energiewende, 2014,Stromspeicher in der Energiewende: Untersuchung zum Bedarf an neuen Stromspeichern in Deutschland für den Erzeugungsausgleich, Systemdienstleistungen und
im Verteilnetz,
https://www.agora-energiewende.de/fileadmin/downloads/publikationen/Studien/Speicher_in_der_Energ iewende/Agora_Speicherstudie_Web.pdf
Agora Energiewende, 2015,Current and Future Cost of Photovoltaics. Long-term Scenarios for
Market Development, System Prices and LCOE of Utility-Scale PV Systems,
https://www.ise.fraunhofer.de/content/dam/ise/de/documents/publications/studies/ AgoraEnergiewende_Current_and_Future_Cost_of_PV_Feb2015_web.pdf
Albrecht, U., Altmann, M., Michalski, J., Raksha, T., Weindorf, W., 2013,Analyse der Kosten
Erneuerbare Gase. Eine Expertise der Ludwig-Bölkow-Systemtechnik GmbH,
http://www.lbst.de/download/2014/20131217_BEE-PST_LBST_Studie_EEGase.pdf
Conrad, J., Pellinger, C., Hinterstocker, M., 2014, Gutachten zur Rentabilität von Pumpspeicherkraftwerken, on behalf of the Bavarian State Ministry of Economy, Media, Energy and Technnology,
https://www.stmwi.bayern.de/fileadmin/user_upload/stmwi/Themen/Energie_und_ Rohstoffe/Dokumente_und_Cover/2014-Pumpspeicher-Rentabilitaetsanalyse.pdf
Hartmann, C., 2014, Systemanalyse der CO2-Sequestrierung aus Biomasse-Heizkraftwerken:
Technik, Wirtschaftlichkeit, Nachhaltigkeit,
https://www.zhb-
IRENA, 2012a, Renewable Energy Technologies: cost analysis series: Hydropower,
https://www.irena.org/documentdownloads/publications/re_technologies_cost_analys is-hydropower.pdf
IRENA, 2012b, Renewable Energy Technologies: Cost Analysis Series: Biomass,
https://www.irena.org/DocumentDownloads/Publications/RE_Technologies_Cost_An alysis-BIOMASS.pdf
IRENA, 2015, Renewable Power Generation Costs in 2014,