In this thesis, the effects of vegetation changes on the EASM are investigated through observational data and model experiments. The increase in vegetation originates from the increases in evapotranspiration, decrease in surface temperature, weakening of the monsoon circulation, and the anomalous anti-cyclonic pattern over southern China and cyclonic pattern over Korea by lowering the westerly upper jet. To demonstrate the mechanism of vegetation changes and monsoon changes in observations, the model sensitivity experiments are conducted.
Introduction
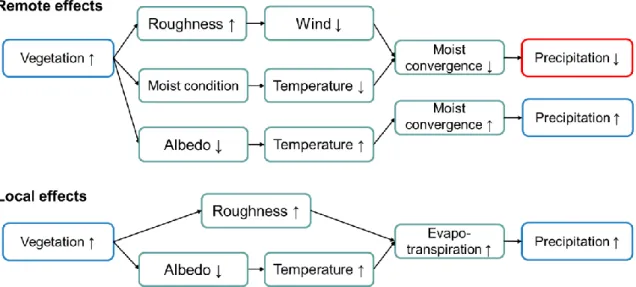
Hahmann and Dickinson (1997) mentioned that Amazonian deforestation leads to the decrease in precipitation due to the reduction of evapotranspiration and the increase in surface albedo. On the contrary, Heck et al. 2001) showed that mid-latitude afforestation leads to the increase in precipitation and decrease in surface temperature during spring season. When the vegetation increases, the increase in surface roughness length leads to the decrease in wind speed and the increase in evapotranspiration decreases the surface temperature.
Data and Model Experiments
Observational Data
Study Area
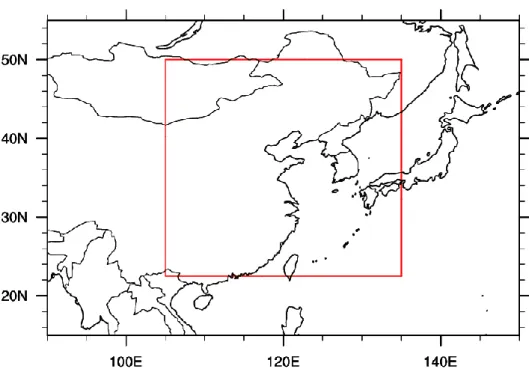
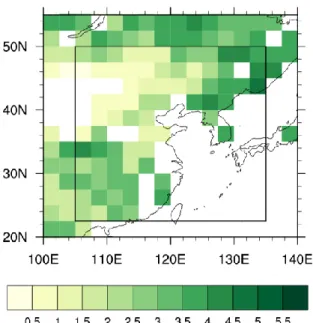
This thesis focuses on the EASM influenced by the subtropical climate to investigate the effect of vegetation changes on summer monsoon intensity (Fig. 2.1). EASM regions are included in eastern China, Korea, Japan and the surrounding area such as the Pacific Ocean. To define the study area in the East Asian monsoon region, first, the AVHRR LAI data from 1982 to 2010 in the summer season (June–July–August; .JJA) are averaged over the East Asian region.
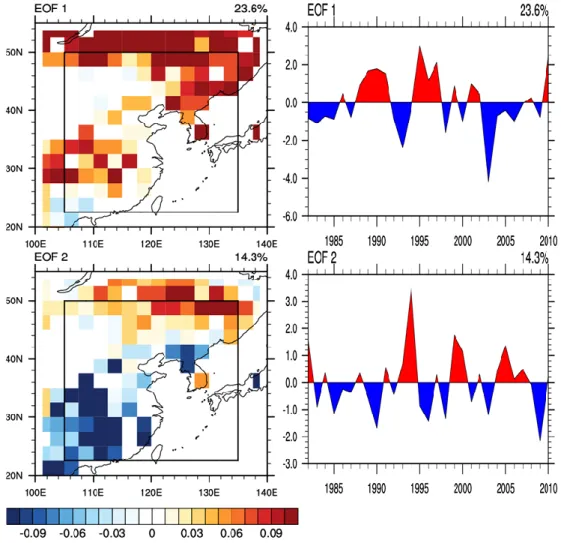
Vegetation in East China and the East Coast of Primorsky Krai has a high average value, and vegetation in Mongolia is small during the summer season (Fig. 2.2). To diagnose the dominant spatial patterns in vegetation variation, Empirical Orthogonal Function (EOF) analysis is applied over EASM regions using detrended AVHRR LAI from 1982 to 2010 during summer (Fig 2.3). The dominant pattern of LAI variability is similar to the summer mean LAI in Fig 2.1.
The second EOF mode shows the dipole pattern between eastern China/Korea and at northern latitudes above 45 degrees latitude. To minimize the mixing of the positive and negative pattern in the second EOF mode and consider the EASM regions, the study domain is determined over 22.5° N-50° N, 105° E-135° E. The correlation coefficient between the rainfall intensity over this study domain, and the low-level circulation intensity (20° N-40° N, 120° E-140° E using northerly winds) used in Wang et al (2013) is 0.47, which is statistically significant above the 99% confidence level (t-test).
Two leading eigenvectors (left panels) and principal components (right panels) from EOF detrended summer LAI from 1982 to 2010.
Model Experiments
- CESM Description
- Experiments design
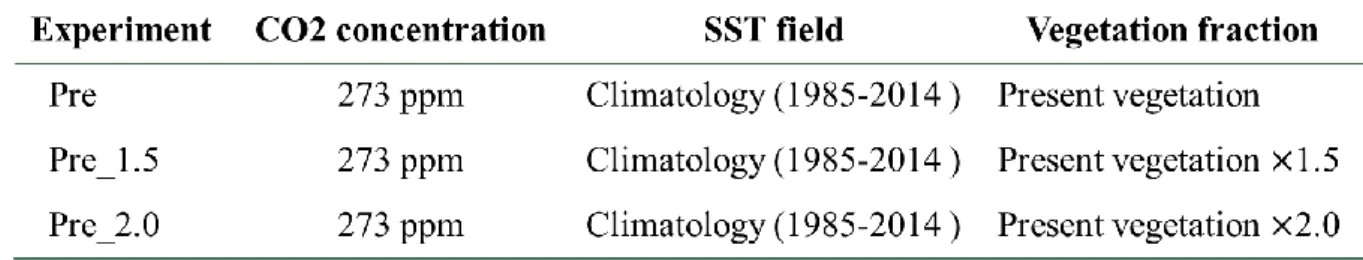
Three experiments are simulated to address the different questions: (1) investigation of the impact of vegetation changes in the EA region, (2) evaluation of the dominant effect between local (evapotranspiration and albedo) and remote responses (moisture convergence and circulation change), when the vegetation changes and (3) to investigate the linear relationship between vegetation impact and the intensity change of EASM. SST is also prescribed to the 30-year climatological mean using NOAA OI SST v2 from 1985 to 2014 to focus on interactions between the vegetation and the EASM apart from the ocean forcing. First, the current climate experiment (Pre) is simulated for the current state with a constant CO2 concentration around 273 ppm.
Secondly, in the elevated vegetation experiment (Pre_1.5), the control vegetation is simulated multiplied by 1.5 over the study domain covering the EA region, including eastern China, Korea and southern Japan, where the functional type of the plant is not changed. The difference between the two current simulations, Pre_1.5 minus Pre, is believed to reflect the effect of increased vegetation over the EA region under current climate conditions. Third, the more the surface vegetation experiment (Pre_2.0) is simulated, the control vegetation multiplies by 2.0 in the same region.
The difference between the two current simulations, Pre_2.0 minus Pre, is considered to explain whether the increased vegetation has a linear relationship with the intensity change of the EASM or not. Because the future vegetation in the multimodel ensemble means of 14 models of Coupled Climate–. Carbon Cycle Model Intercomparison Project (C4MIP) (such as BCC-CSM1.1, BCC-CSM1.1(M), BNU-ESM, CanESM2, CESM1-BGC, GFDL-ESM2G, GFDL-ESM2M, HadGEM2-ES, INMCM4, IPSL -CM5A-LR, MIROC-ESM, MPI-ESM-LR, MRI-ESM1, NorESM1-ME) is 1.3 times and the most variable model changes 1.5 times in the EA region under the RCP 8.5 scenario in the 21 .century, the amount of vegetation increase is determined to be 1.5 times and 2.0 times the control condition to exaggerate the increased vegetation impact.
Results
Validation of EASM on Pre-experiment (Control)
- Horizontal circulation patterns
- Precipitation and water flux
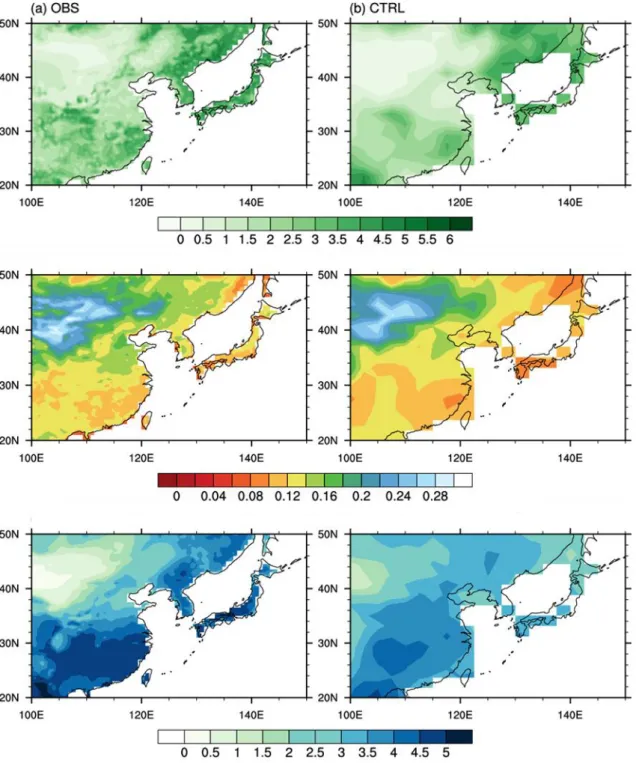
- Land variables
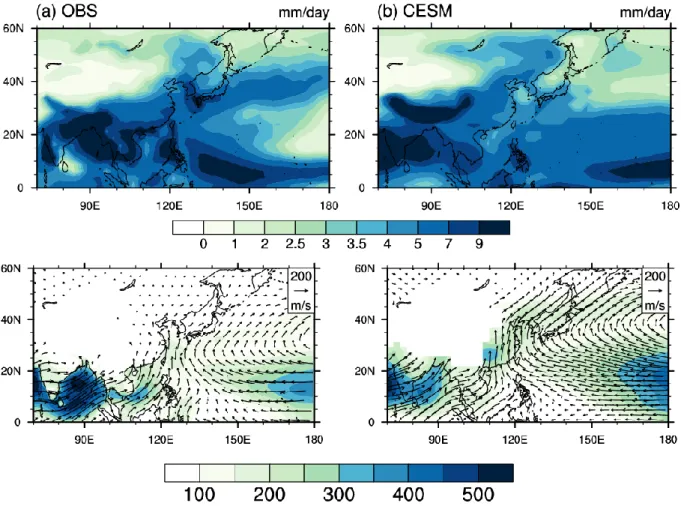
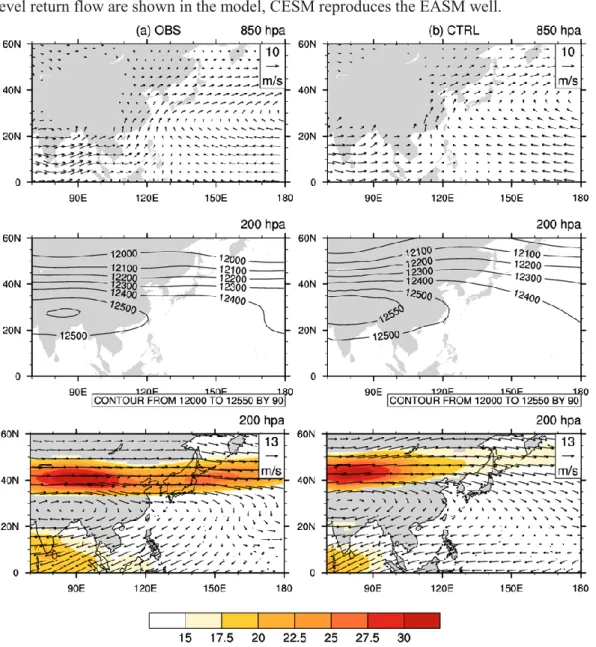
In the model, the strength of the upper-level jet is weaker, and the center of the jet is located to the west and north than the observation. In the CESM control experiment, the strength of the monsoon circulations associated with the EASM is weaker than observed, but the circulation pattern is well reproduced in the model. If the climate model reproduces well the pattern and intensity of monsoon rainfall occurring during observation, the model simulation helps to predict the change in monsoon rainfall.
Compared to the observation, precipitation in the model simulation is overestimated in the western Indian region and Eurasia from southern Tibet to northern Eurasia. Because the southerly wind flow from the tropical monsoon trough and western Pacific high is stronger in the model than observed (Figure 3.1), moisture is transported further inland and to higher latitudes. Although the EASM intensity is weakly simulated by the model, the EASM phenomenon exists in the model.
The bottom panel in Fig 3.2 shows the mean JJA water vapor transport (IVT) below 850 hPa using MERRA and the model control experiment. Because in the model control experiment the winds blow more inland regions than in the observation, water vapor transport is also seen more inland. Southerly over China and anticyclonic flow over the western Pacific have a larger contribution to the moisture transport over the East Asian region in the model.
Since the model control experiment is performed at lower CO2 concentrations than the observations (273 ppm in the model experiment), the pattern is maintained even though there is a difference in the amount of vegetation.
Observed vegetation effect
In the highest and lowest years, the center of the westerly upper-level jet is located at 40° N with 30 m s-1. In the highest years, the westerly jet is weaker over northern China and stronger over Japan than in the lowest years. In peak years, the westerly jet weakens through northern China, south of Korea and Japan, and strengthens over southern China and above 40°N.
The spatial pattern of jet intensity variations is similar to the spatial pattern of precipitation changes. Previous studies reported that the East Asian subtropical westerly jet (EASWJ) is closely related to the precipitation over East Asia (Ha et al, 2005; Nagashima et al, 2013; Zheng-Bin et al, 2014). Ha et al (2005) reported that the strengthening jet is related to the anomalous cyclonic circulation over western Korea.
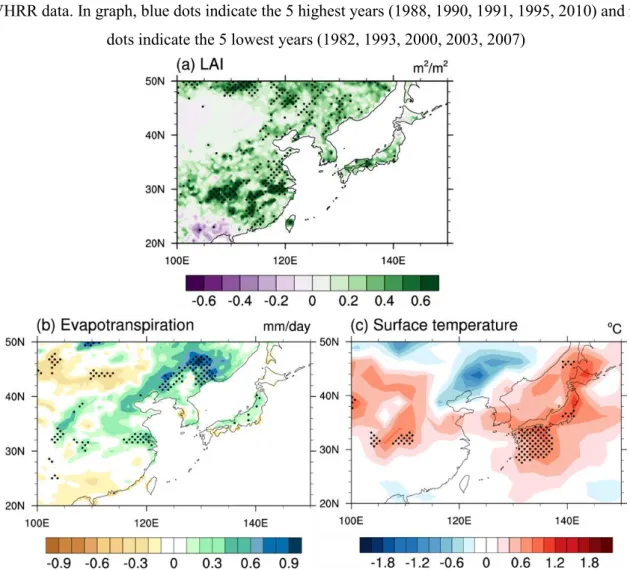
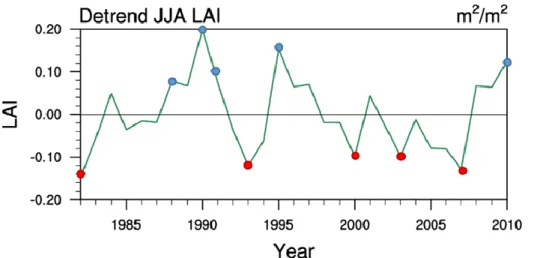
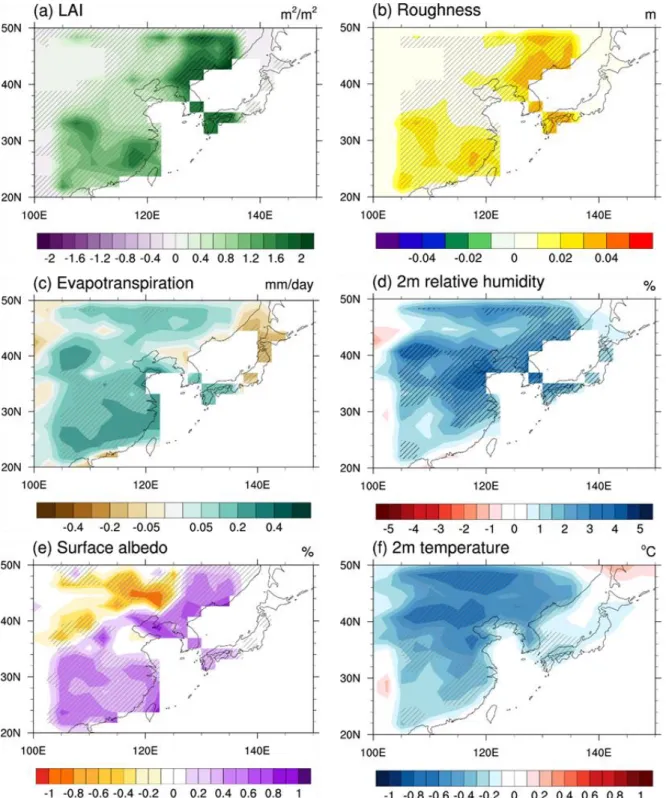
Temporal variation of mean JJA LAI with detrend in the study domain from 1982 to 2010 using AVHRR data. Composite JJA difference between 5 highest and 5 lowest years of mean LAI with JJA detrend in EA domain: (a) LAI (m2 m-2), (b) evapotranspiration (mm day-1) and (c) area. Composite difference of precipitation (mm day-1) and 850 hPa wind (m s-1) during JJA between the 5 highest and 5 lowest years of detrended JJA LAI over the EA domain (top panel) and.
LAI is averaged over the EA domain and precipitation is averaged over the red and blue box areas.
Vegetation impacts on EASM on CESM experiments
- Effect of 1.5 times increased vegetation on present condition
- Effect of 2.0 times increased vegetation on present condition
JJA zonal wind at 200 hPa (m s-1) pattern of control experiment (contours) and difference in zonal wind between Pre_1.5 and Pre experiment (shading). To investigate whether the growth of vegetation has a linear relationship with the intensity of EASM, the difference between Pre_2.0 and Pre-experiment is investigated. When the vegetation increases more in Pre_2.0 simulation than Pre_1.5 simulation, the 2m temperature decreases more in the EA land region because the roughness length increases more and it leads to the enhanced evapotranspiration.
When the vegetation increases more in Pre_2.0 simulation, increased vegetation has a linear relationship with climate change. The increased or decreased precipitation band is longer and the change in northern China is significant in Pre_2.0 experiment, does not appear in Pre_1.5 experiment. In the change of water budget in blue box regions, each term of water budget is greater than the difference of Pre_1.5 experiment (Fig 3.12b).
As the vegetation grows more in the Pre_2.0 experiment, the cooling effect from transpiration is strengthened and the surface temperature further decreases. In the Pre_2.0 experiment, the climate change signal is more evident in the precipitation dipole pattern and surface temperature decrease than the Pre_1.5 experiment. This precipitation variability is also related to the change in the upper-level westerly jet.
Both precipitation and streamflow change are strongly correlated with vegetation change, but the process is difficult to verify observationally. Compared to Pre_2.0 and Pre, the increasing effect of vegetation has a linear relationship with EASM intensity. However, when vegetation increases in the EA region, the cooling effect of evapotranspiration results in a reduced land–ocean temperature difference and weakens the monsoon circulation in the lower layer.
Summery
Effects of deforestation scenarios in the Amazon and Central Brazil on the duration of the dry season in the arc of deforestation. Climate change and forest disturbances: Climate change can affect forests by changing the frequency, intensity, duration and timing of fires, droughts, introduced species, insect and pathogen outbreaks, hurricanes, storms, ice storms or landslides. Impact of deforestation and afforestation in the Mediterranean as simulated by the MPI atmospheric GCM.
The climate prediction center's interannual characteristics included analysis of precipitation over the Korean peninsula during the summer monsoon season. Effects of double cropping on the summer climate of the North China Plain and adjacent regions. Yanai, 1996: Onset and interannual variability of the Asian summer monsoon in relation to the land–sea thermal contrast.
Comparison of GPCP and CMAP fused gauge-satellite monthly precipitation products for the period 1979–2001. Sensitivity of climate simulations to parameterization of cumulus convection in the Canadian Climate Center general circulation model. Role of May Vegetation Greenness on the Southeast Tibetan Plateau for East Asian Summer Monsoon Prediction.
Modeling the climate impacts of different subregional uplifts within the Himalayan-Tibetan Plateau on the evolution of the Asian summer monsoon.