In this study, gaseous and particulate phases of 21 atmospheric PAHs were collected during three seasons (December 2013–August 2014) at a residential area in Ulsan, South Korea. This is a preliminary study for monitoring and health risk assessment of 21 PAHs in South Korea. Seasonal concentrations of total Σ21 PAHs in (a) the gaseous, (b) particulate and (c) total (gaseous + particulate) phases.
Concentrations of US EPA Σ13 PAHs and other Σ8 PAHs not listed among the priority PAHs in (a) the gaseous, (b) particulate and (c) total (gas + particulate) phases.. a) The concentrations and (b) phase distributions of Σ21 PAHs shown in monthly and seasonal variations. Monthly and seasonal variations of the PAHs shown in ring number groups: (a) concentrations and (b) fractions in the gas, particle and total phases.
INTRODUCTION
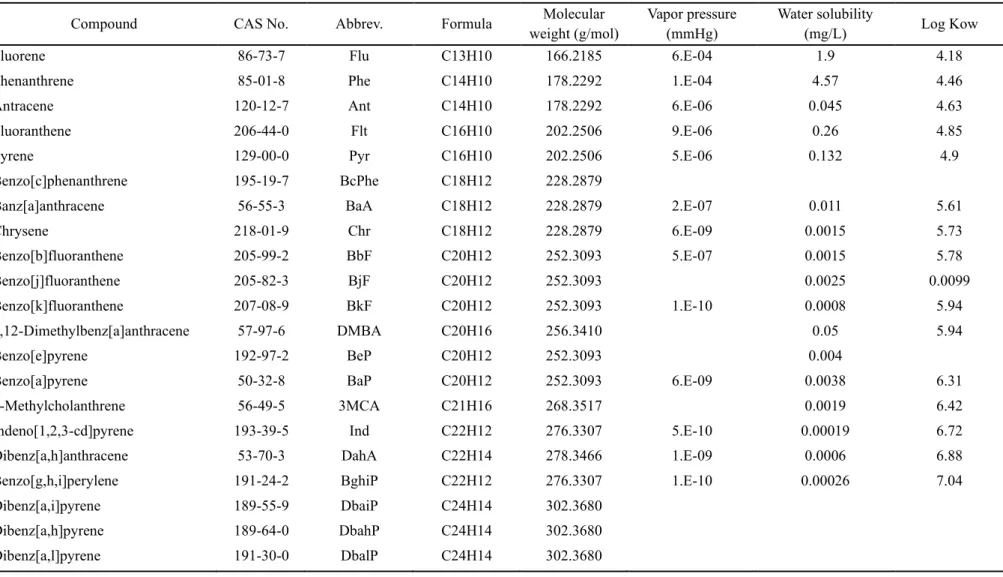
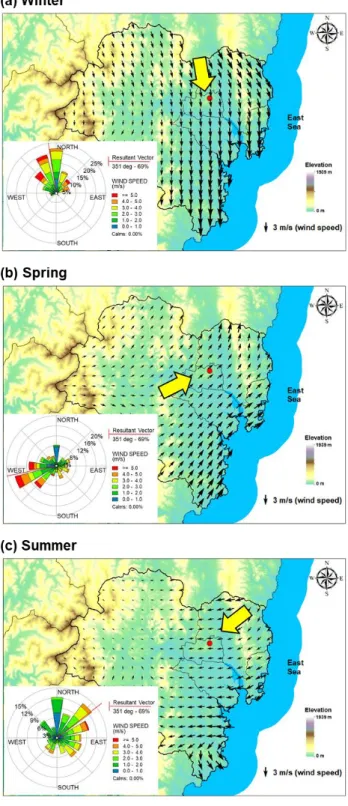
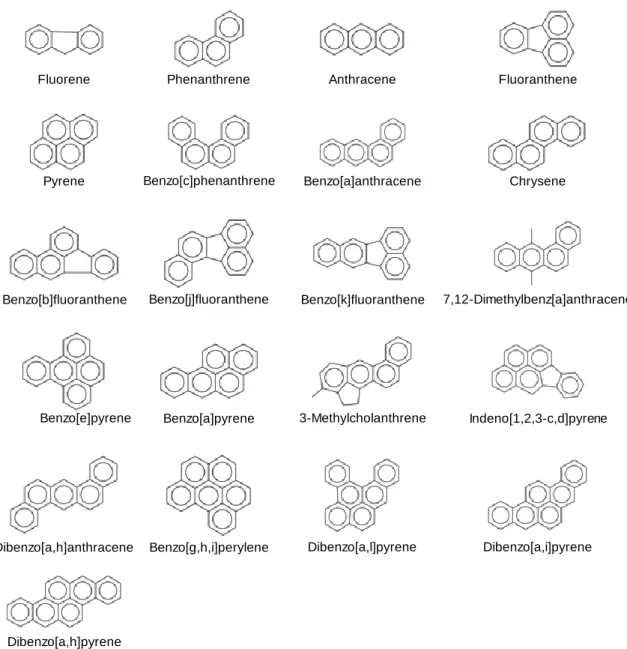
However, the majority of these pollutants are anthropogenic process: coal and biomass combustion, oil and natural gas combustion, and industrial processes (Mostert et al., 2010). Physicochemical properties including formula, molecular weight, vapor pressure, water solubility and Log KOW of the target PAHs at 25 °C (Mackay et al., 2006a). In general, previous studies have reported that the levels and characteristics of the PAHs in Ulsan vary seasonally depending on seasonal winds (Choi et al., 2012b; Nguyen et al., 2018).
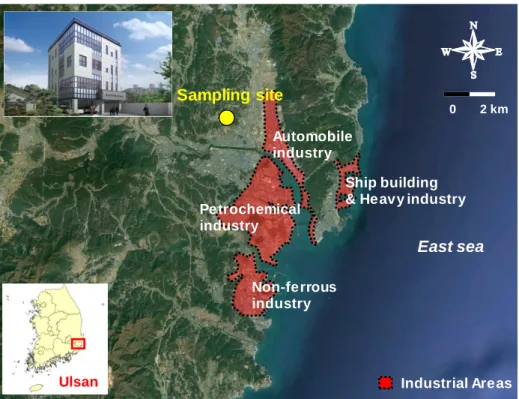
On the other hand, the levels of PAHs in spring are more influenced by yellow sand and long-distance transport from Northeast Asia (i.e., China and North Korea) (Thang et al., 2019). In summer, PAHs originating from industrial areas in Ulsan can move to residential areas through southeast winds (Choi et al., 2012b; Clarke et al., 2014; Nguyen et al., 2018).
MATERIALS AND METHOD
- Ambient air sampling
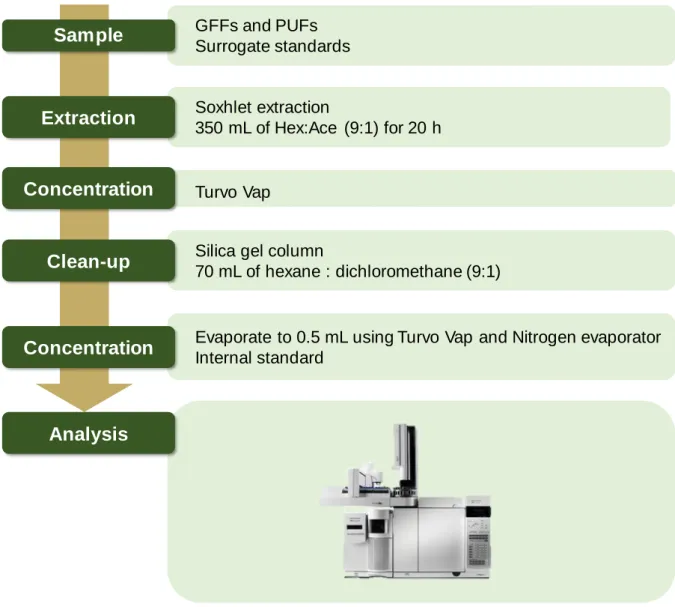
- Analytical procedure
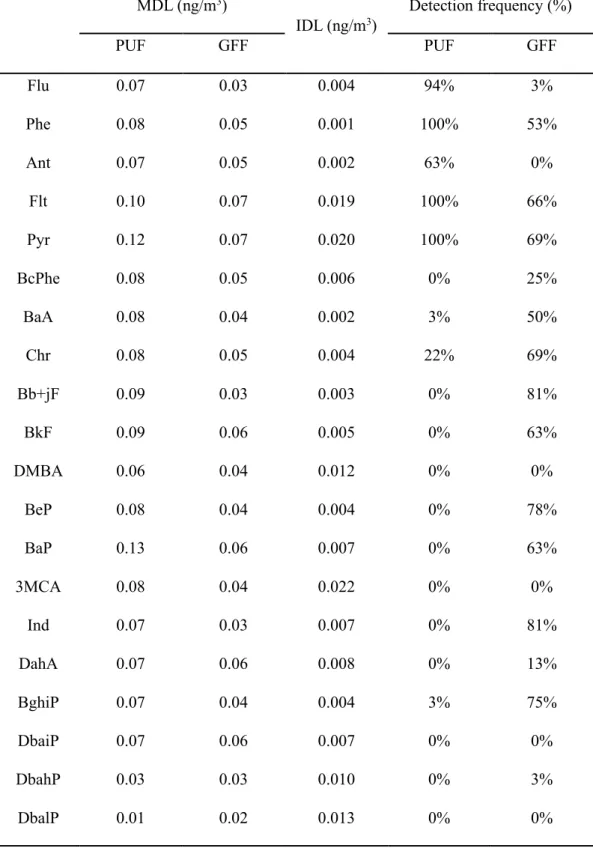
- Quality assurance and quality control (QA/QC)
- Statistical analysis
- Backward trajectory analysis and concentration weighted trajectory (CWT)
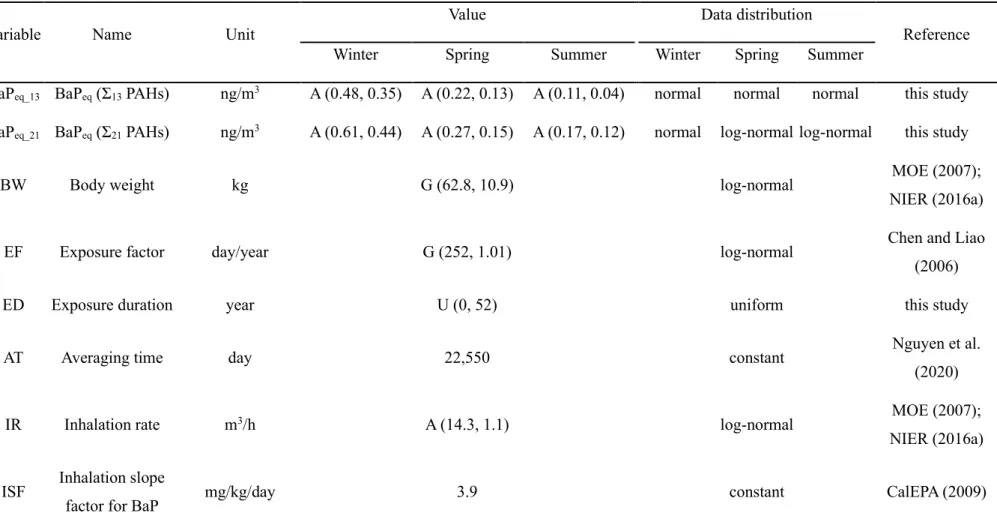
- Health risk assessment
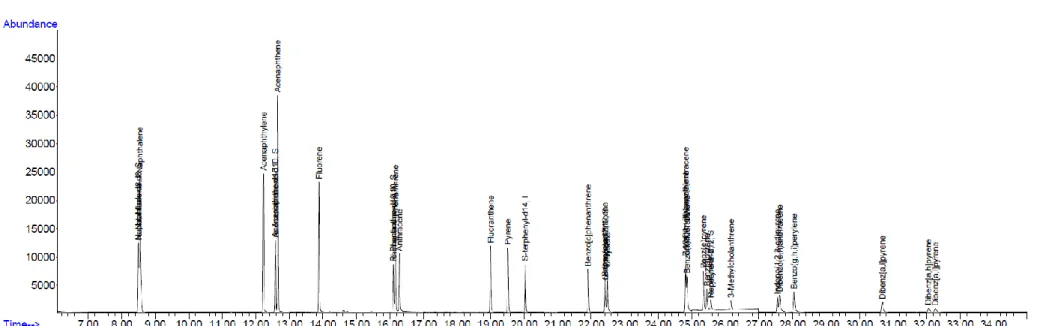
Extracts were concentrated to 10 mL using a Turvo vap (Caliper, USA) and then purified on a silica gel column containing 2 g anhydrous sodium sulfate, 5 g activated silica gel (4 h at 130 °C), and 2 g anhydrous sodium sulfate . g of anhydrous sodium sulfate with 70 ml of n-hexane/dichloromethane (9:1). One µL of the final sample was injected into the GC in splitless mode at 300 °C inlet temperature. The GC was operated in selected ion monitoring mode (SIM) and the carrier gas was helium (He) at a flow rate of 1.0 mL/min.
A principal component analysis (PCA) was performed to understand the pollution characteristics and to estimate the sources of PAHs. Normalized PAH concentration data with only high detection frequencies (> 50%) were selected as input data. Back trajectory analysis produced by the Hybrid Single-Particle Lagrangian Integrated Trajectory (HYSPLIT) model (https://www.ready.noaa.gov/HYSPLIT.php) was used to analyze the air mass movement and the long-range effect of PAH transport (Sofuoglu et al., 2013; Tang et al., 2014; Zhang et al., 2017).
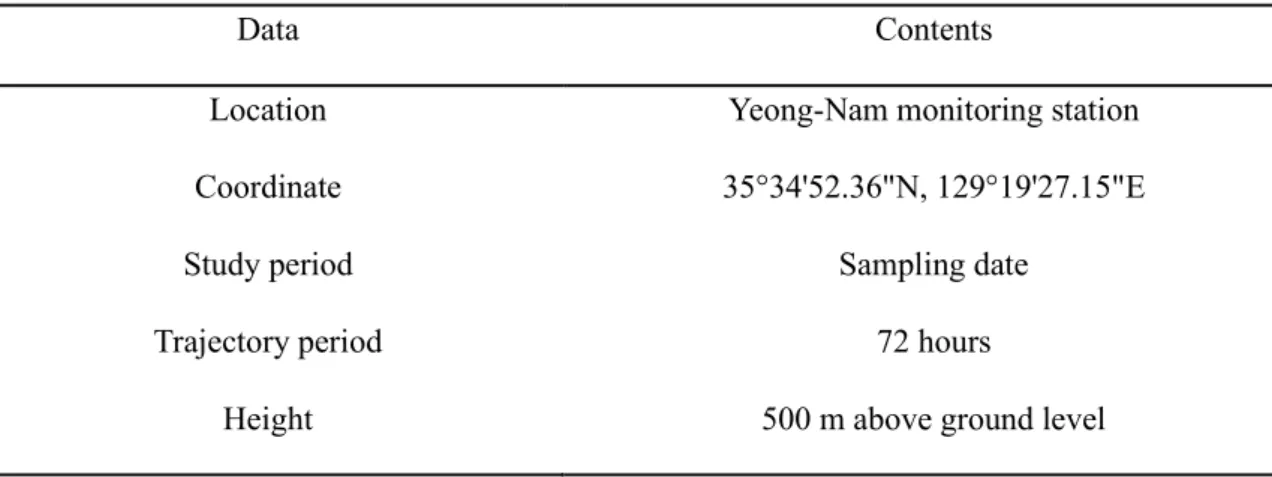
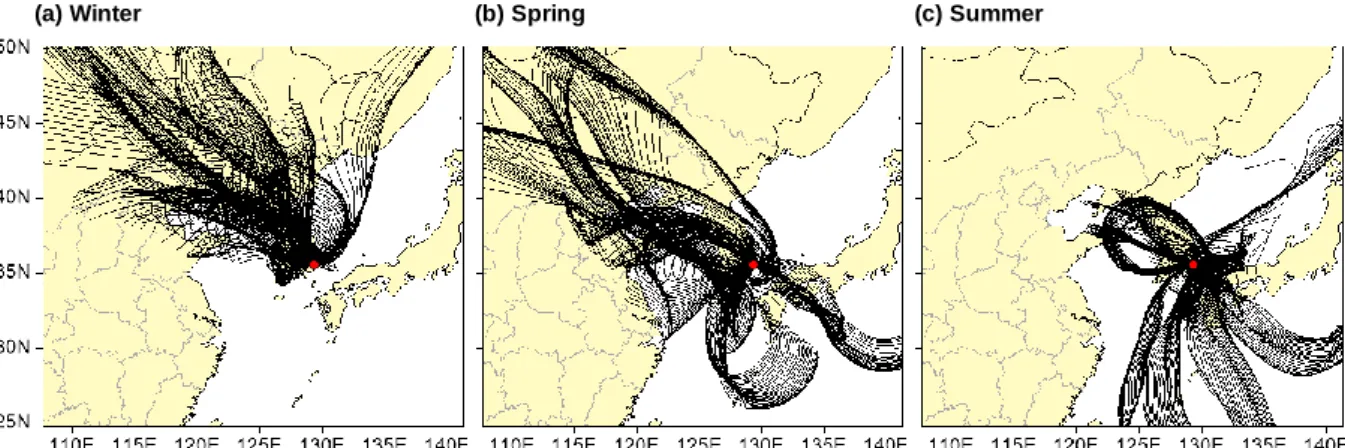
In this study, the 72-hour regression trajectories were calculated using the hourly average data for each 24-hour sample (starting at 11:00 AM local time). A total of 768 tracks were obtained as the number of sampling days was 52 for three seasons. The input data for the HYSPLIT model were listed in Table 4 and backward trajectories during the sampling period were illustrated in Figure 5 .
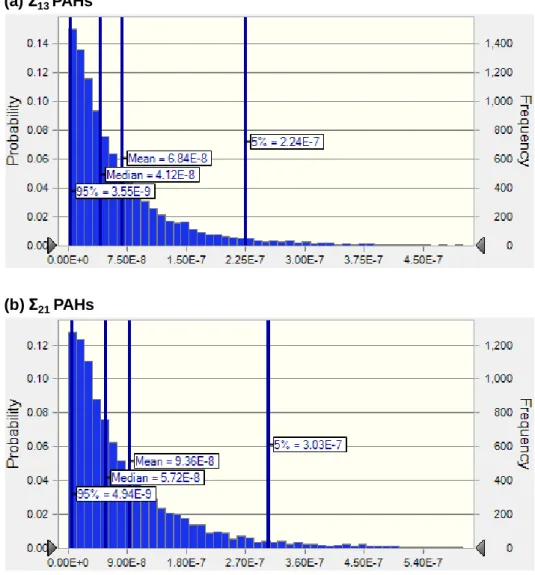
An arbitrary weighting function W(nij) is considered to minimize the effect of a small number of trajectories passing through grid cell i, j, nij. Cancer risk for Σ21 PAH and Σ13 PAH was calculated to estimate the increase in cancer risk for Σ21 PAH over Σ13 PAH. Therefore, a Monte Carlo simulation using Crystal Ball 11.1 (Oracle, USA) with 10,000 replications was used to reduce the uncertainty of the estimates.
RESULTS AND DISCUSSION
Monitoring of 21 PAHs
- Levels and trends of PAHs
- Phase distributions and profiles
In general, increased fuel combustion for heating and less dispersion into the atmosphere due to low temperature and low mixing height lead to the increased levels of PAHs in winter. Additionally, an increase in the mixed layer and a lack of large PAH sources or residential combustion for heating may explain the lowest level of PAHs in summer (Nguyen et al., 2018). Concentrations of US EPA Σ13 PAHs and other Σ8 PAHs not listed among the priority PAHs in (a).
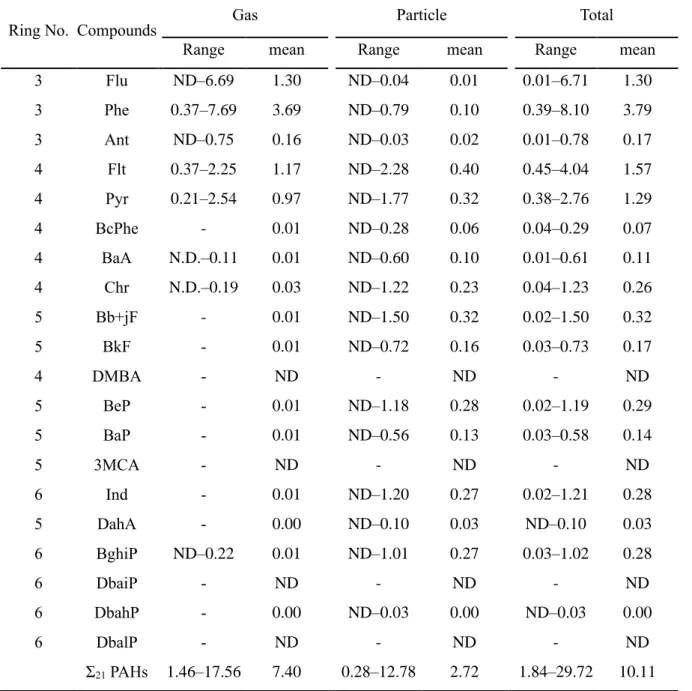
The results of the Spearman correlation analysis between each PAH compound and Σ21 PAH in the gas phase and particulate phase, TSP, PM10 and PM2.5 were shown in Table 8 and 9, respectively. The sum of Σ21 PAH in the gas phase showed a strong correlation with each compound, except with Chr, indicating that the behavior of gaseous PAHs is governed by 3-ring PAHs and some 4-ring PAHs (Flt and Pyr), which have relatively low molecular weights (< 203). Particulate PAHs are strongly correlated with PAH Σ21 and with each other, indicating common sources of PAH pollution.
Among particulates, the particulate Σ21 PAHs showed the strongest correlation with TSP, followed by PM10 and PM2.5. The average gaseous Σ21 PAHs concentration was approx. 2.7 times higher than the particulate one (Mann-Whitney rank sum test, p ≤ 0.001). Moreover, photochemical degradation during transport of gaseous PAHs in the atmosphere causes their decrease in the level at the receptors (Choi et al., 2012a).
The high concentrations of gaseous PAHs in this study can therefore be explained by the effects of local emission sources. Furthermore, the proportion of PAHs in winter and spring was statistically different from that in summer (Mann-Whitney rank-sum test, p < 0.05). Moreover, high temperature and sunlight intensity in summer change the gas/particle distribution of PAHs, resulting in a shift of particulate PAHs to the gas phase (Esen et al., 2008; Kiss et al., 1998). a) The concentrations and (b) phase distributions of Σ21 PAHs shown in monthly and seasonal variations.
Source identification of 21 PAHs
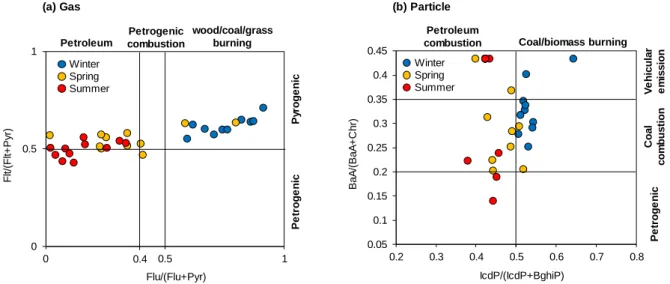
- Source identification
- Long-range transport effect
The air parcel may pass China and North Korea before arriving in Ulsan (Figure 5), suggesting that PAH in Ulsan may be affected by long-distance transport. In spring, the BeP/BaP ratio in Ulsan was higher than the other regions in South Korea, except for Gwangju, suggesting that longer residence time of air parcels (Figure 5) may increase the ratio of BeP/BaP in Ulsan. Briefly, the BeP/BaP ratio in Ulsan may indicate that PAHs in winter and spring may be influenced by long-distance transportation, while those in summer were mostly contributed by the local emissions (i.e., vehicle emissions).
Figures 14 , 15 , and 16 illustrate the CWT of Σ21 PAH and BaP in the gaseous and particulate phases arriving at Ulsan during the three sampling seasons. Gaseous PAHs emitted from northern and northeastern China can reach Ulsan because air from northern and northeastern China can reach Ulsan within 72 hours (Kim et al., 2016a). Northern and northeastern China (i.e., Heilongjiang, Jilin, Liaoning, and Inner Mongolia) may contribute more to gaseous PAHs in Ulsan.
In spring, CWT highlighted that the particulate Σ21 PAHs, including BaP in Ulsan, could be contributed by those originating from eastern China (i.e., Hebei and Shandong), North Korea, and South Korea (Figure 15). On the other hand, the gaseous Σ21 PAHs in Ulsan may be affected by different regions, suggesting that the gaseous Σ21 PAHs could originate from northeastern and eastern China (i.e., Jilin, Inner Mongolia, Liaoning, and Jiangsu) and southern South Korea. In spring, on the contrary, eastern China (i.e., Hebei and .. Shandong) and southeastern North Korea could contribute more to the particulate Σ21 PAHs in Ulsan and were more highlighted in CWT.
Additionally, CWT in the summer highlighted that emission sources from South Korea and Japan may affect particulate PAHs in Ulsan. In summary, in winter, gaseous and particulate PAHs in Ulsan may be influenced by pyrogenic sources (i.e., coal and biomass combustion) and natural gas combustion sources in local and regional areas (i.e., North and Northeast China (i.e., Heilongjiang, Jilin, Liaoning, Inner Mongolia, Hebei, and Shandong) and North Korea). In summer, both gaseous and particulate PAHs can be strongly influenced by local emission sources, especially industrial areas in Ulsan.
Health risk assessment
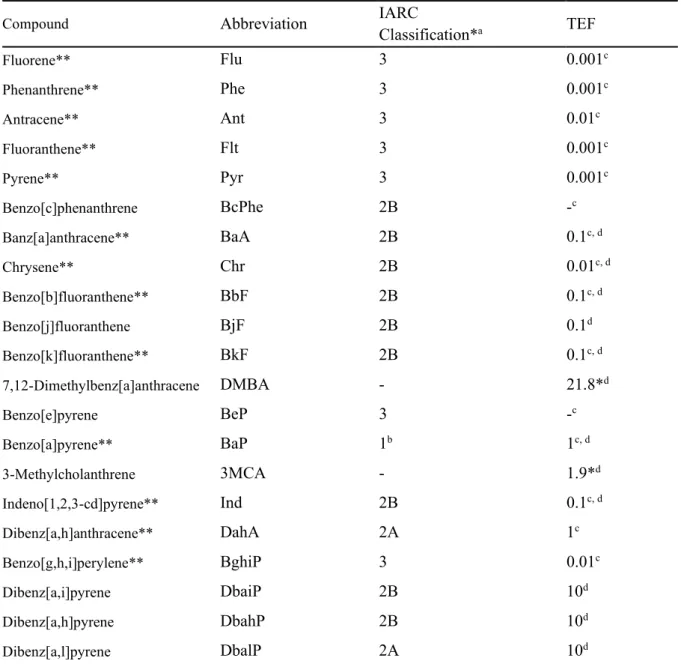
Both the cancer risk of Σ13 and Σ21 PAHs was lower than the acceptable risk level (10-6) proposed by the US EPA. However, ILCRs for total Σ21 PAHs were 1.2 to 1.6 times higher than for Σ13 PAHs because the BaPeq concentrations between Σ13 and total Σ21 PAHs are different. In other words, the high TEF values of PAHs not listed by the US EPA (ie, DbaiP, DbahP, and DbalP) increased BaPeq and cancer risk.
Previous studies have also highlighted the risk of dibenzopyrenes in the atmosphere due to their high toxicity (Hong et al., 2020; Layshock et al., 2010). Therefore, it is important to investigate the toxicity of other PAHs relative to the US EPA priority PAHs and their health risk evaluation in further studies.
CONCLUSION
Gas-particle partitioning and seasonal variation of polycyclic aromatic hydrocarbons in the atmosphere of Zonguldak, Turkey. Factors influencing the level and pattern of polycyclic aromatic hydrocarbons (PAHs) in Gosan, Korea during a dust period. Improving the spatial resolution of atmospheric polycyclic aromatic hydrocarbons using passive air samplers in a multi-industrial city.
Polycyclic aromatic hydrocarbons and petroleum biomarkers in São Sebastião Channel, Brazil: oil pollution assessment. Distribution, seasonal trends and lung cancer risk of atmospheric polycyclic aromatic hydrocarbons in northern China: A three-year case study in Dalian city. Seasonal and spatial trends of suspended particle-associated polycyclic aromatic hydrocarbons in urban Shizuoka, Japan.
Temporal trend and long-range transport of particulate polycyclic aromatic hydrocarbons in Gosan in Northeast Asia between 2001 and 2004. Determination of semi-volatile and particle-bound polycyclic aromatic hydrocarbons in Stockholm air with emphasis on highly carcinogenic dibenzopyrene isomers. Concentration and sources of polycyclic aromatic hydrocarbons associated with fine particles at two locations on the west coast of India.
Seasonal variation, phase distribution, and source identification of atmospheric polycyclic aromatic hydrocarbons at a semi-rural site in Ulsan, South Korea. High spatial resolution monitoring and risk assessment of polycyclic aromatic hydrocarbons in an industrial city. Seasonal characteristics of polycyclic aromatic hydrocarbon (PAH) particles in a petrochemical and oil refinery industrial area on the west coast of South Korea.