Basic Research Paper 18-12
A Study on Possible Use of Consignment Auction to Promote Trading of Emissions Allowances
Younghwan Ahn
Research Staff
Head Researcher: Younghwan Ahn, Research Fellow
Research Assitant: Inseong Sohn, Associate Research Fellow
Jaedo Song, Professor, Chonnam National University
Sooyeol Lee, Professor, Chonnam National University
Jihyun Kim, Researcher
Abstract 1. Research purpose
Phase I (2015–2017) of the Emissions Trading System (ETS) sought to accumulate the experience of the government and businesses running and participating in emissions trading system (ETS) through its flexible operation and to establish a stable MRV framework to track compliance, thereby laying a groundwork for the ETS. Phase I of the ETS Plan generally achieved its goals and has already been completed; Phase II is now underway. However, emissions trading during Phase I was less than expected, and some firms identified allowance shortages at the time of settlement each year as a problem. Although there is no set standard regarding the proper level of emissions allowances for trading, the level of trading must increase in order for the effective reduction of greenhouse gas (GHG) emissions under Phase II and Phase III of the ETS Plan.
This study examined the possible use of consignment auctions launched and operated under the emissions allowances trading system of California (in the United States) to promote emissions allowances trading in Korea.
Consignment auctions enable firms allocated free emissions allowances to consign all or part of their emissions allowances to a third party (institutions specializing in auctions) to sell at auctions to other firms in need of allowances. Through consignment auctions, firms purchase the number of emissions allowances they need, and the revenue from the auction is returned to the original allowance holder. This auction process is conducted before the full-fledged trading of emissions allowances. By engaging in consignment auctions prior to trading, firms can use auction prices to obtain information on the proper market prices of emissions allowances, thereby reducing a significant amount of uncertainty in the emissions allowances trading process.
2. Research Findings
This study examined emissions allowances trading in California utilizing consignment auctions, and found that consignment auctions were used not only for price discovery, but also as a means to reduce the costs of GHG emissions payable by consumers. In California, emissions allowances are distributed to utility companies (instead of to power plants that are the sources of GHG), and auction revenue is returned, in part, to the original holders of the allowances. At the same time, utility providers are required to use the value of the allowances “for the benefit of ratepayers”. While power plants purchase emissions allowances through consignment auctions and reflect carbon costs in their electricity production costs, revenue from auctions is used by utility companies for the good of consumers, lessening the financial burden placed on consumers. This study found that, in California, consignment auctions serve multiple purposes; they are not only used for price discovery, but also as a means to achieve an income redistribution effect for sectors vulnerable to GHG emission reduction policies.
This paper tested cognitive biases that could potentially hinder emissions allowances trading in Korea such as the endowment effect, status quo bias, and loss aversion. This study found that the endowment effect and loss aversion were present among both the general public and firm managers. However, status quo bias was only detected among firm managers. What is particularly interesting is that cognitive biases were more salient among firm managers than the general public. Kreutzer (2006), List (2003), and Plott (1996) believed that firms with the accumulated experience that allowed them to make more rational decisions were less likely to have cognitive biases. However, this study found that rather than the simple accumulation of experience, rational decision- making and compensation for the operation and results of the emissions allowances trading system were more significant in reducing cognitive bias.
This study sought to determine whether consignment auctions could reduce cognitive biases. Consignment auctions mandatorily require that allocated emissions allowances be consigned to a third-party auction institution for auction before the allowances are exercised. Hence, consignment auctions prevent emissions allowances from being completely owned prior to auction, despite their free allocation, and thus make the concept of ownership, from which status quo bias stems, vaguer and blurrier. Initially, it was thought that this would mitigate the endowment effect or status quo bias. However, it was found that consignment auctions failed to significantly reduce the endowment effect. The reason for this is that consignment auctions and emissions allowances trading are generally perceived as separate entities. Although consignment auctions may mitigate the endowment effect or status quo bias to a certain extent, these cognitive biases are seen again during emissions trading.
When the price discovery function of consignment auctions was analyzed using game theory, it was found that consignment auctions can help with the discovery of prices if the firm involved pursues profits through arbitrage.
It was also found that consignment auctions in which only a portion of allocated emissions allowances are traded
can also aid in price discovery. The prices discovered in consignment auction may be considered a collective prediction of future prices by auction participants. Accordingly, the more firms that participate in consignment auctions, the stronger the price discovery function. In this respect, consignment auctions in which entire emissions allowances are traded are more effective than auctions in which only a portion of the allocated emissions allowances are traded. However, this price discovery function has its limits. While unsystematic forecast errors by individual firms can be offset in the process of collecting predictions through auctions, the impact of macroeconomic and other exogenous variables affecting all entities in the economy can hardly be predicted. For this reason, it is reasonable to say that prices discovered through consignment auctions have limited periods of validity.
This study also considered the possible effects of introducing consignment auctions in Korea. First, consignment auctions are likely to be somewhat useful for their price discovery function. The validity of the discovered price information is limited, but the information itself is inherently useful as a reflection of the expectation of market participants at the time of consignment. However, discovered price information has limitations in that it is sporadic.
Phase II of the government’s ETS Plan permits auctions for up to 3% of total allowances, but the government may supply its emissions allowances to the auction market. Should the auction system be introduced, the number of initial participants may be small, but if auctions are conducted multiple times, the limited validity of discovered price information can be overcome. Consignment auctions may be implemented simultaneously with the type of auctions currently being considered by the Korean government. However, if an auction system is implemented, part of the price discovery function of consignment auctions may be negated.
Second, this study sought to determine whether the consignment auction of emissions allowances could relieve the cognitive bias associated with emissions allowances trading and successfully attract the attention of relevant companies. The results of behavioral economics analyses did not significantly show that consignment auctions mitigate cognitive biases. Although the analyses of this study were limited in that some participants may not have fully understood the concept of a “consignment auction”, at the very least, this study failed to confirm the presence of the cognitive bias mitigation effect. However, as Burtraw and McCormack (2017) argued, consignment auctions have the power to increase businesses’ interest in and attention to the trading and auction of emissions allowances, thereby helping them approach emissions allowance transactions in a more rational way.
Third, this study sought to determine whether the negative impact/costs of GHG reduction passed on to consumers could be offset by consignment auction revenue, as seen in the case of California. The answers to this were inconclusive. Since the domestic electricity price is regulated, the costs of GHG reduction are not directly passed on to consumers in the short-term. The passing of GHG reduction costs to consumers may be considered when the electricity bill includes costs of emissions allowances prices or GHG reduction costs. We believe that such costs will only be included when the share of emissions allowances being traded through auctions reaches 10%, i.e., after Phase III of the ETS Plan. With regards to this issue, it is necessary in Phase II of the ETS Plan to determine the purpose for which auction revenue should be utilized and set specific research and policy directions accordingly. When determining policy goals, policymakers must carefully choose whether to prioritize the development of GHG reduction technologies or provide support for vulnerable sectors.
In conclusion, consignment auctions do have their advantages, but the effective utilization of several elements of the current emissions trading system in Korea can also achieve these benefits. The auction system soon to be implemented in Phase II of the ETS Plan and the trading of government emissions allowances in the auction market are expected to achieve a price discovery effect. The concept of the consignment auctions is not well known in Korea, and there is no robust evidence that consignment auctions can mitigate the cognitive biases associated with the trading of emissions allowances. Consignment auctions are beneficial in that their revenue can be used to support the vulnerable sector; however, the auction system soon to be introduced in Korea can also achieve this effect. In summary, unless there is necessity for dramatically drawing attention to emissions allowances trading and/or auction, the introduction of the consignment auction system should be delayed for the time being.
3. Conclusion and Significance
This study analyzed the characteristics, strengths, and weaknesses of consignment auctions for emissions allowances, and reviewed the feasibility of applying the consignment auction system in Korea. It was found that some of the advantages of consignment auctions can be achieved through the effective utilization of the emissions allowances trading system soon to be introduced in Korea. Thus, this study concluded that the introduction of a consignment auction in Korea should be delayed. This paper examined diverse aspects of consignment auctions
through the conducting of a case study, behavioral economic analysis, and game theory analysis. Results showed that: cognitive biases exist in regards to emissions allowances trading in Korea; cognitive biases are greater among firms than among the general public; and prices discovered through consignment auctions are valid only for a limited time.
Table of Contents Abstract 3
Chapter 1. Introduction ... 11
1. Background ... 11
2. Objectives and Outline ... 13
Chapter 2. Overseas Cases of Consignment Auction and the Current State of Domestic Trading in Emissions Allowances ... 14
1. California’s Consignment Auctions for ETS ... 14
A. Regulatory scope of the ETS ... 14
B. Cap on emissions allowances and distribution ... 15
C. Consignment auction for electricity firms ... 18
D. Use of revenue from consignment auctions ... 19
E. Purposes of consignment auctions for California’s ETS ... 20
2. Current State of Korea’s Emissions Allowance Trading ... 23
A. Outline of Korea’s ETS ... 23
Chapter 3 Survey on Responses to the ETS and Trading ... 27
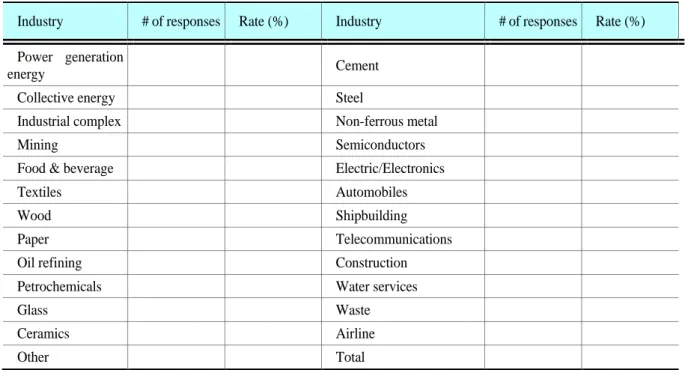
1. Outline of survey on the practices of ETS target entities ... 28
A. Survey targets and respondents ... 28
B. Elements in the survey ... 28
C. Technical statistics on respondents: current situation of those in charge of the ETS ... 29
2. Awareness of the ETS and Responses... 30
A. Awareness of the ETS ... 30
B. ETS response activities in phase I ... 31
2) Specific response activities ... 32
3. Allowances allocation and participation in allowances trading ... 33
A. Allowances allocation ... 33
B. Participation in allowances trading ... 34
C. Factors of the preference to bank allowances ... 35
D. Stumbling blocks to active allowances trading ... 36
4. Allowance allocations and participation in trading ... 37
A. Practical characteristics of the ETS ... 37
B. Initial allocations and trading participation, and perception of stumbling blocks to active trading . 38 C. An organization’s level of response to the ETS and preference for over-retention ... 38
D. Different response activities according to an organization’s level of response to the ETS ... 39
5. Awareness of consignment auctions for allowances ... 40
A. Awareness of consignment auctions ... 40
B. Expected consignment auction effects ... 41
C. Factors in promoting awareness of consignment auctions ... 42
6. Sub-conclusion ... 45
Chapter 4 Analysis of Cognitive Bias in Allowances Trading ... 45
1. Outline of cognitive bias in allowances trading ... 45
2. Theoretical background and hypothesis setting ... 46
A. Endowment effect ... 46
B. Status quo bias ... 48
C. Preference for over-retention ... 48
3. Test design ... 50
A. Outline of tests ... 50
B. Test to verify the endowment effect ... 51
C. Test to verify status quo bias and preference for over-retention ... 52
D. Distribution and collection of surveys ... 53
4. Results of test analysis ... 53
A. Verification of the endowment effect ... 53
B. Verification of status quo bias and preference for over-retention ... 55
5. Sub-conclusion ... 57
Chapter 5 Game Theory Analysis of the Effect of Consignment Auctions ... 58
1. Review of existing game model analysis ... 58
2. Model assumptions ... 59
3. Model analysis: perfect information model ... 59
A. Perfect information situation without consignment auctions ... 59
B. Perfect information situation with consignment auctions ... 61
4. Model analysis: imperfect information model ... 63
A. Imperfect information situation without consignment auctions ... 63
B. Imperfect information situation with consignment auctions ... 63
C. Imperfect information situation with proportional consignment auctions ... 65
5. Sub-conclusion ... 67
Chapter 6 Grand Summary and Conclusion ... 68
1. Grand summary and policy implications ... 68
A. Summary of Analysis ... 68
B. Domestic situation and policy implications ... 69
2. Conclusion and Direction of Future Research ... 70
References ... 71
Appendix ... 76
List of Tables
Table 2-1. Cap on Emissions Allowances for California’s ETS ... 15
Table 2-2. Portion of Allowance Price Containment Reserve ... 16
Table 2-3. Minimum Allowance Consignment for Natural Gas Suppliers ... 18
Table 2-4. IOU Use of Allowance Value ... 20
Table 2-5. Allowance Allocations, Shortage and Surplus ... 26
Table 2-6. Allowance Conversion and Trading ... 26
Table 2-7. Allowance Submissions and Banking ... 27
Table 3-1. Distribution of Survey Respondents, by Industry ... 28
Table 3-2. Key Elements of the Survey ... 28
Table 3-3. Statistics on Respondents’ Positions ... 30
Table 3-4. Difference in Participation in Allowances Trading According to Initial Allocations ... 38
Table 3-5. Initial Allocations & Perception of Stumbling Blocks to Trading (can select up to 3 choices) ... 38
Table 3-6. Organizational Level of Response & Reasons to Prefer Banking Surpluses (respondents to choose only one reason) ... 39
Table 3-7. Organization Level of Response & Different ETS Response Activities ... 39
Table 3-8. Adequacy of Allowance Allocations & Expectations regarding the Effects of Consignment Auctions ... 44
Table 3-9. Preference for Banking of Allowance Surpluses & Consignment Auction Expectations ... 44
Table 4-1. Characteristics of Samples Used to Verify the Endowment Effect ... 53
Table 4-2. Analysis of Difference in Endowment Effect between Students and Workers Directly Involved in Allowances Trading ... 54
Table 4-3. Analysis of the Effect of Consignment Auctions on the Endowment Effect ... 55
Table 4-4. Characteristics of Samples Used to Verify Status Quo Bias and Preference for Over-retention ... 55
Table 4-5. Statistical Verification of Status Quo Bias ... 56
Table 4-6. Statistical Verification of Preference for Over-retention ... 56
List of Figures
Figure 2-1. Allocation of Emissions Allowances for Transition Assistance & to Prevent Carbon Leakage ... 17
Figure 2-2. Composition of Sources Allowances Sold in California’s Allowance Auctions ... 20
Figure 2-3. California’s Allowance Auction Settlement Price and Allowance Futures Price ... 21
Figure 2-4. Allowance Prices and Trading Volumes ... 24
Figure 2-5. Yearly Allowance Trading Volumes: EU's ETS ... 25
Figure 3-1. Departments to which Survey Respondents Belong ... 29
Figure 3-2. Perception of the ETS ... 30
Figure 3-3. Level of Response to the ETS ... 31
Figure 3-4. Specific Response Activities ... 32
Figure 3-5. Obstacles in Responding to the ETS ... 33
Figure 3-6. Allocation of Allowances in Phase I ... 33
Figure 3-7. Methods of Acquiring & Using Allowances ... 34
Figure 3-8. Experience with Allowances Trading in Phase I ... 35
Figure 3-9. Reasons behind Preference for Banking Allowance Surpluses ... 35
Figure 3-10. Stumbling Blocks to Active Allowances Trading ... 36
Figure 3-11. Awareness of Consignment Auctions ... 40
Figure 3-12. Expectations of Consignment Auction Effect ... 41
Figure 3-13. Effect of Perception of the ETS on Expectations of Consignment Auctions ... 42
Chapter 1. Introduction 1. Background
Since it was launched in Korea in 2015 as a core policy for reducing the country’s greenhouse gas (GHG) emissions, the emissions trading system (ETS) underwent a three-year phase I and entered phase II in 2018 (Ministry of Environment, 2018). Despite some variation, the ETS designed for Korea - off of the EU’s ETS - is viewed to have “settled” despite being in the infancy stages of implementation. Some companies have filed lawsuits over emissions allowances for individual companies, but the rules of the overall ETS, measurement, reporting and verification (MRV) of GHG emissions, and infrastructure related to emissions allowance trading have been successfully introduced and operated.
However, many have claimed there are insufficient emissions offered for sale and emissions allowance trading is lackluster prior to June when the settlement is made each year. In response, the government partially shifted the system towards expanding flexibility in the supply of emissions allowances in a bid to stabilize the market. In spring 2016, when there was a short supply of emissions allowances, the government raised the borrowing limit between years of execution in phase I of the ETS plan from 10% to 20% (Digital Times, 2016; Article 36 (2) of the Enforcement Decree to the Emissions Allowances Trading Act). In the first quarter of 2017 when 27 companies grappling with insufficient emissions due to a spike in emission prices along with the shortage of emissions for sale together submitted a proposal, the government took action to stabilize the market in April 2017, including limiting emissions banking and adjusting the borrowing limit (relevant Ministries, 2017). It placed strict limitations on banking from phase I of the ETS plan to phase II, thereby providing some emissions to the market and temporarily alleviating the tight supply. Nevertheless, concerns persist over the supply shortage and tepid trading.
Reasons for the softness in emissions allowance trading can largely be explained from three perspectives. The first assumes that market players make reasonable decisions. The first element of this perspective is uncertainty over future policy. The country’s GHG emission reduction target for 2030 was set in 2015, but sector-specific targets have been revised or supplemented even recently. The intensity of GHG emission reduction policies have varied depending on the policy regimes. When uncertainties linger over future policy, companies may be more inclined to be conservative and hold emissions. The second element is uncertainty over emission prices. Lackluster trading of emissions allowances stands in the way of establishing appropriate market prices for those allowances, hindering companies from actively engaging in trading. When trading is lackluster, a fair price is unlikely to be established, which, in turn, impedes trading. The third element is transaction cost relating to emissions allowance trading. This encompasses the costs of analyzing the costs of emissions reduction, surveys of market conditions, hiring personnel, and receiving consulting for emissions allowance trading. For companies generating few emissions, such transaction costs can be burdensome.
The second perspective is based on cognitive biases of market players. Cognitive biases associated with emissions allowance trading include the endowment effect, status quo bias, and loss aversion (Gilhwan Kim and Seonghee Shim, 2017). The endowment effect, also known as a disparity between willingness-to-pay (WTP) and willingness-to-accept (WTA), refers to a phenomenon in which WTA for a product or service is consistently higher than WTP. Status quo bias is a preference for the current state of affairs to avoid risk from uncertainty although there is a chance to transition to a better state of affairs. Loss aversion refers to a tendency to hold more goods than one needs at present to avert risk in the future. If an entity or individual engaged in emissions allowance trading has such biases, emissions allowance trading will become less effective.
The third perspective is market conditions. The emissions allowance trading market in Korea is currently thin and in an upturn. In 2015, 282 of 522 companies - about 54% of those subject to emissions allowance trading - were allocated higher emissions allowances than their actual emissions, while in 2016, this proportion was 67%, or 374 of 560 companies (Greenhouse Gas Inventory and Research Center of the Ministry of Environment, 2018). The number of target entities was small, and there was only a limited number of companies with the capacity to actively participate in emissions allowance trading. Accordingly, the market was tiny. Moreover, the price of emissions allowances had soared to KRW 28,000 per ton by July 2018 from about KRW 8,000 per ton in early 2015 (Korea JoongAng Daily, 2018).
Taking into account companies will have to further reduce GHG emissions going forward, the price of emissions allowances will likely increase more without a dramatically-higher supply of emissions allowances. Under these circumstances, companies will opt to bank up as many emissions allowances as they can, as long as the emissions allowance price is not extravagantly high.
There have yet to be clear standards set as to an adequate level of emissions allowance trading, but operators of the ETS are attempting to promote such trading to enhance the overall efficiency of reducing GHG emissions.
This is because the ETS can be evaluated in terms of effectiveness and efficiency of reducing such emissions, with efficiency linked to smooth trading. This study will examine the possible use of consignment auctions, similar to those in use in California (USA), to revitalize emissions allowance trading in Korea.
Consignment auctions enable firms who have received free emissions allowances to consign all or part of their allowances to a third party (institutions specializing in auctions) to sell at auctions to other firms in need of those allowances (Gilhwan Kim and Seonghee Shim, 2017). Through consignment auctions, firms purchase the number of emissions allowances they need, with the revenue from the auction returned to the original allowance holder.
That is to say, such auctions are revenue neutral. This auction process is conducted before the full-fledged trading of emissions allowances, which allows firms to use auction prices as indicators of the proper market prices of emissions allowances, thereby reducing a significant amount of uncertainty in the trading process (Burtraw and McCormack, 2017).
For example, a company is allocated one million tons of free emissions allowances, and consigns all of it to an institution to sell at auction. According to internal analysis, it needs 900,000 tons of emissions allowances this year. The company participates in the auction conducted by the institution to win 900,000 tons of allowances at KRW 20,000 per ton. It pays KRW 18 billion (KRW 20,000 per ton * 900,000 tons) and receives KRW 20 billion (KRW 20,000 per ton * one million tons). The KRW 20,000 settlement price can be seen as the appropriate market price revealed in the auction.
According to Burtraw and McCormack (2017), consignment auctions can promote emissions allowance trading through the price discovery function immediately after the allocation of emissions allowances. They also noted that mandating all target entities to participate in consignment auctions in the early stages may inspire active interest among high-ranking company officials in emissions allowance trading, and therefore efficiently improve the decision-making process for such trading. They cited the US acid rain program and California’s ETS as successful cases of consignment auctions. In addition, they mentioned that consignment auctions may have a greater impact on new emissions allowance markets or small markets.
The researchers involved in this study paid particular attention to the price discovery function of consignment auctions and mandating all companies subject to emissions allowance trading to participate in the early stages. As mentioned earlier, assuming market players make reasonable decisions, one of the key reasons for weak trading was the uncertainty about emissions allowance prices. A consignment auction creates a single price reference point as the settlement price is disclosed through a large scale auction. This price will serve as an important reference for trading. Also, as companies have to consign allocated emissions allowances and purchase them at auction, this may serve to alleviate the cognitive biases of endowment effect, status quo bias and loss aversion. In addition, as Burtraw and McCormack (2017) noted, the auction preparation process may inspire interest among corporate executives in emissions allowance trading and lead to organizational overhaul, which may help promote such trading. Moreover, as companies receive revenue from such auctions, chances are high that this will serve to increase their likelihood of accepting consignment auctions. Taking into account these advantages, this study will explore the possibility of using consignment auctions in Korea.
2. Objectives and Outline
The purpose of this study is to conduct an in-depth analysis of the characteristics, advantages and disadvantages of consignment auctions and explore the possibility of using them in Korea and present conditions for their use.
To meet this objective, the researchers set three sub-objectives. The first is to accurately identify the purpose behind consignment auctions overseas. The second is to confirm whether experimentation with consignment auctions can alleviate cognitive biases in the domestic situation. The third is to attempt an analytical analysis of the conditions needed for consignment auctions to help with price discovery.
To this end, chapter 2 will take a look at the characteristics of the ETS in the US state of California, the only place in the world where consignment auctions are in place for emissions allowances. It will also review emissions allowance trading and submitted data for phase I of the ETS plan in Korea to understand, from a market perspective, the negative inclinations towards trading from participating companies. Chapter 3 will examine company attitudes towards the ETS and reasons for their inactivity in trading through a corporate survey designed to identify the reasons for weak trading in Korea. Chapter 4 will examine whether cognitive biases exist over the ETS through behavioral economics experimentation, and whether consignment auctions can alleviate these biases.
Chapter 5 will examine the conditions triggering the price discovery function at consignment auctions and the scope of the roles of those auctions through a game theory analysis. Lastly, chapter 6 will combine the findings of our analysis to present policy implications and possible application to Korea.
Chapter 2. Overseas Cases of Consignment Auction and the Current State of Domestic Trading in Emissions Allowances
This chapter will examine the purpose and details of consignment auctions through a case study. Currently, countries and regions that have launched an ETS include the EU, Australia, China, Japan, Canada, and the US.
California, USA is the only place where consignment auctions have been launched. We will take a look at consignment auction specifics there, to draw implications regarding their purpose, advantages and disadvantages.
Then, we will identify target entities’ inclination towards trading and compliance with regulations based on emissions allowance trading and submitted data.
1. California’s Consignment Auctions for ETS
In 2006, California passed Assembly Bill No. 32, the California Global Warming Solutions Act of 2006 (hereinafter AB32).1 AB32 aimed to reduce GHG emissions in the state to 1990 levels by 2020, setting the stage for introducing relevant rules and regulations. In particular, AB32 introduced market-based compliance mechanisms as some of the regulatory means to reduce GHG emissions. It also tasked the California Air Resource Board (CARB) with supervision and control over reduction of those emissions.
In October 2011, CARB endorsed the California Cap on Greenhouse Gas Emissions and Market-Based Compliance Mechanisms,2 and the state’s ETS came into effect in the latter half of 2012. In 2012, the pilot project period, the system was not strictly enforced, but this changed in January 2013.
A. Regulatory scope of the ETS3
Under California’s ETS, GHGs include carbon dioxide (CO2), methane (CH4), nitrous oxide (N2O), sulfur hexafluoride (SF6), hydrogen fluoride (HFCs), perfluorocarbons (PFCs), nitrogen trifluoride (NF3), and other fluorinated greenhouse gases. Regulatory targets encompass manufacturers, electricity firms, fossil fuel suppliers, and CO2 suppliers. More specifically, regulatory targets are broken down in the following way:
⒜ Industries that have one or more manufacturing processes or facilities related to the following: ① cement,
② cogeneration, ③ glass production, ④ hydrogen production, ⑤ steel production, ⑥ lead production,
⑦ lime production, ⑧ nitric acid production, ⑨ petroleum and natural gas systems, ⑩ petroleum refining, ⑪ pulp and paper manufacturing, ⑫ self generation, ⑬ fixed combustion
⒝ Electricity producers and importers (first deliverers of electricity)4
⒞ Natural gas suppliers
⒟ Refined oil product suppliers
⒠ Liquefied petroleum gas suppliers
⒡ Blended fuel suppliers using fuels specified in ⒞-⒠
1 Assembly Bill No. 32, the California Global Warming Solutions Act of 2006 (http://www.leginfo.ca.gov/pub/05- 06/bill/asm/ab_0001-0050/ab_32_bill_20060927_chaptered.pdf), accessed on October 26, 2018
2 California Code of Regulations, Title 17 Subchapter 10 Article 5, California Cap on Greenhouse Gas Emissions and Market- Based Compliance Mechanisms (http://ccr.oal.ca.gov/linkedslice/default.asp? SP= CCR-1000&Action=Welcome), accessed on October 26, 2018
3 California Code of Regulations Title 17 Subchapter 10 Article 5 §95810, 95811, 95812, 95851
4 In order to prevent “carbon leak” occurring from electricity imported into California, imported electricity produced outside of the state is included in regulatory targets and the obligation imposed of satisfying the rules on GHG emissions generated in the process of producing the electricity supplied to the first distributor in California’s electricity market.
⒢ Liquefied natural gas or compressed natural gas suppliers
⒣ CO2 suppliers5
In phase I of the ETS plan (2012-2014), regulatory targets were confined to large-scale industries (a), first deliverers of electricity (b), and CO2 suppliers (h), which generate 25,000 tons or more of CO2eq. However, starting in 2015, this was expanded to fuel suppliers (c-g) to include for-transportation fuel combustion and fuel combustion in small-scale industrial facilities and all residential and commercial facilities generating less than 25,000 tons of CO₂eq.
B. Cap on emissions allowances and distribution 1) Cap on emissions allowances
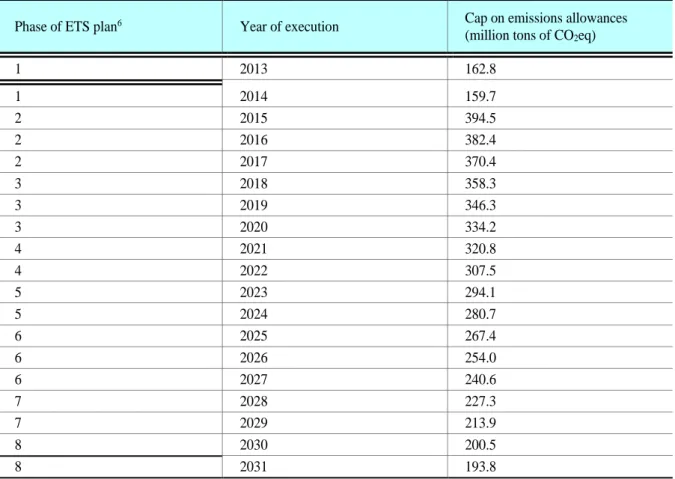
Table 2-1 shows the cap on emissions allowances from 2013-2031 for California’s ETS. According to this table, this cap is expected to decrease steadily at a CAGR of 4.3% from 394.5 million tons of CO2eq in 2015 to 193.8 million tons of CO2eq in 2031. The cap on emissions allowances stands at 334.2 million tons of CO2eq in 2020, or 77.5% of the 2020 emissions target of 431 million tons of CO2eq, and reaches 200.5 million tons of CO₂eq in 2030, or 77.1% of the 2030 emissions target of 260 million tons of CO2eq (CARB (2017), p. 24).
Table 2-1. Cap on Emissions Allowances for California’s ETS
Phase of ETS plan6 Year of execution Cap on emissions allowances
(million tons of CO2eq)
1 2013 162.8
1 2014 159.7
2 2015 394.5
2 2016 382.4
2 2017 370.4
3 2018 358.3
3 2019 346.3
3 2020 334.2
4 2021 320.8
4 2022 307.5
5 2023 294.1
5 2024 280.7
6 2025 267.4
6 2026 254.0
6 2027 240.6
7 2028 227.3
7 2029 213.9
8 2030 200.5
8 2031 193.8
Source: California Code of Regulations, Title 17 Subchapter 10 Article 5 §95841
5 This refers to those that supply carbon dioxide to facilities making commercial use of it or collect or extract carbon dioxide for storage in underground facilities, or export or import carbon dioxide.
6 The phases of the ETS plan for 2021 and beyond will be valid if the US EPA approves California’s compliance scheme over the Clean Power Plan. If the US EPA rejects it, phase IV of the ETS plan will be from 2021-2023, and the subsequent phases will be comprised of three years.
The cap on emissions allowances from 2032-2050 is calculated based on the following formula, and will steadily decline by 6.7 million tons of CO₂eq each year into 2050.
is California’s cap on emissions allowances in the year (Unit: million tons)7 2) Allocation of emissions allowances
In California, emissions allowances are allocated for the Allowance Price Containment Reserve, Advance Auction, Voluntary Renewable Electricity Program, and granted free to manufacturers, electricity firms, natural gas suppliers, and other sectors. The remaining allowances are sold through additional auctions (CARB (2018a) pp. 148-152, 160-162).
This section will take a brief look at the Allowance Price Containment Reserve, Advance Auction, and free allocations for manufacturers which take up a large portion of total allocations. The following section will cover, in detail, free allocations for electricity firms and natural gas suppliers directly linked to consignment auctions.
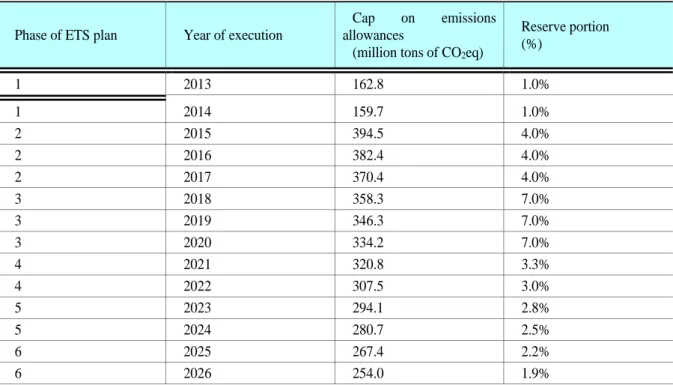
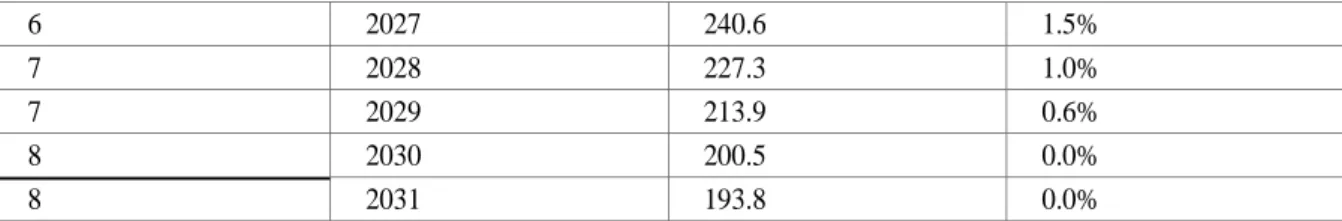
■ Allowance Price Containment Reserve
CARB reserves a certain portion of the cap on emissions allowances each year to stabilize the price of those allowances, and sells them on a quarterly basis through the Reserve Auction, which is held six weeks after the Current Auction in each quarter. Excluding the third quarter’s Reserve Auction to be held immediately before the submission date of emissions allowances (November 1 of each year), Reserve Auctions are held only when the settlement price at the immediately preceding Current Auction is above 60% of the lowest reserve8 tier price (CARB (2018a) pp.
233-234).
Table 2-2. Portion of Allowance Price Containment Reserve
Phase of ETS plan Year of execution
Cap on emissions allowances
(million tons of CO2eq)
Reserve portion (%)
1 2013 162.8 1.0%
1 2014 159.7 1.0%
2 2015 394.5 4.0%
2 2016 382.4 4.0%
2 2017 370.4 4.0%
3 2018 358.3 7.0%
3 2019 346.3 7.0%
3 2020 334.2 7.0%
4 2021 320.8 3.3%
4 2022 307.5 3.0%
5 2023 294.1 2.8%
5 2024 280.7 2.5%
6 2025 267.4 2.2%
6 2026 254.0 1.9%
7 CARB (2018a) p. 108
8 Each year, the Allowance Price Containment Reserve is divided into three tiers of the same quantity. Emissions allowances in each tier are sold for a fixed price. In 2013, the tier 1 price was USD 40, tier 2 USD 45, and tier 3 USD 50. The reserve tier price increases annually by 5% in addition to price inflation as measured by the consumer price index.
6 2027 240.6 1.5%
7 2028 227.3 1.0%
7 2029 213.9 0.6%
8 2030 200.5 0.0%
8 2031 193.8 0.0%
Source: California Code of Regulations, Title 17 Subchapter 10 Article 5 §95870, §95871
■ Advance Auction
Ten percent of the cap on emissions allowances is allocated to Advance Auction each year, where it is sold for the year in the year (CARB (2018a) pp. 149, 160, 218). Selling emissions allowances in advance through an auction has the advantage of raising expectations about the price of future emissions allowances and providing relevant information to market players. CARB expects that providing information on the price of future emissions allowances to market players will be pivotal in helping regulatory targets establish a long-term investment plan to reduce GHG emissions (CARB (2010a) p. Ⅸ-55).
■ Free allocations for manufacturers
Under California’s ETS, free emissions allowances are allocated to manufacturers as a form of transition assistance and to prevent carbon leakage (CARB (2010b) p. J-18). When the ETS is launched, some firms may suffer lower margins as they will be unable to pass on carbon costs due to competition with peers and imported goods. Margin squeeze may delay or deter these firms from investing in cost-effective GHG emission reduction, which indicates the possibility that imposing carbon costs under introduction of the ETS may hinder overall reductions in this area.
CARB allocates most emissions allowances that manufacturers need for free in the early stages of ETS implementation as a form of transition assistance to minimize margin squeeze from the imposition of carbon costs and facilitate investment to reduce GHG emissions. However, as shown in Figure 2-1, as regulatory targets adapt to carbon costs and engage in energy saving or low cost technologies over time, the level of free allowances allocated to manufacturers as transition assistance will gradually decrease (CARB (2010a) p. Ⅱ-26).
Meanwhile, manufacturers that are less competitive after the launch of GHG regulations and the ETS may choose to relocate their production facilities outside of California, where they would be free of such regulations.
In this case, GHG emissions will decrease in California, but will increase in the region where they relocate.
Increased emissions in the relocated region are known as “carbon leakage,” which impedes the reduction of emissions on a global level. AB32 calls for the introduction of regulations to minimize such carbon leakage. Accordingly, free allocations to prevent it will remain in place until the risk is removed as other regions put GHG regulations or carbon costs in place (see Figure 2-1).
Figure 2-1. Allocation of Emissions Allowances for Transition Assistance & to Prevent Carbon Leakage
Source: CARB (2010b) p. J-19
■ Free allocations for electricity firms and natural gas suppliers
Under California’s ETS, when it comes to electricity firms, first deliverers of electricity have the obligation to reduce GHG emissions and submit allowances. However, to protect consumers, free allowances are allocated to electricity distribution utilities providing electricity to the retail market. As first deliverers of electricity are allocated no allowances, they must purchase those they need at an auction or on the allowance market. Meanwhile, electricity distribution utilities receiving free allowances must consign them to an auction for immediate monetization.
Most retail electricity in California is supplied by investor-owned utilities (IOUs) and publicly-owned utilities (POUs). IOUs must consign all of their allocated free allowances to an auction for immediate monetization.
However, POUs may decide for themselves on the portion to be consigned to an auction and notify the government about it. That is, they may use a consignment auction to monetize free allowances like IOUs, and also use those allowances for compliance. Revenue from auctions can never be used for electricity distribution utilities, but only to benefit their consumers and reduce GHG emissions (CARB (2010a) pp. Ⅱ-28, Ⅱ-31-32).
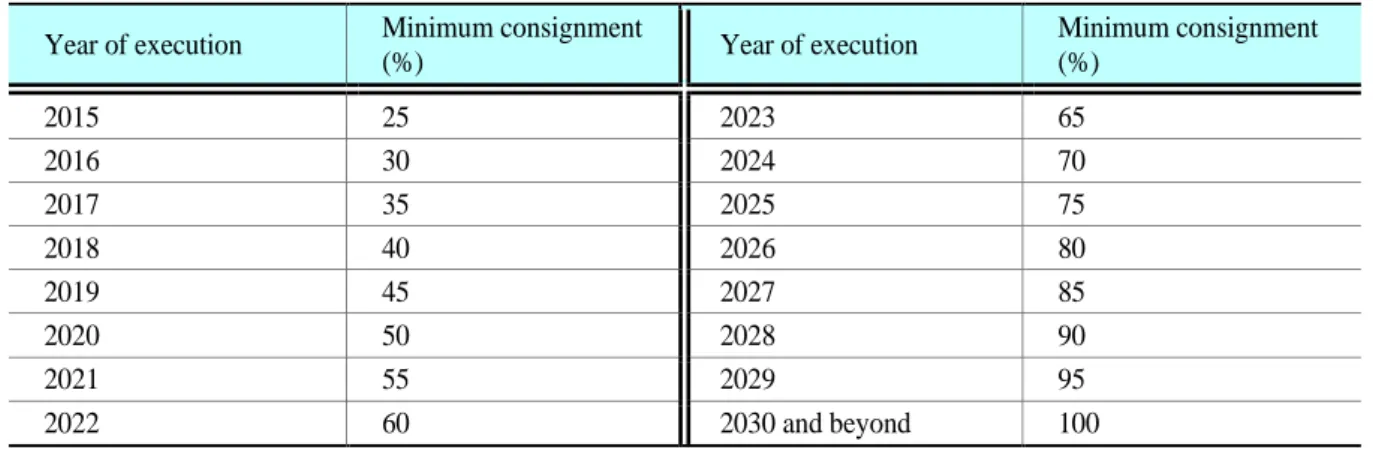
Free allowances are also allocated to natural gas suppliers for consumers. These suppliers must decide on the portion of free allowances to be consigned to auction for themselves, which must be at least a prescribed minimum level, and provide notification to the government (see Table 2-3). They are also obligated to monetize free allowances immediately through auction and use the revenue for consumer benefit (CARB (2018a) pp. 207-210).
Table 2-3. Minimum Allowance Consignment for Natural Gas Suppliers Year of execution Minimum consignment
(%) Year of execution Minimum consignment
(%)
2015 25 2023 65
2016 30 2024 70
2017 35 2025 75
2018 40 2026 80
2019 45 2027 85
2020 50 2028 90
2021 55 2029 95
2022 60 2030 and beyond 100
Source: California Code of Regulations, Title 17 Subchapter 10 Article 5 Table 9-5, Table 9-6
C. Consignment auction for electricity firms
This section will take a look at why a consignment auction is used for electricity firms, keeping in mind that.
the same logic may be applicable to natural gas suppliers. First deliverers of electricity may reflect marginal abatement cost in the bid price on the wholesale electricity market to pass on carbon costs. Thus, CARB decided not to allocate free allowances to first deliverers of electricity (CARB (2010a) p. Ⅱ-16).9
A rise in wholesale electricity rates due to carbon costs will lead to a rise in retail electricity rate for electricity distribution utilities, leaving consumers with a higher cost burden.10 CARB wanted carbon costs to be reflected in electricity rates to encourage investment in low carbon facilities and GHG emission reduction facilities and energy conservation. However, at the same time, it wanted to minimize the higher cost burden on consumers due to rate hikes.
9 This is based on the same logic that industries have become subject to free allocations as they are unable to pass on carbon costs due to competition with peers.
10 IOUs distributing most of California’s retail electricity are also under strict regulation from the California Public Utilities Commission (CPUC) over CAPEX, financing plans or retail electricity rates. However, CPUC also shares the perception that carbon costs should be reflected in electricity rates to reduce GHG emissions (CARB (2010a) p. Ⅱ-16).
Allowances issued under the ETS are traded on the market and have a market price. Thus, they can be seen as a product with a value, and allocation concerns: to whom the allowance value is distributed and how much. If the market functions normally and allowances are properly supplied to the market, the matter of who receives the allowances does not initially affect GHG emission reductions. However, the point is who has paid more of the cost to reduce GHG emissions.
Regarding the two issues facing CARB, allocating free allowances to consumers and letting them own the market value will ease their cost burden. However, in reality, since it is impossible to allocate allowances to all consumers, CARB allocates free allowances to electricity distribution utilities, mandating them to immediately monetize them via consignment auctions and use the revenue only to benefit consumers or reduce GHG emissions (California Code of Regulations, Title 17 Subchapter 10 Article 5, §95892).
Some may suggest that the State of California own allowances and press ahead with an auction without allocating them to electricity firms and that it deliver the revenue from the auction directly to consumers. However, as it does not have information on consumer electricity use, electricity rates or electricity costs, the State of California will have to turn to electricity distribution utilities with whom consumers are doing business directly, in order to return the allowance value to consumers. Hence, if allowances are not allocated to electricity firms and instead the State of California owns and auctions them off, unnecessary administrative steps will come about in the process of returning the revenue from the auction to consumers.
California’s electricity distribution utilities have achieved a certain level of vertical integration to own and operate their own power-generating facilities and power transmission and distribution facilities. Thus, many IOUs have an obligation to submit allowances for GHGs emitted in the power generating process. However, if free allowances are not allocated to electricity producers and only to IOUs owning power generating facilities, IOUs will have a competitive advantage in the wholesale electricity market. To prevent this, it is stipulated that all free allowances allocated to IOUs shall be monetized through auctions immediately.
D. Use of revenue from consignment auctions11
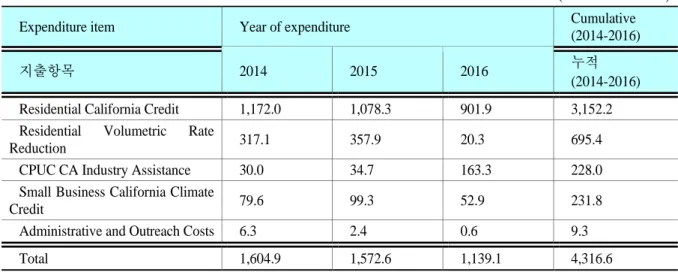
Each year, electricity distribution utilities are required to report to CARB how they used the allowance value they received in the previous year. This allowance value from 2014-2016 was used as follows:
1) Residential California Credit
The Residential California Credit is provided to all residential electricity users of IOUs twice a year. The remaining allowance value after subtracting the costs for uses to be introduced below is divided by the number of residential electricity users to disburse an equal amount of money to all such users. In 2014, USD 1.172 billion was paid to approximately 10.5 million households, while between 2014 and 2016, a total of USD 3.152 billion was paid to about 31.7 million households (see Table 2-4).
2) Residential Volumetric Rate Reduction
The Residential Volumetric Rate Reduction seeks to lower residential retail electricity rates to compensate consumers for costs rising from introduction of the ETS. However, as CPUC banned IOUs from using the allowance value to reduce retail electricity rates in December 2015, the expenditure for Residential Volumetric Rate Reduction dropped sharply in 2016. The 2016 expenditure refers to the unpaid or increased amount in 2015 (see Table 2-4).
3) CPUC CA Industry Assistance
CPUC CA Industry Assistance is a credit provided annually to facilities of emissions-intensive, trade-exposed industries. As the ETS sent electricity rates higher, the Assistance aimed at compensating firms for purchasing electricity, and was first paid out in 2016. In Table 2-4, CPUC CA Industry Assistance expenditure for 2014-2015 was actually paid in 2016. That is, for 2014-2015, the amount for this item was set aside and paid out in 2016.
11 This section summarizes CARB (2018b) pp. 3-9.
4) Small Business California Climate Credit
The Small Business California Climate Credit compensates small businesses for electricity rate increases due to the ETS. It is targeted at non-residential customers using less than 20 kW per month. In the early stages, it compensated for 100% of carbon costs added to the electricity rate, but CPUC plans to slash that percentage by 10% each year from 2015. The move is in line with the transition assistance for industrial facilities, aiming to compensate for initial margin squeeze and encourage investment in ways of reducing power consumption.
5) Administrative and Outreach Costs
Administrative and Outreach Costs return auction revenue to consumers, to cover energy saving-related outreach and education and administrative costs. In 2014-2016, a total of USD 9.3 million was used in this way (see Table 2- 4).
6) Clean Energy and Energy Efficiency Project
Up to 15% of each IOU’s auction revenue may be set aside for the Clean Energy and Energy Efficiency Project.
Until 2016, there were no expenditures for this project.
Table 2-4. IOU Use of Allowance Value
(Unit: USD million)
Expenditure item Year of expenditure Cumulative
(2014-2016) 지출항목 2014 2015 2016 누적
(2014-2016)
Residential California Credit 1,172.0 1,078.3 901.9 3,152.2
Residential Volumetric Rate
Reduction 317.1 357.9 20.3 695.4
CPUC CA Industry Assistance 30.0 34.7 163.3 228.0
Small Business California Climate
Credit 79.6 99.3 52.9 231.8
Administrative and Outreach Costs 6.3 2.4 0.6 9.3
Total 1,604.9 1,572.6 1,139.1 4,316.6
Source: CARB (2018b)
E. Purposes of consignment auctions for California’s ETS
The general purposes for consignment auctions are to secure a supply for auction through consignment and maintain market price discovery. Consignment auctions also serve to mitigate the cost burden of auction participants. The consignment auction mechanism for California’s ETS indicates that these purposes have been sufficiently fulfilled.
Figure 2-2 shows the supply and sales volume in allowance auctions in California from November 2012 to August 2018.
In phase I (2012-2013), a total of nine auctions were held, and a total of 162.0 million allowances (an average of 18.0 million allowances per auction) were supplied and sold.12 Eighty-eight percent of total supply or sales volume in the nine auctions was consigned by IOUs and POUs, with just 12.0% owned and c onsigned by the State of California. In auctions held in phase I, IOUs represented 73.3~94.0% of consigned supply, POUs 4.9~13.8% and the State of California 0.0~19.1% (CARB, 2018c).
Figure 2-2. Composition of Sources Allowances Sold in California’s Allowance Auctions
12 In phase I, the entire supply was sold in all auctions.
Source: Prepared by the authors using data from CARB (2018c)
공급 Supply
판매 Sales volume
위탁 Consignment
From the beginning of 2015 to August 2018, a total of 15 auctions were held (CARB, 2018c). Starting in 2015, regulatory targets were expanded to fossil fuel suppliers, who did not receive free allowances.13 As a result, the state-owned allowances as a percentage of total allowances increased, and the consigned supply share of total supply in auctions fell compared to phase I, but remained significantly high (see Figure 2-2).
In a total of 15 auctions, 961.7 million allowances (an average of 64 million allowances per auction) were supplied, and 824.4 million allowances (an average of 55 million allowances per auction) sold. Of the total supply, that consigned by IOUs and POUs accounted for 37.5% and the state-owned supply 62.5% (CARB, 2018c). In California’s allowance auctions, when sales volume is smaller than the supply, consigned supply is sold first. As bidding sales volume dropped below the total supply in a handful of auctions, the consigned supply share of total sales volume rose higher than its share of total supply.14 The supply consigned by IOUs accounted for 33.1% of total sales volume, that consigned by POUs for 5.7% and the state-owned supply for 58.6% (CARB, 2018c), (see Figure 2-2).
The portion of consigned supply in auctions declined from phase I, but still accounted for 25.5~53.2%, warranting the view that consignment still contributes significantly to the total supply in auctions.
We will now take a look at the market price discovery function of auctions based on the relationship between the allowance auction settlement price and the market price. Figure 2-3 shows California’s allowance auction settlement price and allowance futures price for December from November 2012 to February 2018. The first auction settlement price was slightly below the futures price, but subsequent settlement prices moved nearly in tandem with futures prices in the market. Assuming the futures price accurately reflects expectations on a product’s future price, auction settlement price moving in tandem with the futures price signals that the auction settlement price also fully reflects market expectations.
Figure 2-3. California’s Allowance Auction Settlement Price and Allowance Futures Price
13 Starting in 2015, regulatory targets were expanded to fuel suppliers to include for-transportation fuel combustion and fuel combustion in small- scale industrial facilities and all residential and commercial facilities.
14 The portions of consigned supply from IOUs and POUs of total supply cannot be confirmed as the relevant data is not broken down.
Source: Prepared by the authors using data from California Carbon Dashboard (2018) and CARB (2018c) (accessed on October 31, 2018)
Unit: USD
The biggest difference between the consignment auction mechanism of California’s ETS and ordinary consignment auction is who has their cost burden reduced. In an ordinary consignment auction where a participant corresponds to a consignor, the participant pays for the supply it bids for, and receives the revenue from the auction for the supply it consigns. Accordingly, depending on the volume of supply it bids for and consigns, it may actually spend less and even earn revenue.
When it comes to electricity firms only, first deliverers of electricity are key participants in consignment auctions for California’s ETS and electricity distribution utilities are allowance consignors (CARB (2010a) p. Ⅱ-16-18).15,16 As electricity distribution utilities own allowances, they receive revenue from consignment auctions. This means that a wealth transfer occurs from first deliverers of electricity to electricity distribution utilities.
However, electricity distribution utilities are not permitted to use the revenue for their own purposes, but must use it only to mitigate the cost burden on consumers or reduce GHG emissions. Thus, the revenue is transferred again from electricity distribution utilities to consumers. In this process, consumers are compensated for the increased cost burden arising from electricity rates hiking with introduction of the ETS.
All in all, consignment auctions as part of California’s ETS are a mechanism that reflects carbon costs to wholesale/retail electricity and natural gas prices and also alleviates the higher cost burden on consumers. The ETS was designed to reflect carbon costs in wholesale/retail electricity and natural gas prices to encourage investment in low carbon facilities or GHG emission reduction facilities and maintain an energy saving initiative.
However, a price rise associated with carbon costs means higher cost burden on consumers. Accordingly, California allocated free allowances to electricity distribution utilities and natural gas suppliers, which must immediately monetize them to return the value to consumers or use it for their benefit, to compensate them for the increased cost burden. Although electricity distribution utilities and natural gas suppliers are allocated free allowances, those allowances actually serve as a channel to return auction revenues to consumers.
15 Only electricity firms are covered here, but the same logic can apply to natural gas suppliers.
16 Some electricity distribution utilities that have accomplished vertical integration are obligated to submit allowances for GHGs emitted during their own power generation. However, they may not use allocated allowances for their own compliance, and must acquire them through an auction or on the market.
2. Current State of Korea’s Emissions Allowance Trading17 A. Outline of Korea’s ETS
After several years of preparation, Korea’s ETS launched in 2015 in line with the low carbon, green growth initiative. In May 2012, the Act on the Allocation and Trading of Greenhouse Gas Emission Permits took effect, and in November of that year, the Enforcement Decree to the Act was formulated. Under the Act, the Basic ETS Plan was established in January 2014, a year before introduction of the ETS. This is a mid-to-long term comprehensive ETS plan that covers 10 years and is established every five (Ministry of Economy and Finance, 2014). It encompasses the goal and operational direction, system for implementation, and supporting measures for domestic industries, prescribing the ETS as a key way to achieve the country’s goal of reducing GHG emissions. In September 2014, a specific allocation plan was set up for phase I, and in January 2015, Korea became the first nation in East Asia to introduce an ETS at the national level.
The enforcement period has been fixed for phase I to phase III of the ETS plan. Phase I is from 2015-2017 (three years), phase II from 2018-2020 (three years), and phase III from 2021-2025 (five years). The ETS targets firms with a three-year annual average GHG emissions of at least 125,000 tons or operations with at least 25,000 tons starting from four years prior to phase I. Targets can include firms applying for participation voluntarily irrespective of emission levels. There are six types of GHG that fall under the ETS, and are included in the Kyoto Protocol: CO2, CH4, N2O, HFCs, PFCs, SF6. The types include not only direct emissions arising from fuel combustion but also indirect emissions associated with the use of electricity or heat (Ministry of Economy and Finance, 2014). Albeit different from year to year, in July 2018, 591 firms and operations were ETS targets, with combined emissions representing about 68% of the country’s total (Ministry of Environment, 2018).
Allocations are basically divided into free allocations and charged allocations. During phase I, allocations are 100% free. During phase II, emission intensive and trade exposed (EITE) sectors receive 100% free allowances, but other sectors must purchase 3% through auctions. During phase III, the portion of charged allocations is expected to rise to at least 10% (Ministry of Economy and Finance, 2014). Free allocations are predominantly based on grandfathering, a practice of allocating them on the basis of past emissions, and benchmark allocations were executed for three sectors (cement, airline, refining) during phase I and for six sectors (phase I sectors plus power generation, district heating, waste management) during phase II (Ministry of Environment, 2018).
Banking was allowed without restriction within and between phases, but this changed between phase I and phase II, when it was prohibited as part of efforts to stabilize the market in April 2017. This will be explained later in detail. Borrowing within a phase is allowed, but borrowing from a subsequent phase is not. When the ETS was launched in 2015, the cap on borrowing was 10% of each year’s allocations. But in May 2016, with amendment to the enforcement decree, the cap increased to 20%, which was confined to phase I. In April 2017, the cap for phase II was revised up from 10% to 15%. During phase I, only the target entities were allowed to participate in trading, but since phase II, public financial institutions and other market makers were allowed to engage to promote trading and boost market liquidity (relevant Ministries, 2017).
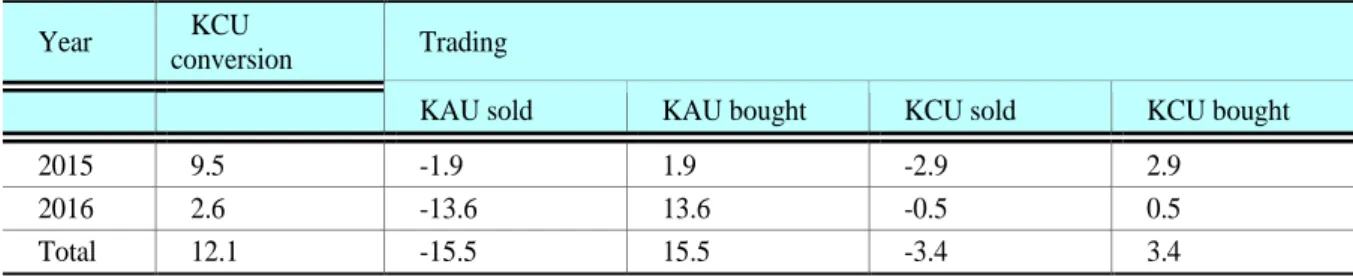
Under the Offset scheme, acquired allowances can be used for up to 10% of emissions. During phase I, the sources of supply for Korean Offset Credits (KOCs) were Certified Emission Reductions (CERs) occurring during Clean Development Mechanism (CDM) projects in Korea, or KOCs arising from external emission reduction activities undertaken by firms not subject to the ETS. Only CDM projects implemented since April 14, 2010 are acknowledged. In order for CERs and KOCs to be used for compliance, they must be converted to Korean Credit Units (KCUs). Starting in phase II, use of CERs arising from domestic firms’ participation in overseas CDM projects will also be allowed for up to 5% of each firm’s emissions. This ceiling is expected to increase to 10% in phase III (Ministry of Economy and Finance, 2014; relevant Ministries, 2017).
To report annual emissions for compliance, target entities must submit a GHG emission statement, verified by a verification institution, to the Ministry of Environment within three months from the end of the year of execution, or by the end of March of the following year. The Ministry of Environment must review and verify the reported
17 This section is based on reports from relevant Ministries (2017), Ministry of Economy and Finance (2014), Ministry of Environment (2018), and the Greenhouse Gas Inventory and Research Center of the Ministry of Environment (2018). It should be noted that as this section mainly deals with introduction of the ETS, in the same paragraph, the same citations are cited only once in the appropriate place for reader convenience, unless otherwise required.
emissions by the end of May and then notifies the relevant entity of the result. If there are no objections to the validated emissions, companies must submit allowances equivalent to those validated emissions through the allowance registration system by the end of June. If submitted allowances fall short of validated emissions, three times the average market price per ton of those emissions in the year of execution or KRW 100,000 per ton (whichever is smaller) will be imposed as a penalty (Ministry of Economy and Finance, 2014).
B. Emissions trading and allowance submissions
To examine domestic emissions trading volume and price trends, it is necessary to look at the types of domestic allowances. These allowances are classified into three types: Korean Allowance Units (KAUs), Korean Credit Units (KCUs), and Korean Offset Credits (KOCs) (Ministry of Economy and Finance, 2014). KAUs are allocated by the government to target entities according to their allocation plans. KCUs are converted from KOCs upon government approval. KOCs are credits acquired from an external or CDM project which can be converted into KCUs at any time.
Figure 2-4 was prepared in cooperation with the Korea Research Institute on Climate Change, which periodically collects floor trading data from the Korea Exchange and over-the-counter trading data from the Greenhouse Gas Inventory and Research Center, and shows emissions trading prices and volumes from January 2015 to mid-July 2018. The lines represent monthly average daily closing allowance prices, while the bars represent monthly cumulative trading volume. KAU1518 started trading at KRW 7,860/tCO2-eq on January 12, 2015 when the emissions allowance trading market opened, and despite fluctuations, advanced overall, with KAU17 climbing up to KRW 28,000 by mid-July 2018. Overall, KAU, KCU, and KOC prices remained similar, although KOCs, which can be converted into KCUs irrespective of the year of execution, remained modestly higher.
Figure 2-4. Allowance Prices and Trading Volumes
Source: Prepared by the authors in cooperation with the Korea Research Institute on Climate Change, which periodically collects floor trading data from the Korea Exchange and the over-the-counter trading data from the
Greenhouse Gas Inventory and Research Center
KAU 거래량(월간 누적) KAU trading volume (monthly cumulative) KCU 거래량(월간 누적) KCU trading volume (monthly cumulative) KOC 거래량(월간 누적) KOC trading volume (monthly cumulative) KAU 가격(월평균, 일종가, 원/tCO2-eq) KAU price (monthly average, daily closing,
KRW/tCO2-eq)
KCU 가격(월평균, 일종가, 원/tCO2-eq) KCU price (monthly average, daily closing, KRW/tCO2-eq)
KOC 가격(월평균, 일종가, 원/tCO2-eq) KOC price (monthly average, daily closing,
18 The number next to KAU refers to the year the allowance was allocated, while KAU15 indicates the allowance allocated in 2015.
KRW/tCO2-eq) 원/tCO2-eq) KRW/tCO2-eq)
In 2015, 1.24 million tons of KAUs and KCUs were traded intermittently, with prices hovering around KRW 10,000/ton. In 2016, these prices spiked to around KRW 20,000 by the end of June when the previous year’s allowances were settled, while trading volume increased to some 3 million tons in the first half of the year. Over the same period, as there was insufficient supply and prices continued to rise, the government amended its Enforcement Decree in May 2016 to expand the borrowing limit from 10% to 20% for phase I only (Digital Times 2016; Article 36 (2) of the Enforcement Decree to the Emissions Allowances Trading Act).
After the settlement of allowances for 2015, prices stabilized, but steadily increased. In February 2017, allowance prices skyrocketed to KRW 26,500 on tight supply. In March 2017, 27 companies grappling with insufficient allowances submitted a joint proposal calling for the government’s active intervention.19 In response, in April 2017, the government announced measures to stabilize the market, including limiting banking and adjusting the borrowing limit (relevant Ministries, 2017).
First, it limited banking from phase I to phase II to relieve the tight supply. Banking volumes in excess of a certain baseline were subtracted from allowances allocated for phase II. Ten percent of the annual average allowance for phase I is allowed to be banked, plus 20,000 tons.20 The government also made public that it would release its reserves, as necessary, and announced stabilizing measures for phase II, including adjusting the borrowing limit from 10% to 15%, acknowledging CERs from overseas CDM projects, promoting allowance auctions as planned, and allowing market makers to participate in trading (relevant Ministries, 2017).
Following the government’s stabilizing measures, allowance trading increased sharply, and prices stabilized in the low KRW 20,000 level. In the first half of 2017, allowance trading rose by about 10 million tons. After the settlement of allowances for 2016, allowance prices rose modestly, advancing to KRW 27,000 in July 2018. They had stabilized at KRW 24,000 as of December 6, 2018. In the latter half of 2017, some 4.4 million tons were traded, in contrast to the first half of 2017, when some 16 million tons were traded.
Figure 2-5. Yearly Allowance Trading Volumes: EU's ETS
Source: European Commission (2016), p. 5
19 Article dated March 7, 2017 in the Korea Economic Daily.
20 For example, when a company with one million tons of annual average allocations for phase I pushes ahead with 200,000 tons of banking from phase I to phase II, 80,000 tons (200,000 tons minus 100,000 tons (10% of annual average allocations) and an additional 20,000 tons) will be subtracted from allocations for phase II. Ten percent of annual average allocations were calculated by assuming that companies’ yearly emission changes for 2011-2016 were within ±10% and that it was necessary to provide flexibility to allow companies to respond to uncertainty over emissions controls.