Thermal inequality in the urban heat island: The vulnerable class near the industrial area. submitted to the Graduate School of UNIST in partial fulfillment of. requirements for the degree of Doctor of Philosophy of Science. The findings showed that (1) the existence of green buffers mitigated the thermal disparity between areas adjacent and not adjacent to old industrial areas.
INTRODUCTION
The industrial area that has factories and hazardous facilities was considered to discuss environmental justice issues. The aim of my study is therefore to analyze thermal inequality of the residential area according to the proximity and heat environment difference of the industrial area in the urban heat island.
LITERATURE REVIES .1 Urban heat island
Demographic and Social conditions to heat Vulnerability
Regional differences in heat sensitivity are determined by mixed physical, socioeconomic and demographic factors (Uejio et al., 2011). In contrast, high-income residents showed low thermal sensitivity due to improved or increased green spaces (Chow, W. T. et al. 2012).
Thermal inequity
As the following study, Jenerette et al. 2007) showed that urban temperature varies greatly depending on the social characteristics of neighborhoods. In other words, vulnerable groups have low access to ecosystem services, function and interest in green space, even if they live in the residential area with many natural green spaces (Schwarz, K. et al., 2015).

INTRODUTION
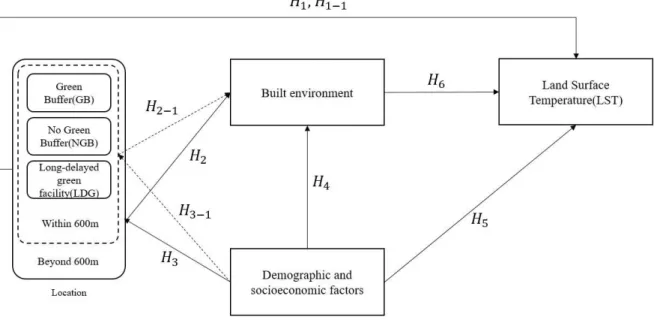
Thermal inequality of the residential area adjacent to the old industrial area in nine cities. Third, how do urban planning factors such as green buffers and long-delayed green facilities adjacent to the industrial area, thermal disparity between neighboring areas.
METHODS
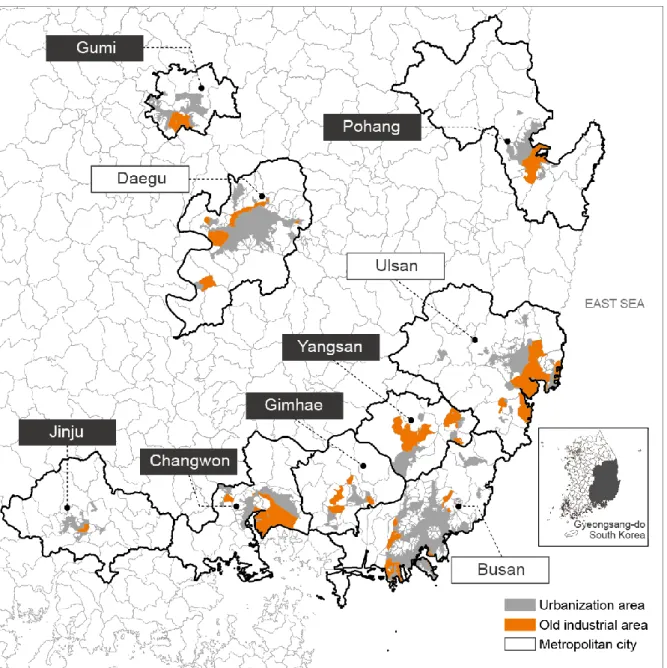
Study areas
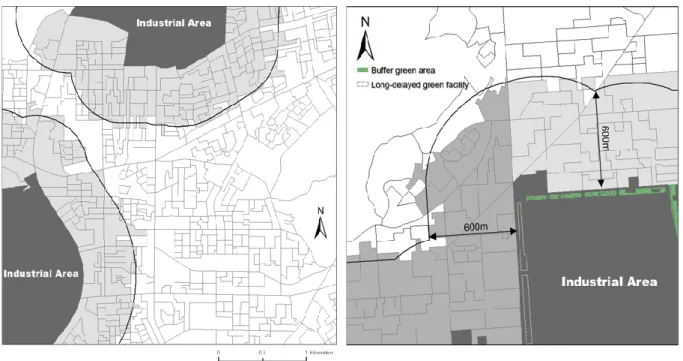
Here, the representative cities with general industrial complexes were Sa-sang, Shinpyeng and Jang-lim in Busan. Thus, this study only considered census production areas; these were urbanized areas away from old industrial complexes.
Site classification according to regional conditions
Finally, census production areas within industrial areas were excluded due to concerns that they might produce overestimated adjacent characteristics. These included the Census Output Areas adjacent to the Green Buffers (GBs), Neighboring Census Output Area to Non-Planned Green Buffer (NGB) and Neighboring Census Output Area to Long Delayed Green Facility (LDG).
Variables
The number of houses in each type was divided by the total number of houses in the census output area and calculated as a ratio. The calculated value divided by the total population of the census output area was then reprocessed as a ratio.
ANALYTICAL METHODS
Some variables were excluded from the PCA because they reduced the explanatory power of the model. The second factor was defined according to the ratio of the population over 65 years old and housing over 30 years old (vulnerable populations lived in old houses).
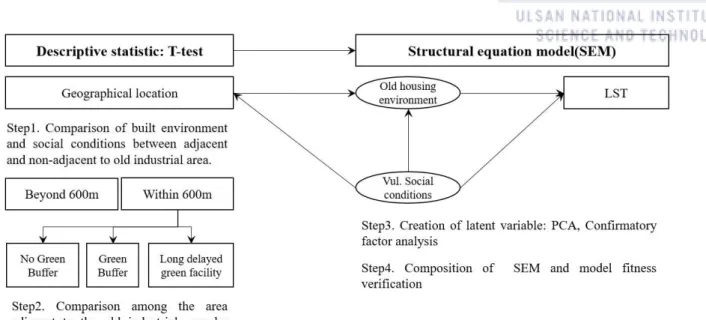
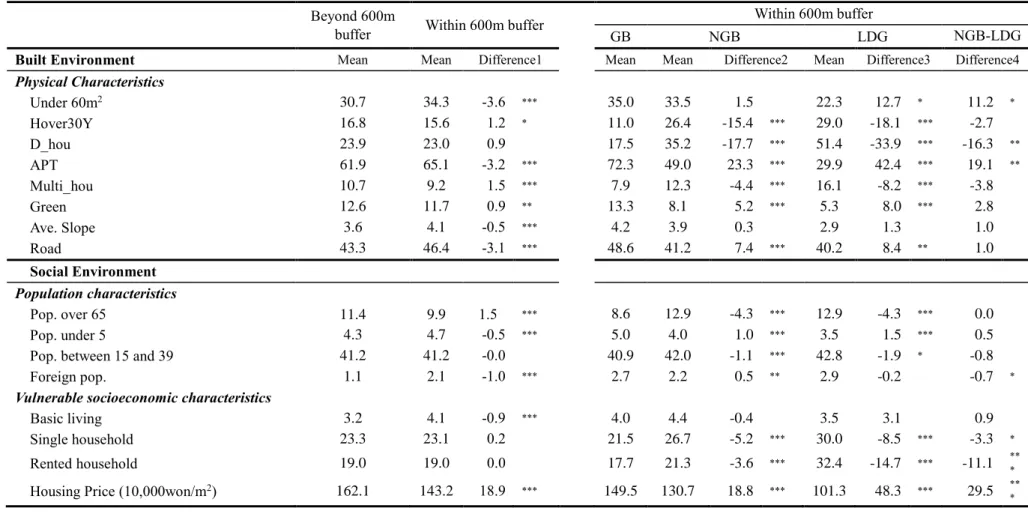
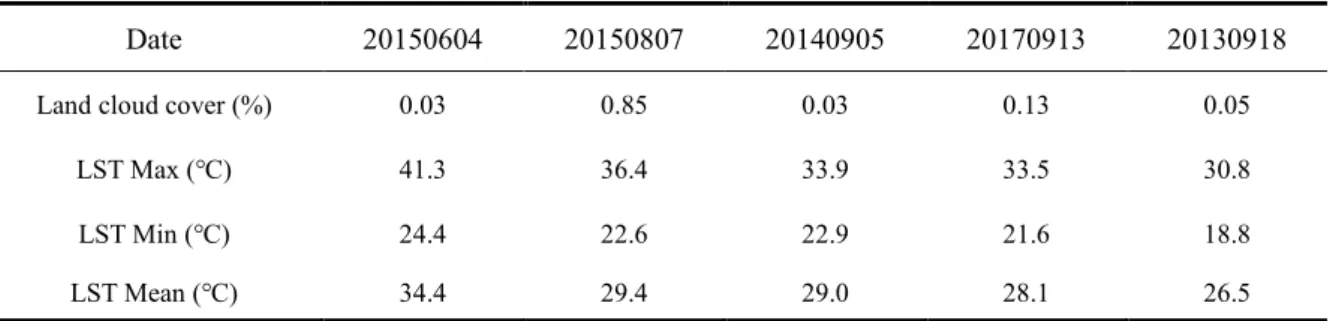
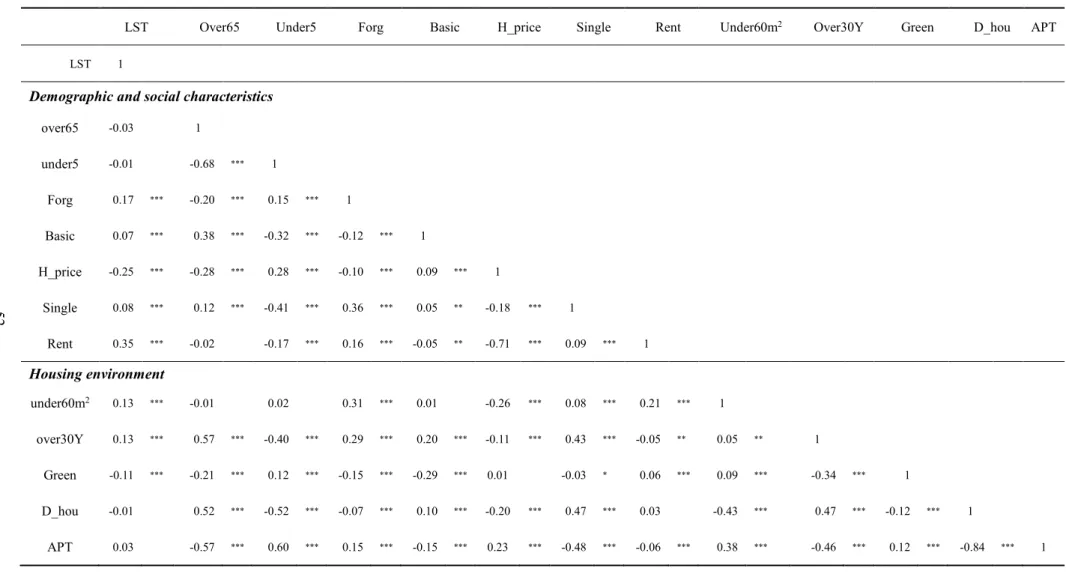
RESULTS .1 Descriptive statistics .1 Descriptive statistics
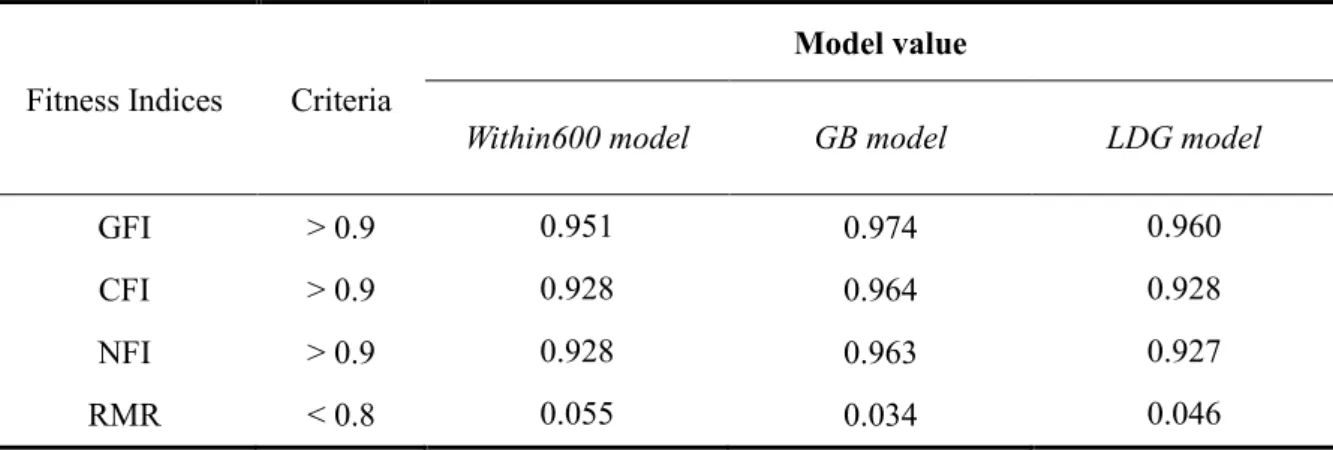
Goodness-to-fit indices for Structural Equation Model
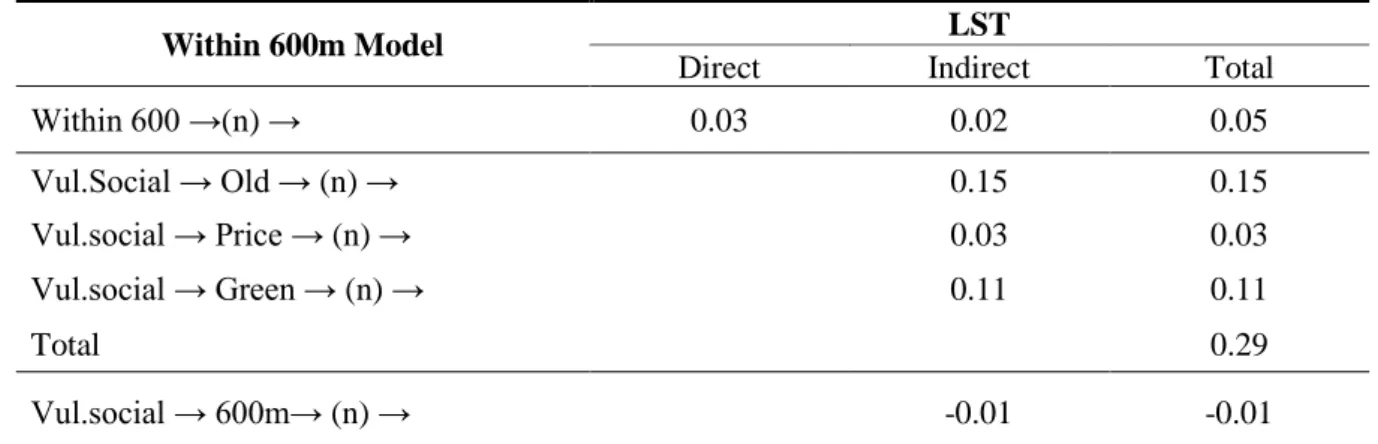
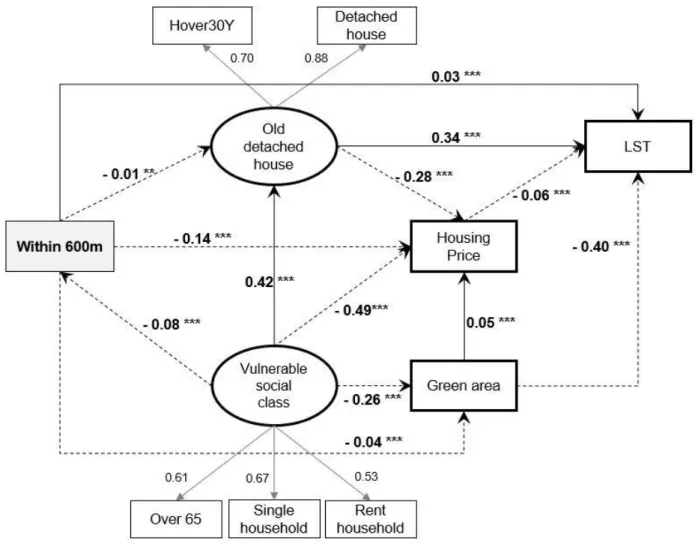
3.6, 3.7 and 3.8 show all model paths with measured correlations for the area next to industrial areas, protected green and long-term green facilities. The values of the coefficients of the models were normalized for easier intercomparison. A positive coefficient sign meant that the independent variable was directly modified by the dependent variable.
To verify the validity of the results of the SEM model and demonstrate the suitability of the model, Table 3.7 showed the results of evaluating the suitability of the model using five indices.
Results of Structural Equation Model
The areas adjacent to green buffers showed direct and indirect positive relationship with house price and green area. On the other hand, the areas adjacent to the green buffers showed a negative relationship with the old detached house. Moreover, the vulnerable social class lived more in areas that do not border green buffers.
As a result, the vulnerable social stratum was indirectly positive for LST in areas adjacent to the long-delayed green facility (Table 3.9).
DISCUSSION
The environmental benefits of the green buffers therefore appear to reduce thermal inequality between the adjacent and non-adjacent areas. The areas adjacent to the green buffers had lower LSTs than areas without green buffers. On the other hand, areas without green buffers or adjacent to the long-delayed green facility presented totally different environments.
It is also important to note that green buffers reduced the thermal disparity between adjacent and non-adjacent areas and the discriminatively constructed green plan.
CONCLUSION
Evaluation of thermal environments according to company size in old industrial complexes, taking into account industrial and built environments.
INTRODCUTION
Old industrial areas are more sensitive to rising temperatures due to poor physical conditions. The old industrial complex shows deterioration due to the division of land parcels into smaller areas and changing types of occupancy. Land prices have also risen because the old industrial complex borders the city center.
Which ratio has high LAST in EQBs located in the old industrial complex with vulnerable physical and socio-demographic characteristics in neighboring areas.
METHODS
Study area
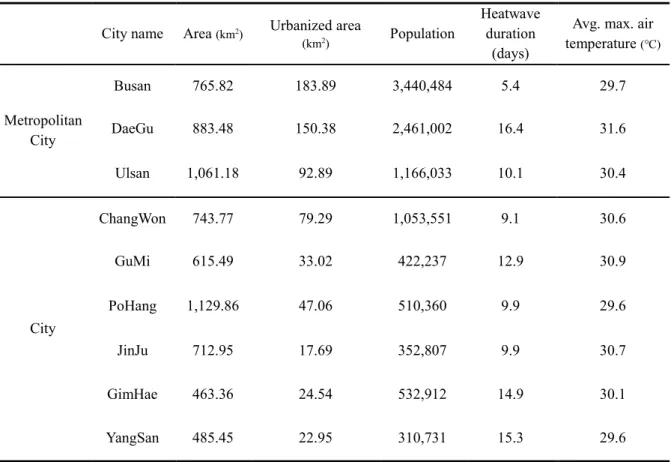
This study examined old industrial complexes adjacent to urbanized areas in Daegu, Busan, Ulsan, Gumi, Jinju, and Changwon. The Dyeing Industrial Complex in Daegu covers the smallest area (0.846 km²), while the Ulsan-Mipo Industrial Complex covers the largest area (48.444 km²). Daegu's Dyeing Industrial Complex had the smallest number of employees (5,639), while Changwon National Industrial Complex had the largest number (126,537).
Very small firms are present with high prices in the general industrial complex compared to the national industrial complex.
Analysis method and spatial analysis unit
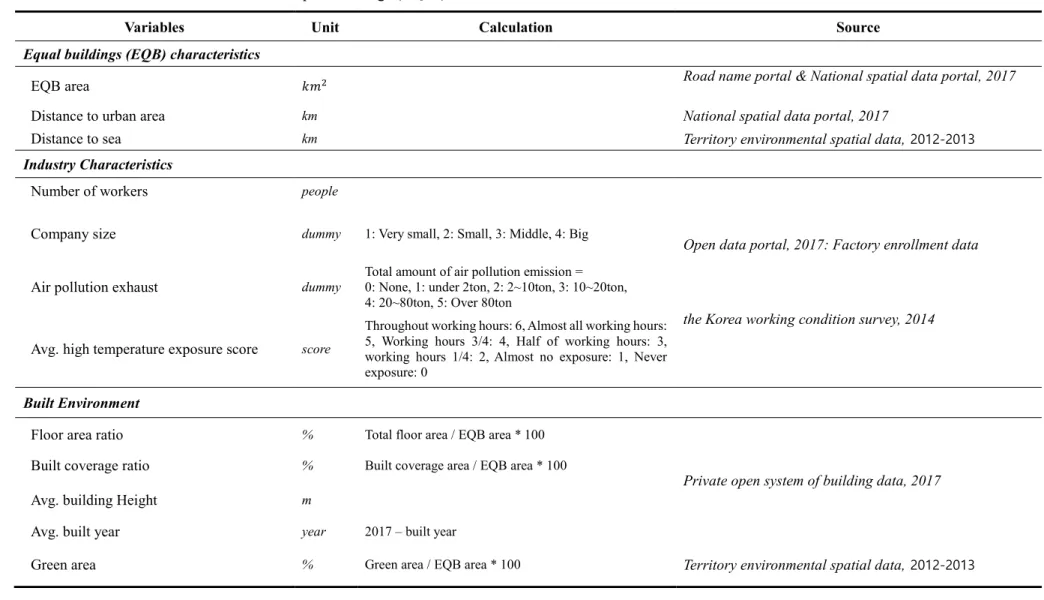
Variables
According to KWCS data, exposure levels to high temperatures are classified according to the level of exposure experienced during all working hours, half of all working hours and no exposure. However, these characteristics were averaged based on individual EQBs because many neighborhoods typically surrounded an EQB. Moreover, if the values were calculated on common averages, they were very likely to be underestimates.
For this reason, the neighborhood characteristics of areas adjacent to individual EQBs were calculated using Excel in weighted average values, taking into account their distance from a given individual EQB.
RESULTS .1 Descriptive statistics .1 Descriptive statistics
Result of Multiple Regression Model
In industrial characteristic, temperature exposure score showed a positive relationship with LST and air pollution discharge was not significant. In other words, the positive relationship between the high temperature exposure score and LST indicated that the worker's work environment was in a poor heat environment, both indoors and outdoors. In the building environment, as building coverage and construction year increased, LST decreased, while as total floor area and green area increased, LST decreased.
Compared to the very small company, the small company was about 0.2 ℃ lower and the medium company was about 0.3 ℃ lower.
Correlation between the LST of the EQB and adjacent areas
In the industrial characteristic, the higher the high temperature exposure score, the higher the LST, but the air pollution emission was not significant.
DISCUSSION
Different heat environments according to EQB area
For example, several very small firms showed relatively low LST because they occupied larger EQB areas. Very small companies rented factories at high prices because they could not afford their own (Song, J. 2008). Very small and small companies can thus carry out industrial activity in better environments.
Although large farms exhibit high LST, they do not appear to contain vulnerable heat environments.
Green space affects on company size
Thermal inequity in neighborhoods adjacent to EQBs with high LSTs
Areas adjacent to EQBs with high LSTs typically contained old or detached houses that were vulnerable to heat. They were adjacent to high heat sources, but showed high LST due to the difficulty of creating green areas in narrow outdoor spaces. This indicates that old detached houses in areas adjacent to old industrial complexes had a poor external heating environment.
It was difficult to explain why vulnerable social classes chose to live in areas adjacent to the EQB (e.g. factories) with high LSTs.
CONCLUSION
INTRODUCTION
The results of previous studies clearly show the effect of green areas on the thermal side. Previous studies have used LST data to analyze the effect of green space, so the spatial unit is broad. However, it is difficult to find a study on the thermal mitigation effects of green spaces at the microclimate level.
The aim of this study is to evaluate the thermal reduction effect of green buffers in the adjacent area of the old industrial complex at the micro level.
METHODS
- Study site and measurement days
- ENVI-met v4.0 model
- Simulation configuration
- Simulation scenarios
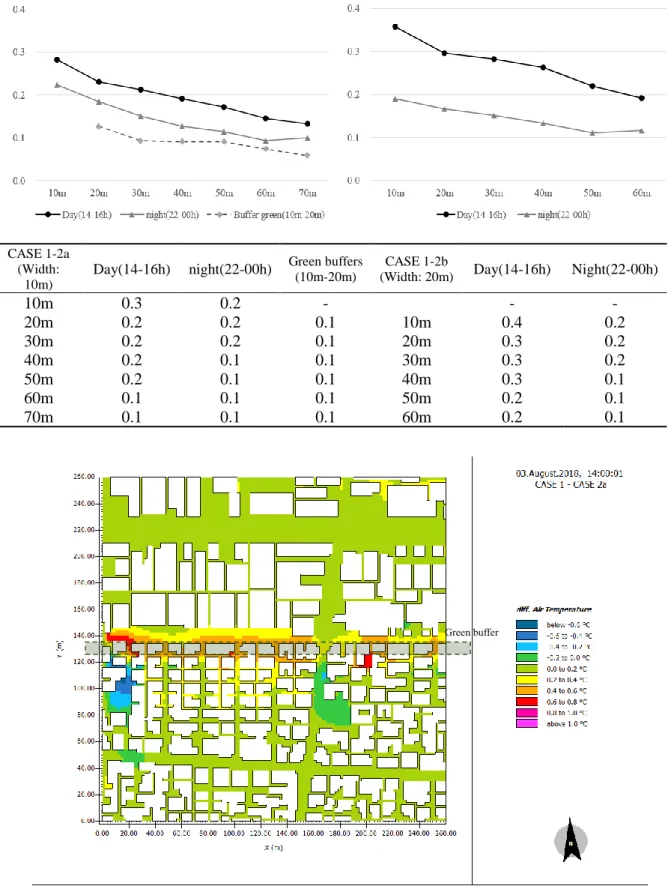
In this study, stainless steel was considered as the material of the factory building, and the wall and roof color was applied to light gray and blue color. This study is applied to the scenarios based on the status of the green buffers studied in the previous study. The difference between Ta, Tmrt and PET between Case 1 and Case 2 shows the thermal damping effect of the green buffers.
A wind direction of 340 degrees, which is downwind of the industrial district, is applied to the model to analyze the thermal effects of the factory.
RESULTS
ENV-met model validation
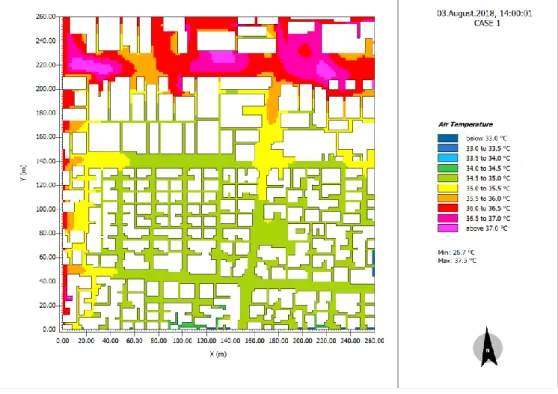
Microclimate of current site configuration
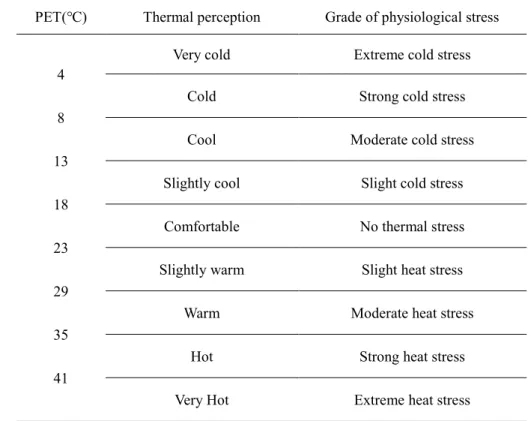
The Ta value of the N-S street canyon in the residential district at night was analyzed to be 30.7 °C, indicating that the tropical night phenomenon occurred. The average Tmrt of the W-E street canyon is 58.8 ℃ which is significantly higher than the N-S street canyon (average 40.9 ℃). The weekly average PET of the W-E street canyon is 44.6 ℃, which represents a "very hot" degree of thermal perception by PET classification.
On the other hand, the weekly average PET of the N-S street canyon is 37.5 ℃, which belongs to the "warm" degree of thermal perception by the PET classification standard.
Green buffer zone effect
The R1_W-E oriented street canyon showed the largest temperature-reducing effect due to the canopy effect caused by the formation of green buffers. This street was relatively far away from the green buffers compared to the R1_W-E oriented street canyon, so the effect of temperature reduction was minimal. The R3_W-E oriented street canyon had an average higher Tmrt and PET value than the N-S street canyon, but the temperature drop was similar.
For the road canyon with R1_W-E orientation closer to the green covers, the average Tmrt increased by 2.0 °C and the average PET increased by 0.7 °C.
DISCUSSION
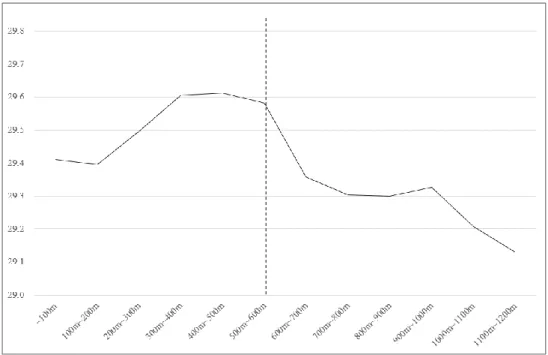
As a result of this study, the reduction effect of Ta is shown up to 70m from green buffer zone. As the width of the green buffer zone expanded, the reduction effect intensity increased slightly due to the overall weather condition change at the site. The closer to the green buffer zone, the difference between RF for point increased.
Nevertheless, this study showed that green buffers contributed to the reduction for Ta in the backward residential district.
CONCLUSION
SUMMARY AND CONCLUSION
Third, the areas adjacent to old industrial complexes are located in thermal inequality due to not only the internal but also the external conditions. Second, thermal inequality is determined by the planning factor rather than simply being located close to the industrial area. Therefore, a plan that reduces the thermal inequality should be implemented through the link to the old industrial area rather than a single environmental improvement of the residential area adjacent to the old industrial area.
Moreover, my thesis found that geographical conditions such as the proximity of the old industrial complex are associated with the social conditions as well as thermal inequality.
People, landscape and urban heat island: dynamics under neighborhood social conditions, land cover and surface temperatures. Impacts of urbanization on the thermal behavior of new built environments: A scoping study of the urban heat island in Bahrain. The role of local land use on the urban heat island effect of Tel Aviv as assessed from satellite remote sensing.
A study of the direct and indirect effect of urban compositional elements on heat or energy consumption in cities.
ACKNOWLEDGEMENTS