In the first essay titled "Risk Season: CEO Birth Season and Corporate Risk Taking," we provide new evidence on the relationship between CEOs' personal risk-seeking preference and corporate risk taking . Our findings support the notion that inherent personality traits of CEOs have important implications for corporate risk taking. In the second essay titled "Co-opted Boards and Stock Price Crash Risk," we investigate the relationship between co-opted boards and the risk of a stock price crash with a large sample of U.S.
Further analyzes show that the effect of co-opting on stock price downside risk increases when CEOs are more concerned about their careers. Overall, our findings suggest that board participation appears to reduce the effectiveness of board monitoring and that the role of board monitoring is particularly important when the CEO has a stronger incentive to withhold negative information.
The Season of Risk: CEO Season of Birth and Corporate Risk-taking
Introduction
In summary, the literature suggests that winter-born males are more likely to be in early embryonic development during the season with the longest day length, thus starting life with higher natural-born testosterone levels. Interestingly, we also find that the positive relationship does not hold for winter-born CEOs from areas near the polar regions. Third, to test whether our measure of winter-born CEOs simply increases their overconfidence, we include measures of CEO overconfidence in the regressions and find that our findings remain unchanged.
We find that the winter-born CEOs increase firm risk through both financial and investment policies. Taken together, our findings with the new measure of CEO masculinity strongly support our main conjecture that winter-born CEOs exposed to the highest levels of prenatal testosterone increase overall firm risk.
Hypotheses Development
Data, Variable Construction, and Descriptive Statistics
- Sample
- Variable Constructions
- Dependent Variable: Measuring Firm Risk
- Main Explanatory Variable: Measuring CEO Natural-Born Risk-Seeking Preference
- Control Variables
- Descriptive Statistics
If the CEO is born during October to February in the Northern Hemisphere or born during April to August in the Southern Hemisphere, we define him as the winter-born CEO. Thus, the dummy variable 𝑊𝑖𝑛𝑡𝑒𝑟𝑡 indicates the existence of a winter-born CEO in office at time 𝑡. Panel B tabulates the frequency of firms with winter-born CEOs by Fama and French 12 industry classifications.
Firms with winter-born CEOs are significantly younger and smaller than those without winter-born CEOs. For CEO characteristics, we find that winter-born CEOs tend to be younger than non-winter-born CEOs.
Main Results
- Effect of Winter-born CEOs on Firm Risk
- Robustness Checks
- Alternative Measures and Specifications
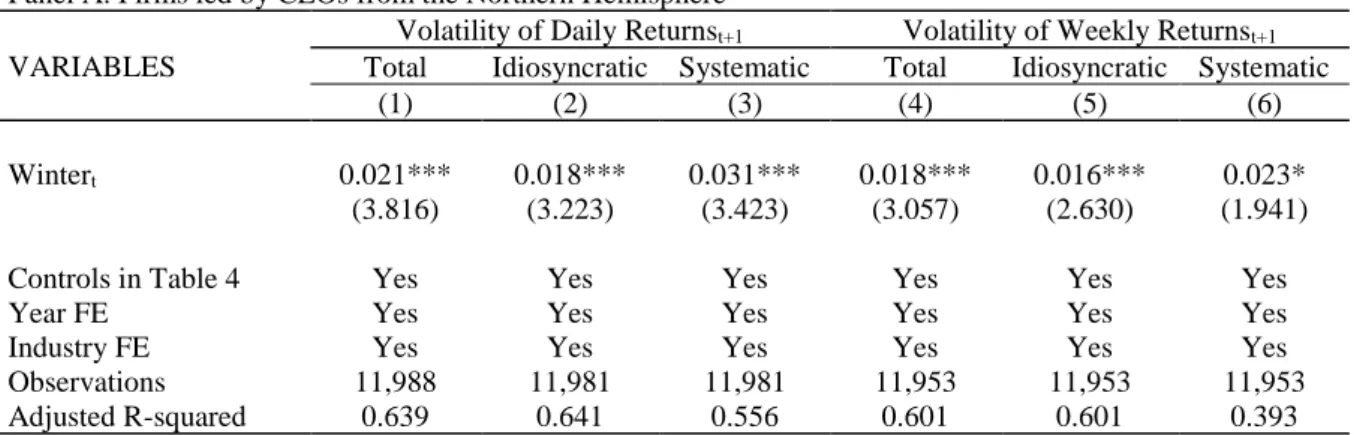
- Winter-born CEOs in Different Hemispheres
- Effect of Winter-born CEOs by Latitude of Birth
- Endogeneity Concerns
- Heckman Two-step Correction for Potential Selection Bias
- Omitted Firm Characteristics: Controlling for Firm Fixed Effects
- Propensity Score Matching (PSM) Procedure
- Coefficient Stability Test
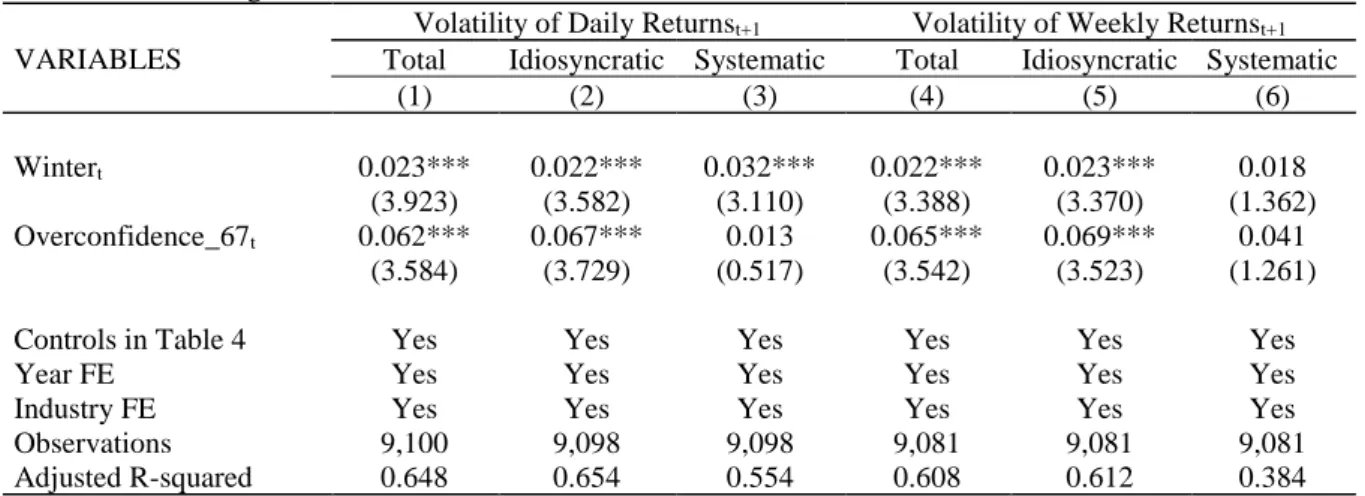
- Controlling for CEO Overconfidence
- Winter-born CEOs and Corporate Policies
- Winter-born CEOs and Financial Policies
- Winter-Born CEOs and Investment Policies
- Winter-born CEOs and Compensation Vega
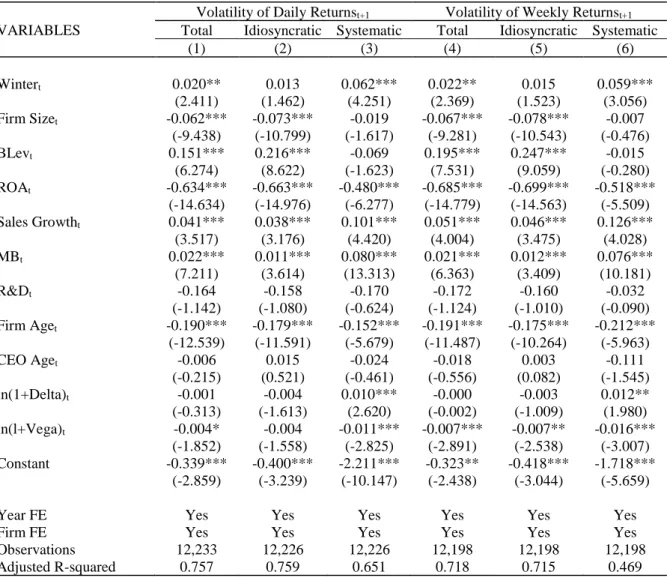
However, we find that the positive effect of winter-born CEOs on firm risk does not hold for firms with winter-born CEOs from near polar regions (𝑁𝑒𝑎𝑟_𝑃𝑜𝑙𝑎𝑟𝑡= 1). The interaction terms, 𝑊𝑖𝑛𝑡𝑒𝑟𝑡× 𝑁𝑒𝑎𝑟_𝑃𝑜𝑙𝑎𝑟𝑡, are negatively or insignificantly related to risk measures, suggesting that the risk-enhancing effect of winter-born directors from polar regions is attenuated. As shown in Table 8, the effect of winter-born CEOs on firm risk remains consistent after controlling for firm fixed effects.
The results imply that the observed association between winter-born CEOs and firm-specific risk is unlikely to be driven by unobservable time-invariant firm characteristics. More importantly, the effect of winter-born CEOs on firm risk persists after controlling for overconfidence in all columns. These findings suggest that the effect of winter-born CEOs on firm risk is uniquely separable from the effect of overconfidence.
In this section, we investigate the channels through which winter-born CEOs affect firm risk. We test whether firms with winter-born CEOs exhibit significant differences in leverage decisions. Consistent with our prediction, we find significant relationships between winter-born CEOs and debt maturity structure.
We then investigate the effect of winter-born CEOs on the rate of investment in tangible assets. We conclude our empirical analyzes by investigating the relationship between winter-born CEOs and compensation structure. Panel B reports the number of firms with winter-born CEOs according to the Fama-French 12 industry classifications.
We perform t-tests (Wilcoxon-Mann-Whitney tests) to test for differences in the mean (median) between firms with and without winter-born CEOs. In this table, we examine whether winter-born CEOs increase firm risk with subsamples split on the basis of CEOs. In this table, we examine whether the association between winter-born CEOs and firm risk depends on the CEOs' latitude of birth.
This table examines the relationship between winter-born CEOs and firm risk, after controlling for CEO overconfidence measures.
Conclusions
Co-opted Boards and Stock Price Crash Risk
Research Design
- Construction of the Sample
- Variables
- Dependent Variables
- Main Variables of Interest: Co-option Measures
The co-optation data calculated using the ISS database are from Coles et al. We then match the ISS data to measures of one-year crash risk estimated from weekly returns from the Center for Research in Security Price ( CRSP). In constructing all variables used in our analyses, we remove observations with missing firm-specific accounting information in the Compustat annual files and missing information on stock returns and trading volumes in the CRSP data.
Finally, we estimate the firm-specific weekly return for firm j in week w, 𝑅𝑗,𝑤, by taking the logarithm of one plus the firm-specific residual return (i.e. 𝑅𝑗,𝑤 = ln (1 + 𝜀𝑗,𝑤)) . The first measure of stock price crash risk, 𝑁𝐶𝑆𝐾𝐸𝑊𝑡, is defined as the negative coefficient of the third moment of the firm-specific weekly returns in a fiscal year, scaled by the standard deviation of the firm-specific weekly returns raised to the third power. To be specific, for each firm 𝑗 in fiscal year 𝑡, it is calculated as follows:. where 𝑛 is the number of observed firm-specific weekly returns in fiscal year 𝑡.
The second measure of stock price crash risk, 𝐷𝑈𝑉𝑂𝐿𝑡, is defined as the downside volatility of the crash probability. For each firm j, we classify all weeks in fiscal year 𝑡 into two subsamples: i) “down” .. weeks in which firm-specific weekly returns are below the annual average; and ii) “up” weeks when company-specific weekly returns are above the annual average. Finally, we calculate the firm-specific 𝐷𝑈𝑉𝑂𝐿𝑡 by performing a log transformation of the ratio of the standard deviation of “down” weeks to the standard deviation of.
The standard measure of board option, CO-OPTIONt–1, is calculated as the number of directors elected after a CEO has taken office, scaled by the number of all board members at t – 1. As an alternative measure of board option, we also use tenure-weighted co-option (TW CO-OPTIONt–1) to account for the probability that co-option can be enhanced when co-opted directors work with a CEO for a long period of time. Both metrics range from 0 to 1, and higher values indicate greater cooperation from the board.
Empirical Analyses
- Descriptive Statistics
- Main Regression Analysis: Effect of Co-opted Boards on the Stock Price Crash Risk
- Endogeneity
- Additional Evidence: Co-opted Boards, Information-withholding Incentives, and Stock Price
- CEO Age
- Product Market Competition
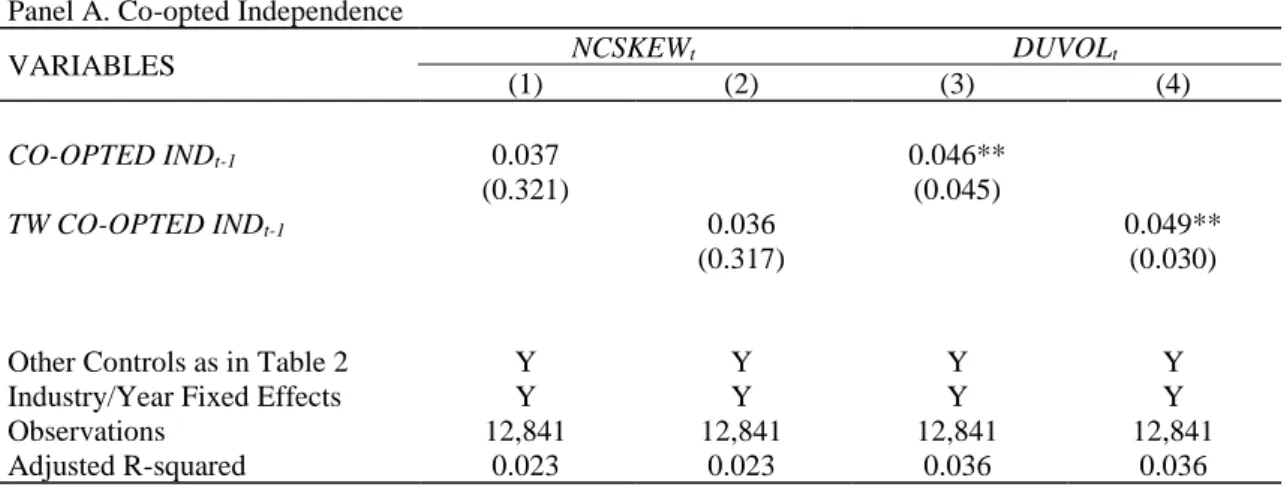
- Co-opted Independent Directors versus Co-opted Non-independent Directors
In this section, we examine the effect of co-opted boards on the risk of a stock price crash. Models (1) and (3) report the coefficients for our standard measure, CO-OPTIONt–1 , and models (2) and (4) provide the coefficients for the tenancy-weighted co-option measure, TW CO-OPTIONt–1 . This implies that the magnitude of the co-directors' effect on the risk of a crash is economically meaningful.
Based on this comparison, the change in co-option has an impact of about one-third that of the variation in 𝑀𝐵−1 on the risk of a stock price crash. Our basic analysis so far shows that the risk of a one-year-ahead stock price crash is a function of the board's option. Reverse causality may arise from the dependence of the current value of the option on the current and/or past values of the stock price crash risk in the presence of unobservable firm effects.
In this section, we examine the channels through which elected boards increase the risk of stock price crashes. In this table, we investigate whether board co-option increases the risk of future stock price crashes. Models (1) and (3) use the standard option measure (CO-OPTIONt-1), estimated as the percentage of directors appointed after the CEO takes office, while Models (2) and (4) use a mandate-weighted measure of co-option (TW CO-OPTIONt-1), measured as the sum of mandates of co-opted directors, scaled by the sum of mandates of all board members.
Model (1) and (3) use the standard measure of co-option (CO-OPTIONt-1), measured as the proportion of directors appointed after the CEO took office, while Model (2) and (4) use a tenure take service weighted co-option measure (TW CO-OPTIONt-1), estimated as the sum of the tenures of co-opted directors scaled by the sum of the tenures of all board members. Influence of co-opted directors on future stock price crash risk based on propensity score matching. Model (1) and (3) use the standard measure of co-option (CO-OPTIONt-1), defined as the proportion of directors appointed after the CEO took office, while Model (2) and (4) use a tenure of office. weighted co-option measure (TW CO-OPTIONt-1), defined as the sum of the tenures of co-opted directors scaled by the sum of the tenures of all board members.
Model (1) and (3) use the standard measure of co-option (CO-OPTIONt-1), defined as the proportion of directors appointed after the CEO took office, while Model (2) and (4) use a tenure of office. weighted co-option measure (TW CO-OPTIONt-1), defined as the sum of the tenures of co-opted directors scaled by the sum of the tenures of all board members. Panel A tests the impact of co-opted independent directors (CO-OPTED INDt-1 and TW CO-OPTED INDt-1), while Panel B examines the influence of co-opted non-independent directors (CO-OPTED NON-INDt-) 1 and TW CO-OPTED NON-INDt-1 ).