Uncertainty quantification in heat and fluid flows around staggered Pin-Fin arrays based on hybrid RANS/LES model. In the current work, the three-dimensional heat and fluid flows around staggered pin-fin arrays are predicted using two Hybrid RANS/LES, Improved Delayed Detached Eddy Simulation (IDDES) and Stress Blended Eddy Simulation (SBES) and one transitional Unsteady Reynolds Averaged Navier-Stokes (URANS) model, k- SSTLM. Two hybrid RANS/LES results show superior prediction in mean velocity profiles around pins, pressure distributions on the pin wall and Nusselt number distributions.
The effect of switching the mixing function between RANS and LES mode of two hybrid RANS/LES models is investigated. Keywords: scaled pin-fin array, Enhanced Delayed Decoupled Simulation (IDDES), Eddy Mixed Stress Simulation (SBES), Hybrid RANS/LES, k-ω SSTLM, Uncertainty Quantification (UQ), Extension of polynomial chaos, Latin hypercube sampling (Liteni). MSD Modeled Stress Depletion PCE Polynomial Chaos Expansion PCE PDF Probability Density Function SBES Stress Blended Eddy Simulation SRS Scale Resolving Simulation SSL Separate Shear Layer.
Introduction
However, they demonstrated a limitation of stable k-ε turbulence models, which failed to capture unsteady vorticity in staggered pin arrays. A study by Hao and Gorle [7] adopted a pin-fin array based on LES and k- SST model to perform a preliminary screening of the selected RANS model considering the Reynolds stress tensor discrepancies. A stochastic heat transfer prediction method based on LES and steady RANS was developed by Carnevale et al. applied to flow in a channel with pin-fin arrays [8].
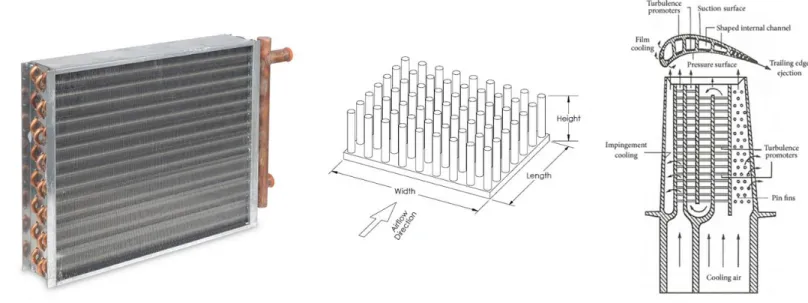
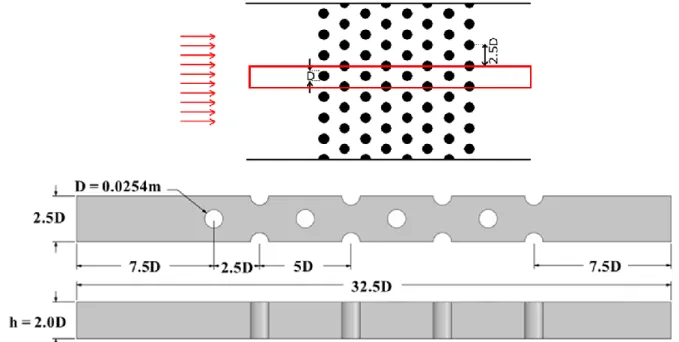
In this work, heat and fluid flows around staggered pin-fin arrays are investigated using two hybrid RANS/LES models, IDDES and SBES, and a transition model. The adopted geometry is staggered pin-fin arrays [4], which is a well-known benchmark problem for evaluating heat transfer phenomenon and the Reynolds number based on the pin diameter and the velocity between the pins is equal to 10,000. We attempted to evaluate the predictive capabilities of two hybrid RANS/LES and one URANS models in convective heat transfer properties and flow around pin-fin arrays.
Numerical Method
Governing Equation
Turbulence Models
- k-ω SSTLM
- Improved Delayed Detached Eddy Simulation (IDDES)
- Stress Blended Eddy Simulation (SBES)
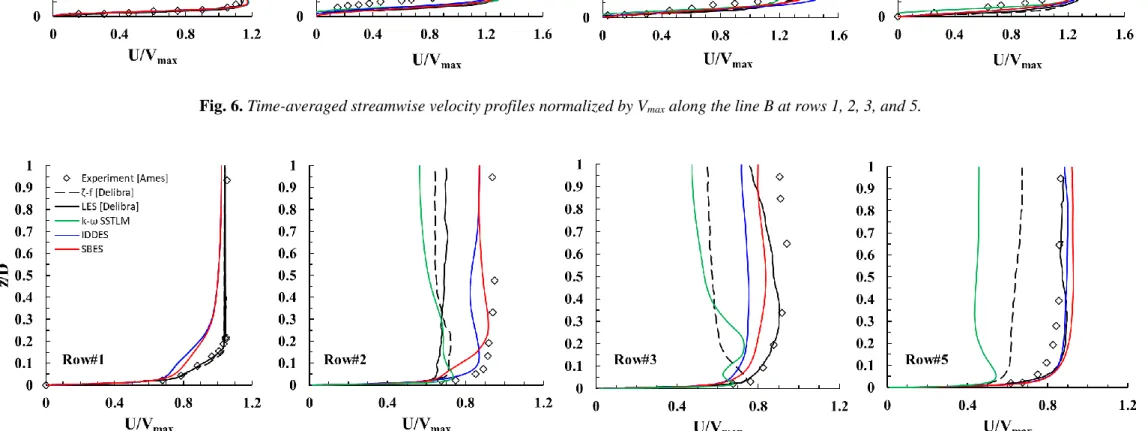
Where ∆ is the LES length scale and ℎ𝑚𝑎𝑥 is the maximum cell edge length. In the first row, all the simulation results agree well with the experimental data. The predictions of the two hybrid RANS/LES models in the present work are between the results of the two LES models.
However, there is a somewhat large discrepancy in the prediction of the k- SSTLM model, especially in the post-separation region. 22] However, there are still large discrepancies in the other pins, which show similar behavior to the results of the -model.[22]. 4 summarizes the average endwall Nusselt numbers of the considered models and the reference data.
12 shows contours of Nusselt number normalized by average endwall Nusselt number in the upstream region (A) and downstream region (B) of the experiment. The upstream min, max and downstream min, max Nusselt numbers in all the models are the same as in the experimental data presented by Ames. 3] The Nusselt number is relatively low near the inlet and high in the region of the leading edge.
In front of the first stick, the LES calculation changes faster in the SBES model than in IDDES. In the computational domain of this work, a total of 12 cylinders (4 cylinders at the centerline and 8 half-cylinders in the periodic plane) experience adverse pressure gradients in the rear part (about θ > 90º) of each cylinder. Histogram of the local Nusselt number along the center line depending on the input random distribution.
The results of the k-ω SSTLM model are similar to those of another URANS model, the ζ-f model [5], with large deviations in a separate region.
Discretization scheme and Coupling algorithm
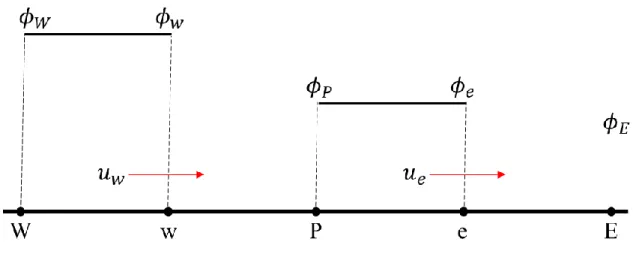
- Upwind scheme
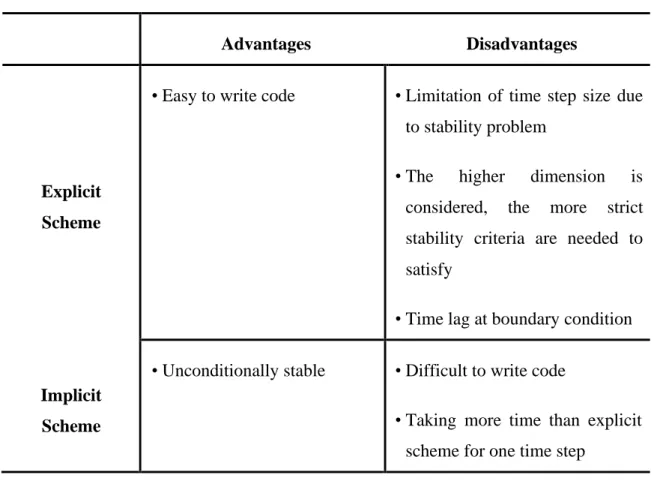
- Implicit discretization
Theorical Background for Uncertainty Quantification
The Definition of Uncertainty Quantification
Uncertainty quantification is the mathematical method that deals with quantitative characterization and reduction of uncertainties in applications. Uncertainty quantification is used for robust design/optimization, model validation and certification for high-risk decisions.
Polynomial Chaos Expansion
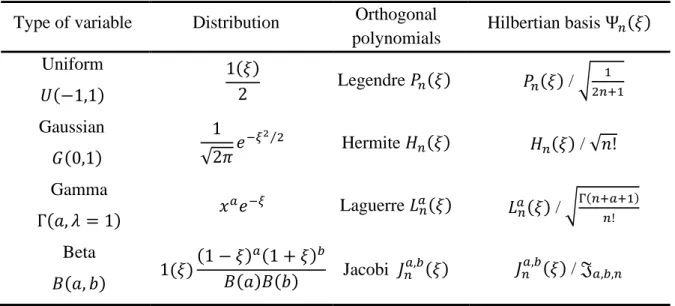
Applying the assumption that the output variable has a finite variance, equation (3.2) is modified as follows. These correspondences between the distribution of random variables and the orthogonal polynomial family are shown in Table 2. If the samples greater than 𝑃 + 1 are chosen, the overdetermined system of equations must be solved using the least squares method.
Sampling Method
Deterministic Simulations for Staggered Pin-Fin Arrays
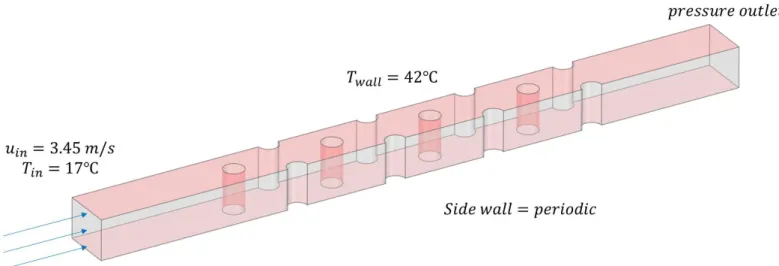
Geometry
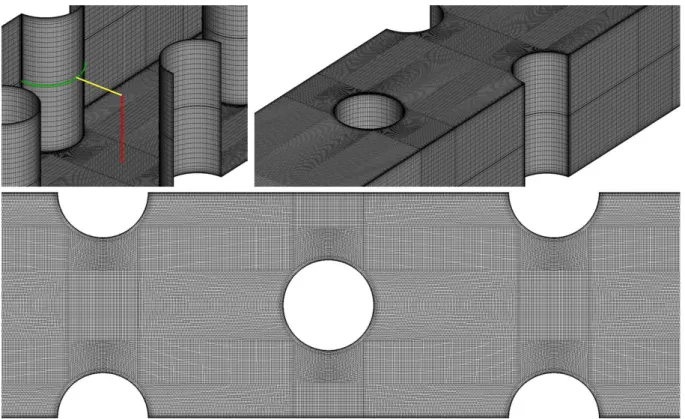
Grid
Boundary Conditions
7] The periodic boundary conditions are applied to both side faces, and the pressure outlet conditions are at the outlet. At the head wall and pin wall, the same constant temperature condition is applied as in Delibra et al. The temperature difference ΔT (ΔT = Twall-Tin ) between the inlet temperature Tin and the wall temperature Twall is set to 25 K.
Results
- Grid Test
- Velocity Profile
- Pressure Coefficient Around The Cylinder
- Nusselt Number Distribution Around The Cylinder
- Pin Nusselt Number Distribution
- Local Nusselt Number Distribution
- Average Nusselt Number
- Nusselt Number Contour
- Q-Criterion
- Turbulence Structure
- Blending Function
In addition, the differences between the coarse and fine grids are about 8.2% and 7.2% in the IDDES and SBES models, respectively, which means that the grid dependence is greater in IDDES than in SBES. In the other rows, the two RANS/LES hybrid models agree well with the LES results (row 5) and the experimental data (rows 1, 2, and 3), but the -f. In the second row, IDDES and SBES show velocity magnitudes similar to the experimental data, but URANS and LES models show a smaller velocity.
In the third row, the SBES result is closer to the LES results and the experiment data than the IDDES and other URANS models. Each model shows consistent predictions of the pressure coefficient at the first and second rows, but there are some differences in the other two rows. In the present work, the SBES model shows predictions closest to the reference data, and the two LES models and the k- SSTLM model have patterns similar to the -f model by Delibra et al.
The LES model by Hao and Gorle [7] best predicted this coefficient in the fifth row, although that model had the slowest pressure recovery (with a maximum difference of 13%) among all the models considered in this work The IDDES and SBES results agree well with the experimental data and the LES results of Hao and Gorle [7] over the entire region. Hao and Gorle explain that this difference is due to a nonuniformity of the pin surface temperature in the experiment (lines 1, 2, and 3).
For a clear recognition of the calculated local Nusselt numbers, the results of the current work are plotted in the same colors as in the other figures. In the IDDES and k- SSTLM models, the Nusselt number near the leading edge of the first row increases, then decreases slightly and then increases again, while the SBES model shows a gradual increase without any decrease. 14, can be recognized for the pins, but it is difficult to identify them in the downstream pins.
14 shows the time-averaged flow patterns and temperature contours in the front of the cylinder at the centerline of the xz-plane. The SBES model predicts this vortex system slightly closer to the first cylinder wall than the other two models, and the CV (corner vortex) is clearly shown in the SBES model. In the k- SSTLM model, as expected, the flows near the inlet are predicted in laminar flow and then develop into turbulent flow that is sustained until exiting the computational domain.

Uncertainty Quantification for Staggered Pin-Fin Arrays
The probability distribution of input parameter affects the probability density function (PDF) of the average Nusselt number. These results show that only the assumption about the probability distribution of the input variable induces a completely different outcome distribution. Fig.18 shows that the box and whisker plot of the local Nusselt number along the center line of the end wall depending on the probability distribution of the input variable.
The mean and standard distribution of each input probability distribution are the same as the average Nusselt number results. The results of the mean of the uniform distribution and the normal distribution are similar to the deterministic results of the Nusselt number distribution shown in Figure 11. However, the results of the normal distribution show more uncertainty than the results of the uniform distribution.

Conclusion
Conclusions
Vertical structures, including horseshoe vortex systems ahead of the first pin and wakes after each pin, are fully resolved in the two hybrid RANS/LES models, very similar to the LES model. In particular, the SBES model is able to capture the distorted spanwise vortex tube after separation from the first fin, whereas IDDES and k-ω SSTLM fail based on the same grid system. In our study of the effects of the mixing function of the two hybrid RANS/LES models, the SBES model uses the LES calculation in a larger area with a sharp transition from RANS to LES compared to the IDDES model.
When the input PDF is uniformly distributed, the mean 𝜇 of the output PDF is 43.1714 and the standard deviation 𝜎 is 1.2792. When the input PDF is normally distributed, the mean 𝜇 of the output PDF is 43.1208 and the standard deviation 𝜎 is 2.2179.
Future works
URANS of power and end wall heat transfer in a pinned passage relevant to gas turbine blade cooling. Vortex structures and heat transfer in a wall-bounded pin array: LES with a RANS wall treatment. Large vortex simulation of forced heat convection in a pin-fin array with a priori examination of a vortex viscosity turbulence model.
Symposium on Hybrid RANS-LES Methods, Cham, Springer, pp.27-37. PDF) Validation of URANS SST and SBES in ANSYS CFD for the turbulent mixing of two parallel plane water jets colliding with a stationary pool. Assessment of stress-blended eddy simulation model for accurate wind turbine performance prediction with three straight blades and vertical axes.
