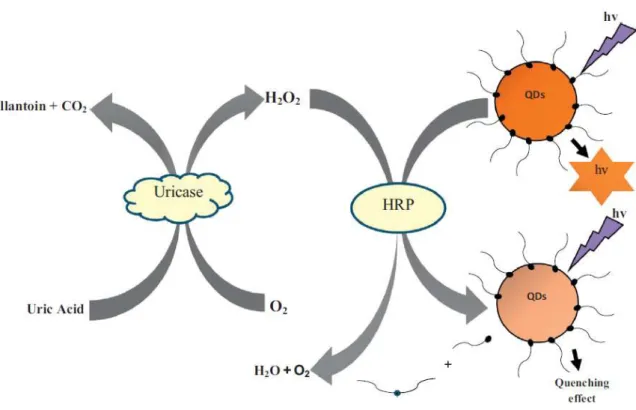
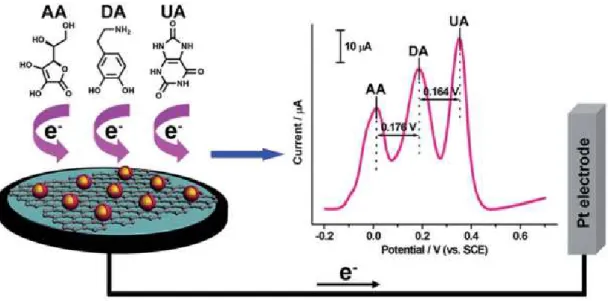
The sandwich electrode structure showed high sensitivity with two linear ranges of uric acid concentration. The reaction scheme of enzymatic fluorescence uric acid sensor including uricase/HRP enzyme based on H2O2-sensitive QDs. Schematic of non-enzymatic electrochemical sensor that can measure ascorbic acid, dopamine and uric acid simultaneously.
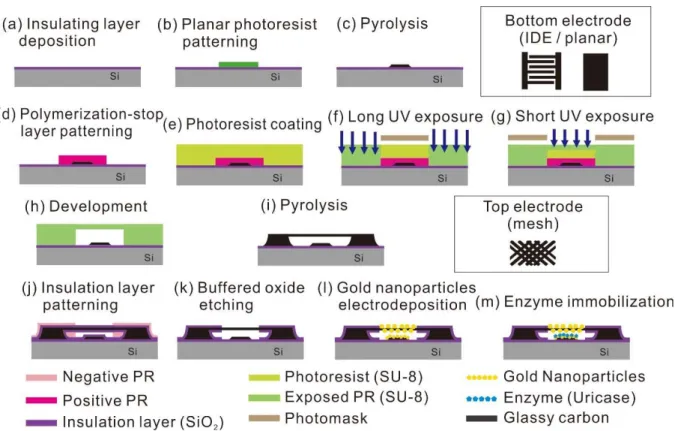
Schematic of the fabrication steps of an enzymatic uric acid sensor based on gold nanoparticle-decorated sandwich electrodes, which is evaluated in this work. Amperometric current responses from three independent uric acid sensor structures are plotted in terms of uric acid concentration.
Conventional uric acid sensing methods
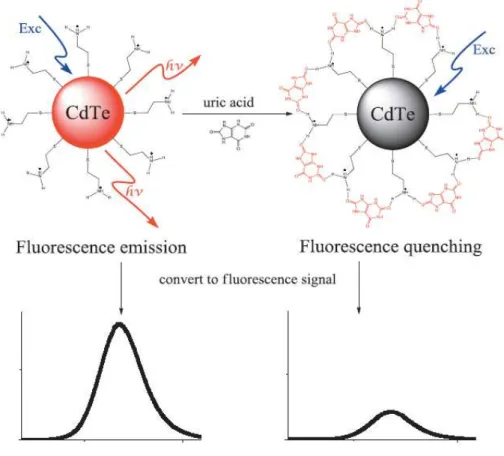
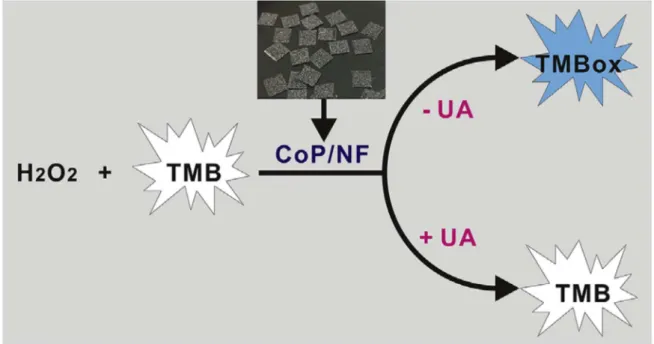
The unique detection method of the uric acid sensor is the use of phosphotungsten in the uricase enzyme reaction. 11-14] The detection mechanism of the enzymatic uric acid sensor using the fluorescence detection method is shown in Figure 2. The detection mechanism of the non-enzymatic uric acid sensor using direct quenching by uric acid was shown in Figure 3.
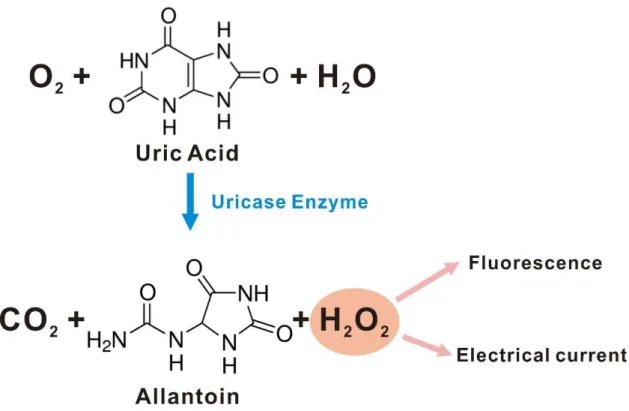
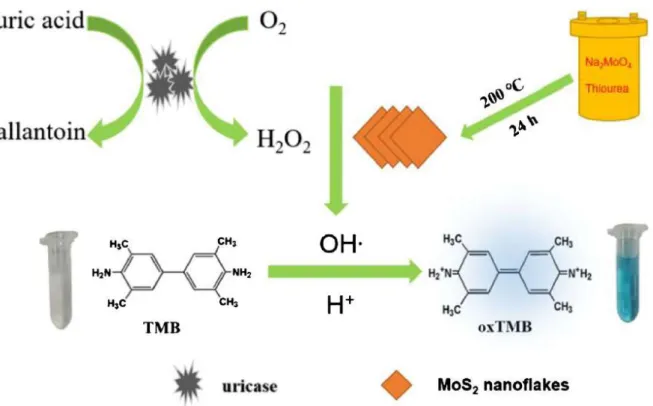
As shown in Figure 4, hydrogen peroxide is produced by uric acid being oxidized by the uricase enzyme. This method measures the amount of hydrogen peroxide produced by the presence of uric acid. In this thesis, the details of the uric acid sensor based on gold nanoparticle-decorated sandwich electrodes are presented, from fabrication to sensor evaluation.
The final evaluation of the sensor was performed with chronoamperometry detection result of uric acid concentration. The fabrication of the sandwich electrode uric acid sensor in this work can be defined in three steps. Finally, for uric acid detection, the uricase enzyme was selectively immobilized on electrodes decorated with gold nanoparticles.
The measurement was carried out by a chrono-amperometric test of 0.6V vs. Ag/AgCl according to each uric acid concentration. The representative value was organized in uric acid concentration – current signal graph as shown in Figure 30. Sensing performance was evaluated with low detection limit and sensitivity of uric acid detection.
Through this work, high performance uric acid sensor based on carbon sandwich electrode decorated with gold nanoparticles was developed. The uric acid sensor in this work collects the current signal from the byproduct of enzymatic reaction, hydrogen peroxide, by decomposing it.
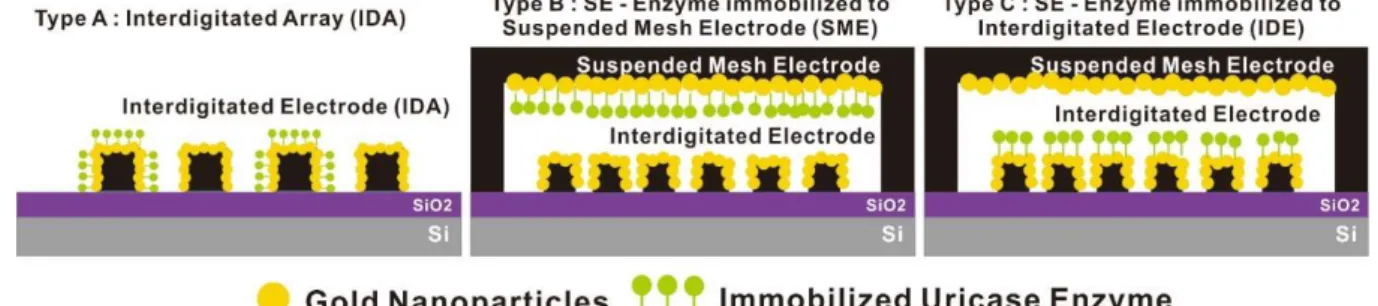
Different electrode structures used for electrochemical biosensing
Thesis outline
The sandwich carbon electrode structure was fabricated with a batch process using carbon MEMS technique. Gold nanoparticles were deposited over the carbon electrode to improve the surface reactivity of the electrode by increasing electrode surface area and improving the electroconductivity. Enzyme is selectively immobilized on the lower electrode to ensure the reactivity of suspended mesh electrode where current signal of hydrogen peroxide will be collected.
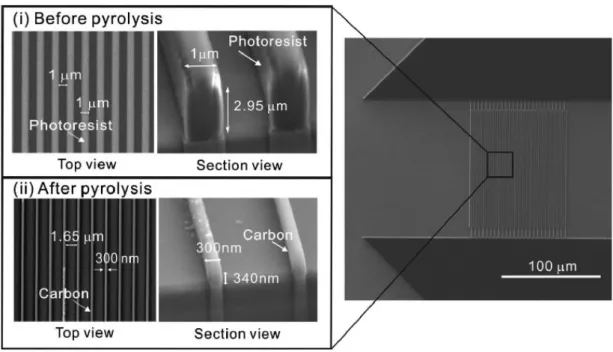
The structure of the sensor was thoroughly evaluated by optimizing the details of the structure, such as the type of the bottom electrode, and comparing the performance with the interconnected array electrode, which was previously treated in the laboratory. First, the carbon structure is fabricated with the carbon-MEMS process, using UV photolithography and pyrolysis. The sandwich electrode structure was patterned by photolithography and turned into carbon electrode by pyrolysis process.
To use the carbon electrode in electrochemical experiments, the SiO2 insulating layer was formed using PECVD and BOE etching. Second, to improve the surface reactivity and surface area, gold nanoparticles were deposited on the carbon electrode.
Carbon-MEMS: Carbon sandwich electrode
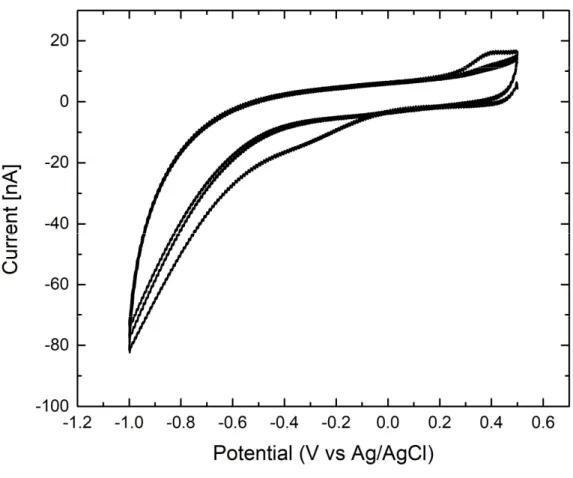
In characterizing the electrochemical reactivity of sandwich carbon electrode structure as a working electrode, cyclic voltammetry of 10 mM [Fe(CN)6]4-(Potassium ferrocyanide; Sigma Aldrich Co., USA) was performed in potentiostat (CHI1010, CH Instruments, Inc., USA) in a potential range of 0 to 0.6 V vs. Ag/AgCl at scan rate of 50 mV/sec. For cyclic voltammetry, Ag/AgCl was used as the reference electrode and platinum wire was used as the counter electrode.
Electrodeposition: Gold nanoparticles decorated carbon electrodes
Enzyme immobilization: Selective immobilization of Uricase enzyme
In the characterization of the electrochemical reactivity of the carbon sandwich electrode structure as a working electrode, cyclic voltammetry of 10 mM [Fe(CN)6]4-(Potassium ferrocyanide;. This step is to activate the carboxyl group of the diazonium salt for immobilization final enzyme. during incubation, the electrode structure was rinsed with DI water and incubated for 12 hours at 4℃ in the presence of 4 mg/mL uricase enzyme (Uricase from Candida sp.; Sigma Aldrich Co., USA) solution in PBS (pH 7.5).
The uricase enzyme is bound to EDC/NHS activated electrodes, leading to selective immobilization by the following procedures. The immobilization includes reduction of diazotized CMA, activation of carboxylic acid group with EDC/NHS and covalent bonding between amino group of uricase enzyme with the activated carboxylic acid group.
Experimental setup: Uric acid sensing
Gold nanoparticles decorated sandwich electrodes
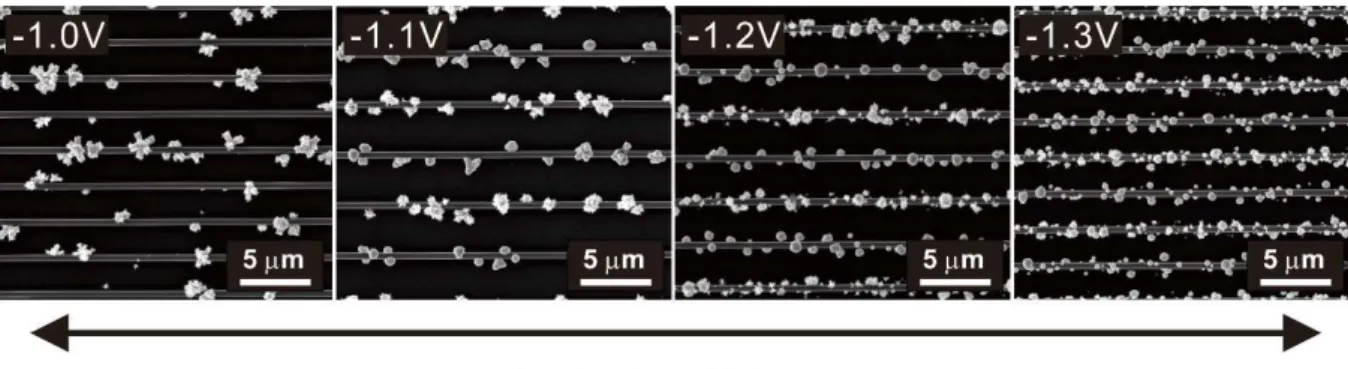
To better understand the electrodeposition of gold nanoparticles, the amplitude of the core voltage was controlled and observed. As the nucleation voltage increased from −1.0 to −1.3V vs. Ag/AgCl, the gold nanoparticle grew more conformally and the size of each particle decreased (Figure 16). The role of the nucleation step is to create a seed layer of gold nanoparticles on the high potential carbon electrode.
If the potential is not high enough, the seed layer is not uniformly distributed across the carbon electrode, leading to a limited number of gold particles being deposited. Thus, during the particle growth step, gold particle deposition is concentrated on those limited number of gold nanoparticle seeds that cause massive growth of certain particles. The single-mode CV of the gold-particle-decorated IDE showed a current level of 0.202 μA, and the gold-particle-decorated hanging grid showed a current level of 0.879 μA at 0.6V vs. Ag/AgCl.
A scanning electron microscopy (SEM) image of an electrodeposited gold interdigitated electrode (IDE) with variation of the gold electrodeposition nucleation voltage from −1.0 to −1.3 V vs. Ag/AgCl. As the nucleation voltage increased from −1.0 to −1.3 V vs. Ag/AgCl, the gold nanoparticle grew more conformally and the size of each particle decreased. Dual-mode current enhancement when high nucleation voltage was applied and more conformal deposition of gold nanoparticles was performed.
In the case of -1.0 and -1.1 V vs. Ag/AgCl nucleation voltage, the IDA electrodes were short-circuited due to massively grown gold particles.
Selectively immobilized enzyme
Single-mode CV was performed simultaneously on the bottom IDE and suspended carbon grid that was scanned from 0 to 0.6 V vs. Ag/AgCl. Dual-mode CV was performed by applying the 0 to 0.6 V scan to the IDE as the generator electrode and −0.3 V to the collector current at the suspended grid electrode. The difference between the first cycle CV plot and the second/third cycle CV plot indicates that CMA reduction occurs during the first voltammetry scan.
To see the change in surface reactivity of the electrode surface, the graph in Figure 21 shows the graph of 10 mM [Fe(CN)6]4- CV of the modifying and non-modifying electrodes. As the immobilization steps progress, the current level of the modifying electrode decreases significantly, while that of the non-modifying electrode barely decreases. The graph shows the change in CV response after each modification step for both modifying and non-modifying electrodes.
Also, the extreme current drop in the CV plot of the modifying electrode shows that the surface reactivity is severely impaired after immobilization of the enzyme.
Structural benefit of sandwich electrodes compared to IDA
Cyclic voltammetry experiment result
Gold nanoparticle electrodeposition optimization
IDE as bottom electrode compared to planar electrode
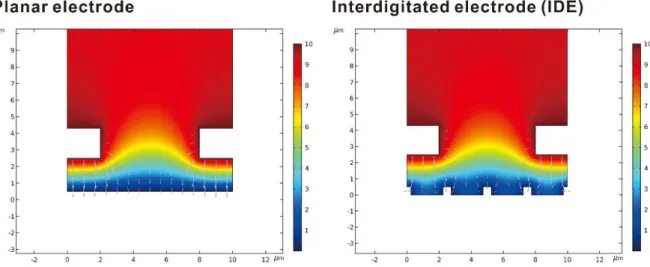
Comparing the planar electrode and IDE as the bottom electrode of the sandwich structure, although the gold particles are more conformally deposited in IDE, the planar electrode has a larger surface area compared to IDE. A simulation using COMSOL was performed to verify whether the choice of IDE as the bottom electrode is more effective for the sandwich electrode structure. The area of the generator electrode, the bottom electrode, was calculated to remove ferrocyanide and replace it with ferrocyanide based on the reaction rate of ferrocyanide, the voltage applied to the generator electrode, and the adjacent concentration of ferrocyanide on the electrode surface.
How the redox cycle takes place between the two electrodes can be examined from the ferrocyanide concentration distribution plot. As shown in Figure 27, the ferrocyanide concentration and flow plot is similar for both sandwich electrodes. Although the distance between the bottom electrode and the hanging grid is set to be the same for both structures, the actual electrode gap that governs the redox cycling area between the flat bottom electrode and the grid appears to be smaller than the IDE bottom electrode .
As shown in Figure 28, the total collector electrode flow rate is 19 nmol/(m∙sec) for the IDE bottom electrode and 22 nmol/(m∙sec) for the flat bottom electrode. Although the electrode structure with the planar bottom electrode showed a larger flow rate, the difference between the two structures may not be significant. Plot of ferrocyanide concentration distribution (color distribution) and relative flow rate (gray arrows) around the electrode surface.
The different colors can be interpreted via the color legend in the ferrocyanide concentration in mM.
Uric acid sensing performance of this work
The sensor was evaluated with wide uric acid concentration of 5 to 1000 μM and showed high sensitivity of 742.11 μA/(mM∙cm2) for low concentration range and 553.26 μA/(mM∙cm2) for high concentration range. As uric acid is converted to allantoin by uricase enzyme, the water molecule is oxidized to hydrogen peroxide, which is shown to show uric acid concentration. Future work on the gold nanoparticle decorated sandwich electrode uric acid sensor is to design superior sensing mechanism to exploit redox cycling and to construct multiple sensors.
Lower serum uric acid is associated with mild cognitive impairment in early Parkinson's disease: a 4-year follow-up study. A one-tube serum uric acid method using phosphotungstic acid as protein precipitant and color reagent. A simple and sensitive fluorescence-based biosensor for the determination of uric acid using H2O2-sensitive quantum dots/dual enzymes.
Sensitive electrochemical sensors for the simultaneous determination of ascorbic acid, dopamine and uric acid based on graphene oxide nanocomposites with reduced Au@Pd. CeO 2− x/C/rGO nanocomposites derived from Ce-MOF and graphene oxide as a robust platform for highly sensitive detection of uric acid. Construction and application of an amperometric uric acid biosensor based on covalent immobilization of uricase on an iron oxide nanoparticle/chitosan-g-polyaniline composite film electrodeposited on a Pt electrode.
Effect of separation and concentration of f-MWCNTs on the electrocatalytic responses of ascorbic acid, dopamine and uric acid in f-MWCNTs incorporated into poly (neutral red) composite films.
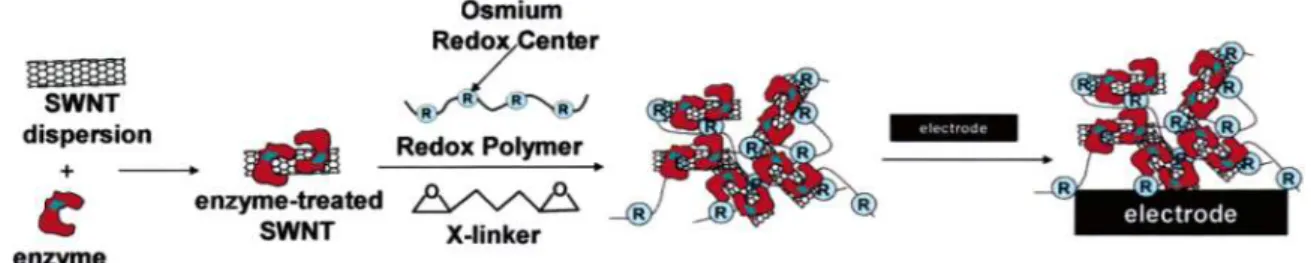
![Figure 7. The various method of functionalization is possible with carbon nanotubes. [35]](https://thumb-ap.123doks.com/thumbv2/123dokinfo/10508149.0/23.892.149.744.214.611/figure-various-method-functionalization-possible-carbon-nanotubes-35.webp)