Abstract
Introduction
In particular, SARS-CoV-2 is suggested to infect neuronal and glial cells, providing access to numerous pathways for the spread of the infection to the entire CNS [4]. In the later stages of infection, initially released cytokines induce the production of other inflammatory particles leading to the cytokine storm [6]. Therefore, studying the effect of the virus on the release of cytokines from cells of the CNS is critical to understanding the course of the disease.
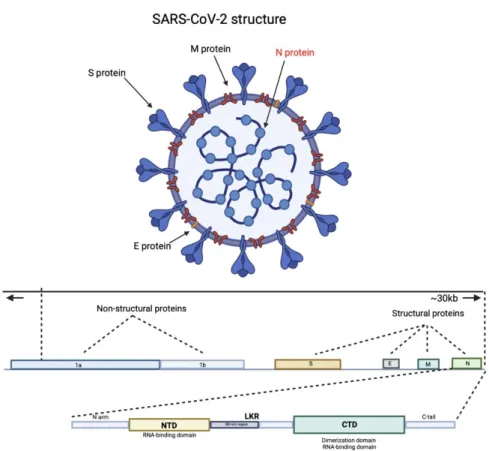
There are also two disordered regions on both sides of the NTD and CTD (N-arm and C-tail) that help regulate RNA binding and oligomerization [ 13 ]. The segment of the N protein from amino acids 341 to 422, also known as the C-terminus, is necessary for the viral protein to induce expression of the IL-6 gene. The N protein of SARS-CoV is also shown to induce the release of cytokines (IL-6) from alveolar cells by interacting with the NF-κB promoter that is responsible for the expression and induction of IL-6 release from cells [ 16 ]. the rate at which IL6 mRNA was induced varied greatly, ranging from
The release of IL-6 into the CNS bloodstream can pose a major risk, resulting in axon demyelination and neuronal cell damage [6]. The effect of N protein on cytokine release in glial cells is important to investigate, as it may be a key to future treatment of the disease.
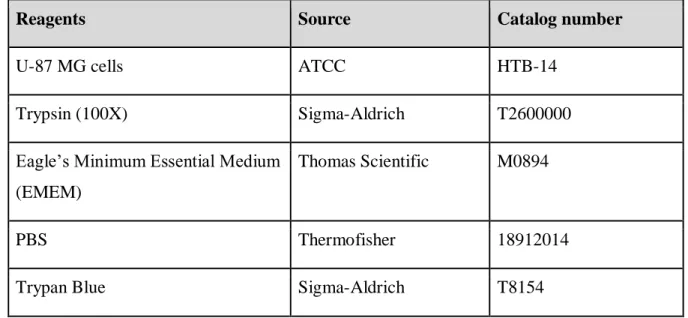
Materials and Methods
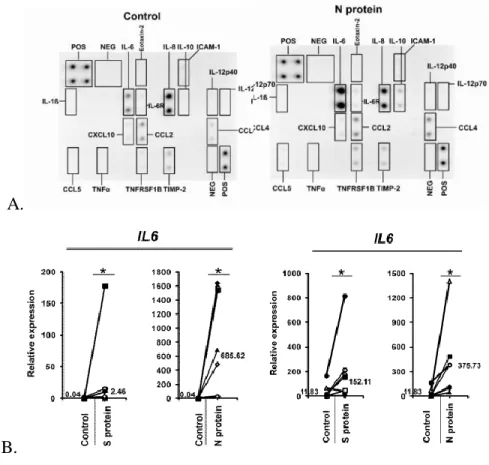
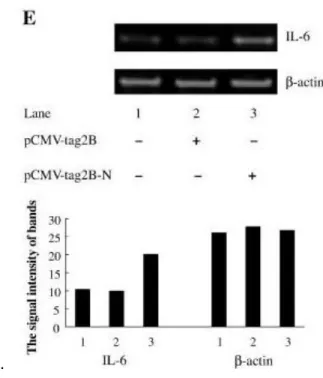
The change in the expression of IL-6 cytokine in alveolar cells. A) The expression of IL-6 by the cells transfected with pCMV plasmid containing a sequence for the N protein gene was. Cells are grown until confluence reaches 80%, then 2 ml of trypsin is added to the flasks to detach the cells from the surface. 1 ml of EMEM is added to the centrifuged cells and mixed thoroughly so that no precipitate is left on the bottom of the tube.
The supernatant is removed and 350 µl RLT buffer from the kit is added to the cells and the mixture is pipetted 10 times. Then add 350 µl of 70% ethanol to the tube and pipette with a syringe 10 times, this mixture is then transferred to the elution column, which is centrifuged for 15 seconds at 10,000 rpm, the supernatant is removed. An additional 500 µl of RPE is added, the column is centrifuged for 2 min at 10,000 rpm, and the supernatant is removed.
In the next stage, 50 ul of RNase-free water is added for the 1st elution, the column is centrifuged for 1 minute at 10000 rpm, the obtained RNA is transferred to the tube. 4 ul of 5X reaction mixture is added to the tube, and 2 ul of Maxima Enzyme is added to the tube.
Results
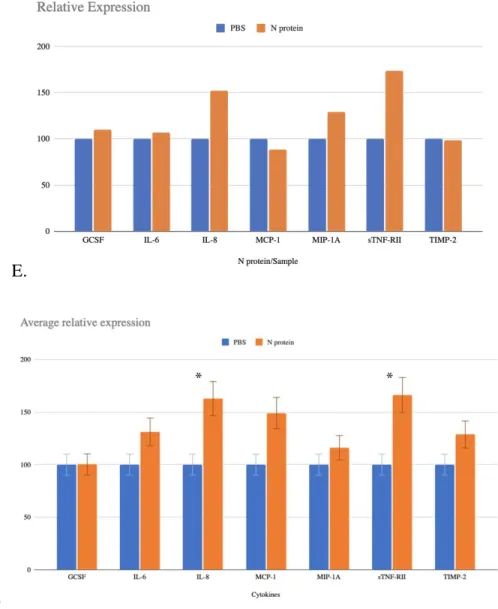
For the statistical analysis of the results obtained from the experimental procedures, t-test p-value is used to see which concentration of recombinant N protein showed significant difference in expression of IL-6 from glial cells. The results are also consistent with the expression values relative to the PBS sample (Figure 4D, Figure 4E and Figure 4F). However, the change in the expression of the cytokine of interest for the 2nd stimulation is less.
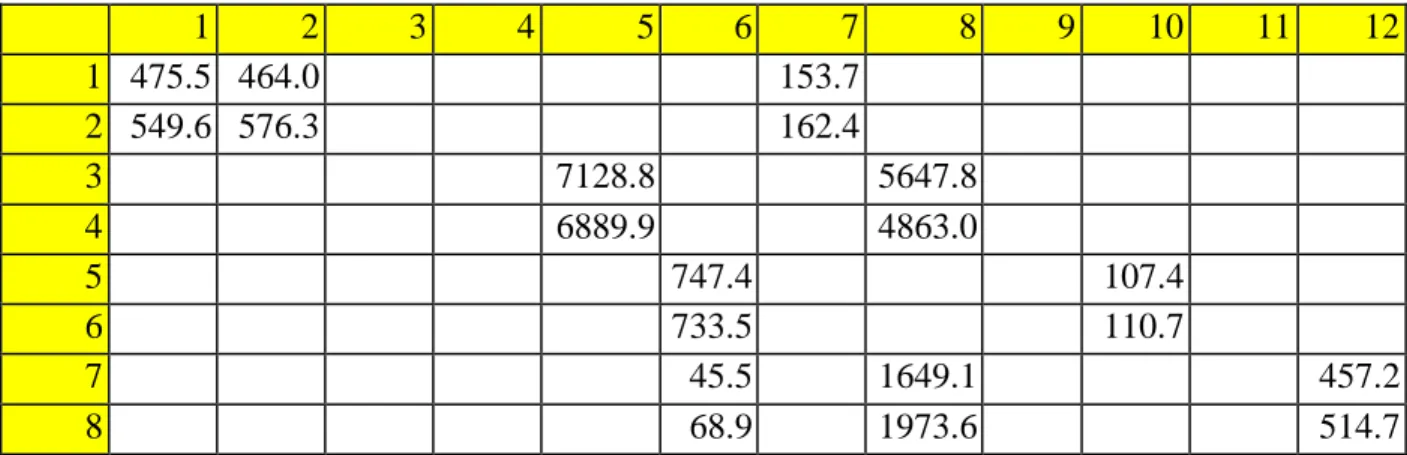
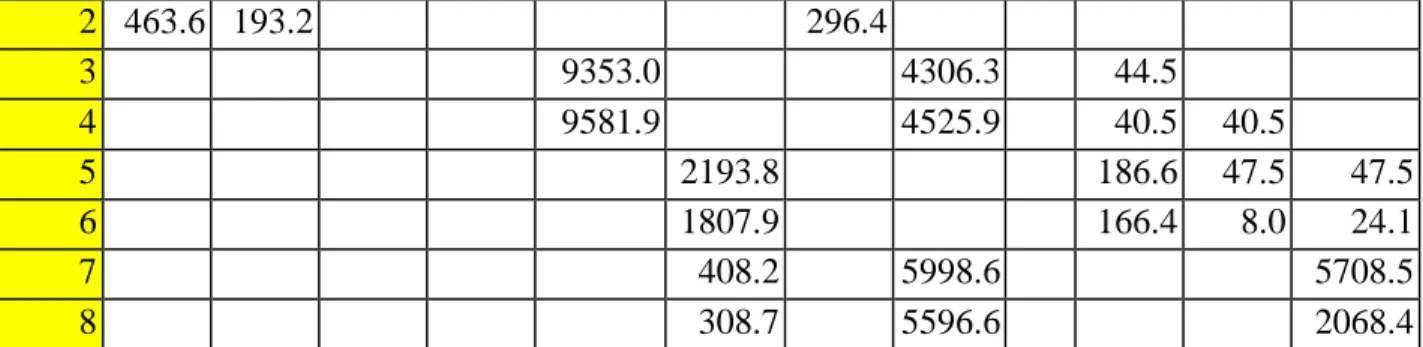
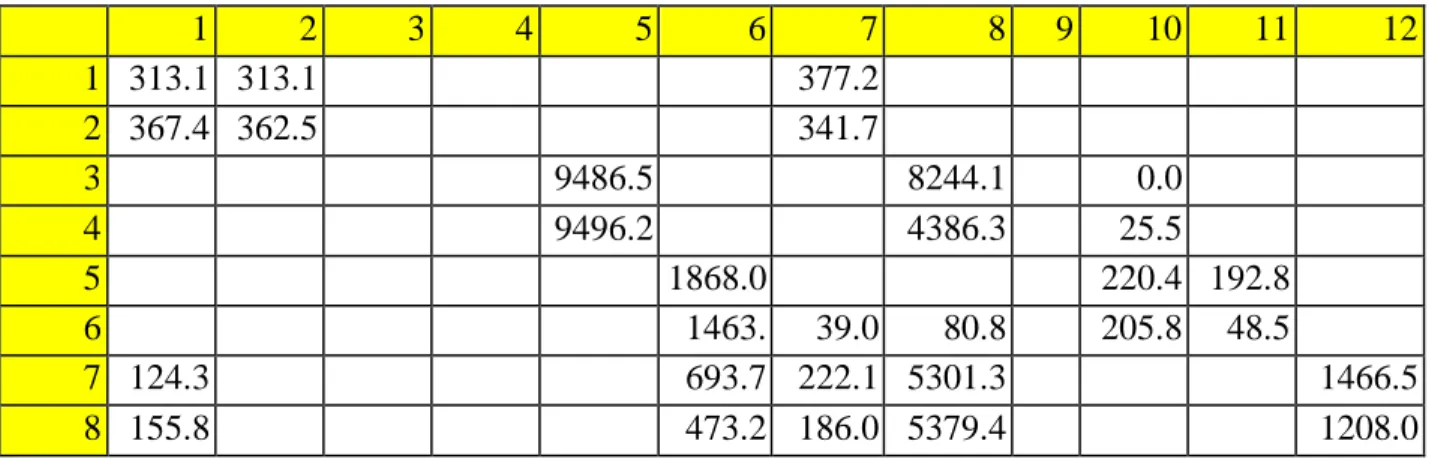
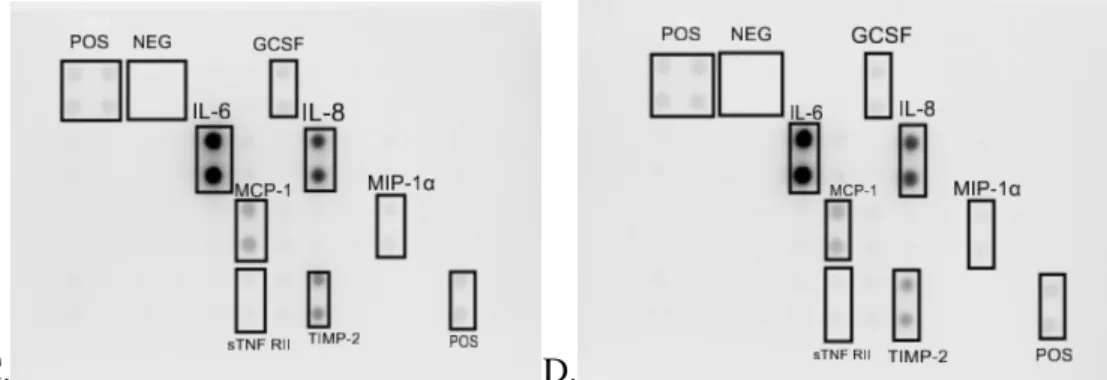
TIMP-2 is also an important factor in the immune system's defense mechanisms, as it is responsible for cell proliferation, and is expressed in response to lipopolysaccharide (LPS) in the cell walls of bacteria, possibly showing that it is released in response on the external stimuli [19]. Raw signal intensity for the control sample stimulated with PBS measured on ImageJ for the 1st experiment. Raw signal intensity for the sample stimulated with N protein measured on ImageJ for the 1st experiment.
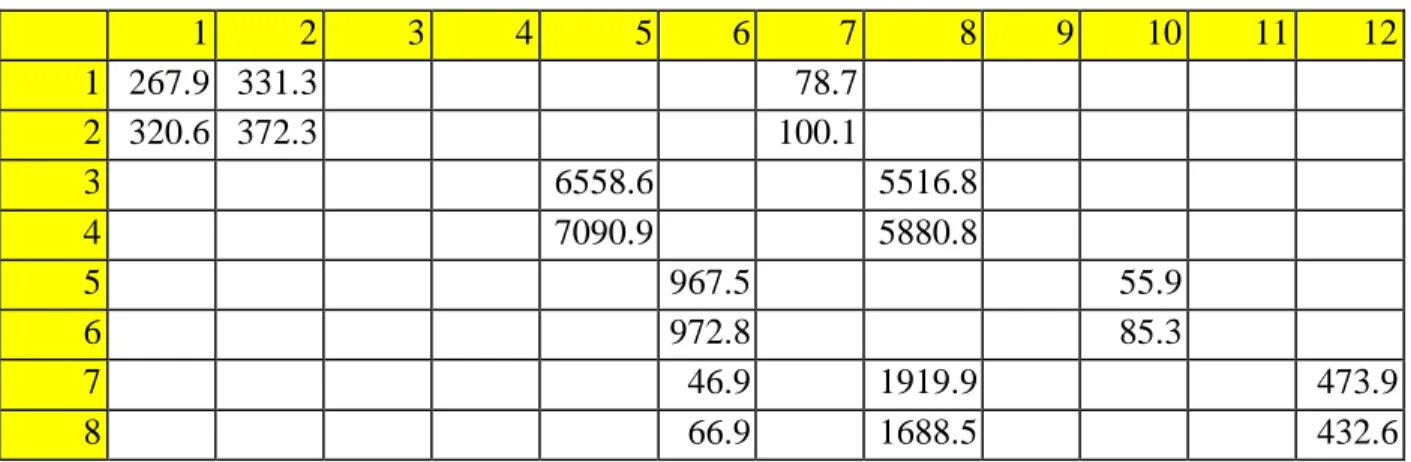
Raw signal intensity for the control sample stimulated with PBS measured on ImageJ for the 2nd experiment. Raw signal intensity for the sample stimulated with N-protein measured on ImageJ for the 2nd experiment. The measurements for the samples used for the standard curve were inconsistent, so it was difficult to construct the curve to analyze the results.
Therefore, we only used raw values for the IL-6 concentration measured to see which samples showed the greatest difference. For qRT-PCR, we used a primer designed for IL-6 cytokine to see the change in its concentration (primer sequence for IL-6 is used from previous paper [10]) and a primer for a housekeeping gene that is consistently expressed in the cells. Several additional primers for housekeeping genes were used (b_actin, GAPD) to see the difference in expression of IL-6 compared to the control, but SDHA is used for comparison of the IL-6 expression between the experiments.
The raw data of the two other experiments show a lower Ct value for the experimental sample, but the difference is smaller than in the previous experiment. After determining the expression change using the delta delta-Ct method, only the values for the SDHA case showed a very insignificant change in expression (60.29% and 106.66% for experiments 1 and 2) of IL-6 or a change of -39, 71 and 6.66%. Raw data for Ct values of experimental and control samples for Experiment 1.
Raw data for the Ct values of experimental and control samples for the 2nd experiment. Raw data for the Ct values of experimental and control samples for the 3rd experiment.
Discussion
Finally, MIP-1α, sTNF-RII and GSCF were also released by U87-MG, and especially the release of GCSF has been affected the most according to the p-value of the first experiment. As we can see in addition to IL-6, IL-8 and TIMP-1 are affected by the stimulation with N protein, so it seems reasonable to test the difference in their expression further with the use of qRT-PCR, for which specific primers will be designed to measure the change in their concentration as a result of interaction with nucleocapsid protein of SARS-CoV-2. It is also necessary to repeat the dot-blot assay several times to see if the results agree with each other and the observations in the expression of cytokines can be repeated in the experiments.
The problem with the previous part of the procedure could be caused by the unsuitable conditions for the concentration of recombinant N-protein and incubation time, as it was established based on the previous paper [10]. Results indicate that the most significant difference can be observed in a sample incubated for 24 hours at a concentration of 10ug/ml. Therefore, for the next attempts of dot-blot and ELISA, the change in these variables will be applied to get more accurate results with a greater difference in the expression of some cytokines.
However, during the ELISA procedure, building the standard curve was impossible because the concentration of the samples used for the standard was incorrect. parameters will actually show a significant difference in the concentration of IL-6. Next, we measured the concentration of mRNA IL-6 in experimental and control samples using qRT-PCR and a specially designed primer (Karw_IL-6) used in the previous study on macrophages and monocytes [10]. Two qRT-PCRs were performed and in both cases the decrease in the Ct value or the increase in the concentration of IL-6 in the experimental sample can be observed.
The results of the delta-Ct method using the raw Ct values for the first experiment show that there was a marked up-regulation of expression (34.38%) in the levels of the cytokine of interest. Nevertheless, for the second and third procedures despite the fact that Ct value was lower for the sample with N-protein, the delta-Ct method showed no significant. The average change in the expression for SDHA primer is 100.4%, indicating that there is no significant difference in the concentration of IL-6 mRNA in the experimental samples.
The main reason for this is the fact that the second experiment showed negative results, decreasing the mean expression change. It shows that it is necessary to run qRT-PCR a few more times to see if the expression upregulation follows the trend and is consistent across studies. Here, as well as for dot blot assay, it may be necessary to change the conditions for the further experiments as the concentration of recombinant N protein used for these experiments may not be sufficient to induce the release of IL-6 significantly influence.
Conclusion
Receptor-independent spread of a highly neurotropic murine coronavirus jhmv strain from initially infected microglial cells in mixed neural cultures. Discovery of severe acute respiratory syndrome coronavirus in the brain: potential role of the chemokine mig in pathogenesis Clin. SARS-CoV-2 nucleocapsid protein: Its role in the viral life cycle, structure and functions, and use as a potential target in vaccine development and diagnostics.
Sars-cov-2 coronavirus nucleocapsid and spike proteins induce il6 in monocytes and macrophages—potential implications for cytokine storm syndrome. Enhancement of chemokine (C-c motif) ligand 2 via the spike-ace2 signaling pathway of severe acute respiratory syndrome coronavirus. Dual role of microglia in promoting tissue inhibitor of metalloproteinase (TIMP) expression in glial cells in response to neuroinflammatory stimuli.
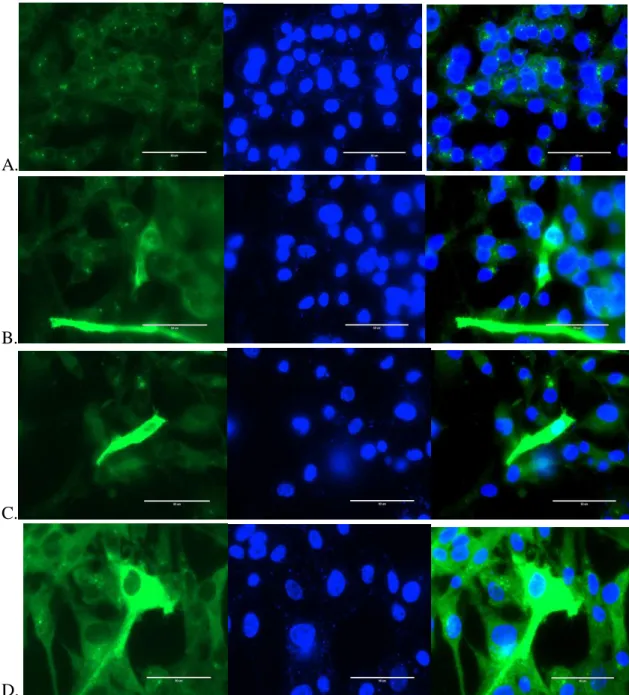
LPS-induced release of IL-6 from glia modulates the production of IL-1β in a JAK2-dependent manner. U-87 MG cells transfected with pCMV plasmid containing myc-DDK vector for N protein gene observed on EVOS (60X).
Acknowledgements
Cytokine release syndrome in severe COVID-19: Interleukin-6 receptor antagonist tocilizumab may hold key to reducing mortality. Analysis of relative gene expression data using real-time quantitative PCR and the 2(-Delta Delta C(T)) Method'.