Distribution and power transformers are essential components of any electrical network, therefore the electrical and mechanical safety of the transformer unit is among the highest concerns of electricity providers. Therefore, for the advancement of the FRA interpretation process, the application of various approaches has been widely discussed including statistical analysis, machine learning, image processing, to name a few.
LIST OF ABBREVIATIONS
FRA ITIC
SD SSE
INTRODUCTION
- Problem statement
- Motivation
- Research objectives
- Thesis outline
Apply different severities of the winding short circuit fault across the distribution and current transformers;. The detailed description of the developed physical transformer windings and software models is covered in Chapter 4.
- Publications during candidature .1 Journal papers
10.1109/TIA.2021.3118661
10.1109/TPWRD.2019.2909144
Conference papers
10.1109/ICRERA47325.2019.8997076
10.1109/EEEIC.2019.8783252
Complementary journal papers
TRANSFORMER FAULTS AND DIAGNOSTIC TECHNIQUES
- Introduction
- Transformer fault types and factors
- Transformer condition diagnostic techniques
- Short circuit impedance (SCI) method
- Vibration method
- Communication method
- Current deviation coefficient (CDC) method
The integrity of the transformer unit may be damaged due to the following internal and external factors. Thermal methods are based on the thermal properties of the active part of the transformer assessed via thermography tests.
- Ultrasonic method
- Short circuit impedance and winding stray reactance method
- Voltage-current (V-I) locus diagram method
- Dissolved Gas Analysis (DGA) method
- Transfer function method
- FREQUENCY RESPONSE ANALYSIS (FRA)
- Introduction
- FRA concept
The interpretation of the test results is based on the concentration of the specific gases in ppm (parts per million) in the oil content or the ratio of the different gases (for example ethane/methane) [89]. Based on the type of the injected signal, FRA can be categorized into: (i) Impulse Frequency Response Analysis (IFRA) and (ii) Sweep Frequency Response Analysis (SFRA).
FRA interpretation techniques
- Visual inspection
- Machine learning tools
- Statistical analysis
- Digital image processing
In [143], learning vector quantization (LVQ) borrowed from artificial neural networks (ANN) is used for transformer insulation damage classification. In addition, in [106] and [150] decision bounds for correlation factor (CCF) and relative factor (RF) for transformer condition classification are defined.
![Figure 3.4. FRA signatures of phases A, B, and C with frequency sub-bands illustrated, taken from [133]](https://thumb-ap.123doks.com/thumbv2/azdokorg/10954509.0/39.918.277.696.104.400/figure-fra-signatures-phases-frequency-bands-illustrated-taken.webp)
FRA Standards .1 DL/T911-2004
- CIGRE Working Group A2.26
- IEC 60076-18:2012
- IEEE C57.149
- NCEPRI
The very high frequency subband varies depending on the size of the transformer under test. The practical part of the standard contained actual FRA signatures of the transformers undergoing frequent failures.
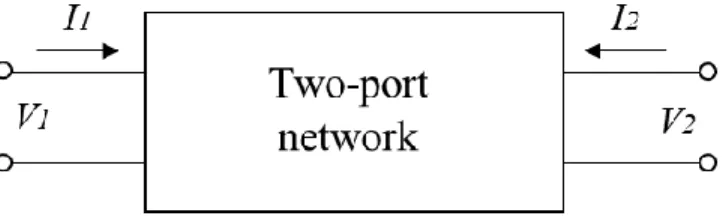
15) where TF 1i and TF 2i represent transfer function of the fingerprint and the new measurement,
WINDING MODELING
- Introduction
- Winding RLC model
- Self-inductance
- Mutual inductance
- Turn-to-turn capacitance
- Resistance
- Disk space variation (DSV)
- Disk tilting
SPICE simulation of the mutual coupling between two inductors The complete winding model is shown in Figure 4.6. Disk-to-disk capacitances between turns of the normal and displaced disks during radial deformation faults.
TRANSFORMER CONDITION CLASSIFICATION METHODOLOGY
- Introduction
- Statistical analysis
- Statistical Indicators (SIs)
- Correlation Coefficient (CC)
- Euclidean Distance (ED)
- Root Mean Square Error (RMSE)
- Absolute Sum of Logarithmic Error (ASLE)
Root Mean Square Error (RMSE) is the estimate of the numerical difference between the respective data points of two data sets. The best-case scenario, where two data sets overlap, is represented by the ASLE value equal to 0, while the upper bound for ASLE tends towards +∞, indicating the level of difference between two sets:.
ASLE N
Absolute Difference (DABS)
DABS N
Sum Squared Error (SSE)
SSE N
Comparative standard deviation (CSD)
CSD is an extension of the aforementioned SD, where the deviation of each sample with respect to its mean value is evaluated and used to determine the difference between two sets of data. CSD equal to 0 represents the intact case, where there are no deviations between the two spectra, while the upper bound has no definite limit, as it depends on the level of deviation [173].
CSD Y
- Minimum-maximum ratio (MM)
- Sum squared ratio error (SSRE)
- Sum squared max-min ratio error (SSMMRE)
- Normalized correlation coefficient (ρ)
- Coherence of SIs
- Winding short-circuit emulation
It is understood that when applying the given error condition to FRA data, individual SIs may have conflicting decisions. The transformer winding short circuit scenario is simulated by installing the variable resistance rheostat in parallel with the winding terminals. The worst case scenario corresponds to the complete short circuit of the transformer winding, where all the current coming from the source flows through the rheostat as illustrated in Figure 5.2(b) [110].
![Figure 5.1 [180] ©2022 IEEE illustrates the visualized coherence between indices, where](https://thumb-ap.123doks.com/thumbv2/azdokorg/10954509.0/69.918.299.676.467.691/figure-180-2022-ieee-illustrates-visualized-coherence-indices.webp)
2019 IEEE
Yellow-to-red decision boundary
In principle, the differential relay system of the tested transformer is set to 0.5% of the rated current [176]. Once the measured current value matches the desired value (0.5% of the nominal value), the parallel resistance is recorded and the FRA signature of the given configuration is obtained. Similarly, the decision boundary BY|R is expressed in terms of the critical values of twelve statistical indicators calculated from the FRA data.
SI Green Yellow Red
- Classification and Confidence level estimation
- Bolstered error estimation
Following the principle of the supported error estimator, the supporting kernel function is centered at each observation and for each working zone the area under the kernel pdf is estimated. Thus, the calculated area under the gain kernel for the given zone represents the confidence level of the test observation belonging to that zone. Consider an example of using the supporting kernels for the classification of the obtained FRA signature.
![Figure 5.6. Example of the bolstered resubstitution for linear discriminant analysis, where kernels are expressed with uniform circles, taken from [177]](https://thumb-ap.123doks.com/thumbv2/azdokorg/10954509.0/76.918.320.652.110.447/figure-example-bolstered-resubstitution-discriminant-analysis-kernels-expressed.webp)
Green Yellow Red Green Yellow Red
- Bootstrap sampling
- The FRA measurement of the given scenario is conducted
- The 12 SIs are estimated based on the acquired frequency response and the fingerprint signature
- The decision boundaries are generated using (63)-(70)
- SI-based probabilities C l ( k ) for each label l are estimated using boundaries defined in (69) and (70)
- The cumulative decision for each label l is defined via summation of the SI- based confidences and normalization
- The working condition of the test object is classified according to the label l with the highest confidence C l
Application of the bootstrapping method for standard deviation estimation was introduced by Efron and Tibshirani [178] and its schematic conceptualization is depicted in Figure 5.9. Consider the application of the bootstrap sampling technique to the FRA data interpretation and classification of the transformer operating condition. The working condition of the test object is classified according to the label l with the highest confidence Cl.
![Figure 5.9. Bootstrap sampling scheme taken from [178]](https://thumb-ap.123doks.com/thumbv2/azdokorg/10954509.0/80.918.321.649.493.782/figure-5-bootstrap-sampling-scheme-taken-from-178.webp)
SIMULATION AND PRACTICAL RESULTS, ANALYSIS AND DISCUSSION
- Introduction
- Case studies: Winding short-circuit
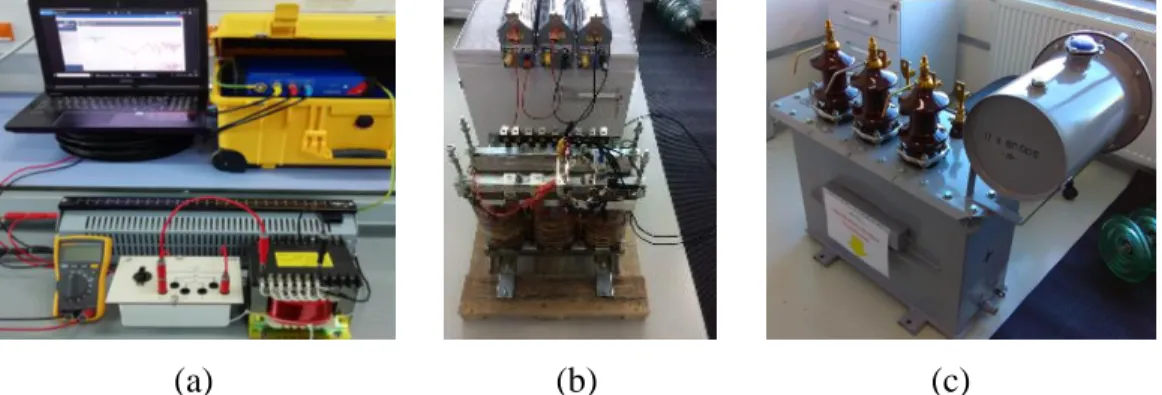
- Case 1: 1 kVA distribution transformer
The discussion of the results obtained and comparison with conventional methods is carried out in section 6.4. Transformers are subjected to different levels of winding short-circuit fault by varying the rheostat value according to the size of the test object and its total winding impedance. It is observed that around the first anti-resonance peak at 10 kHz, the frequency response is expected to become flat, which is the result of the winding short circuit.
Green Yellow Red
- ASLE 0.2460 0 50 50 DABS 1.0829 0 60 40
- SSRE 0.0019 0 0 100 SSMMRE 0.0019 0 0 100
- Cumulative 0 52.5 47.5 Assigned Label Yellow
- Case 2: 20 kVA distribution transformer
- SSE 0.6191 39.18 60.82 0 ASLE 0.1642 0 100 0
- SSRE 0.0008 0 60 40 SSMMRE 0.0008 0 70.02 29.98
- Case 3: 40 MVA power transformer
- ASLE 0.2224 0 70 30 DABS 1.8247 0 0 100
- SSRE 0.0018 0 0 100 SSMMRE 0.0018 0 0 100
- Cumulative 0 15.0 85.0 Assigned Label Red
- Case studies: Mechanical deformation
The visual representation of the predefined boundaries in Figure IEEE and the estimated CC value (0.9996) demonstrate that the given short-circuit scenario does not belong to any boundary, neither green-to-yellow, nor yellow-to-red zone, but instead mostly correspond to the yellow (suspicious) zone. The given CC value is observed to lie in the upper limit of the yellow-to-red boundary, which is numerically reported in 100% confidence level of the given observation being in the red zone. In this section, the classification of the transformer's operating condition and its confidence level is reported using the enhanced error estimation method discussed in Section 5.4.
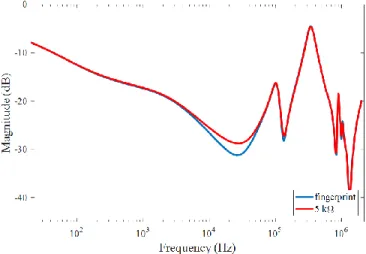
Figure 6.8. Illustration of the FRA measurement over the winding software model
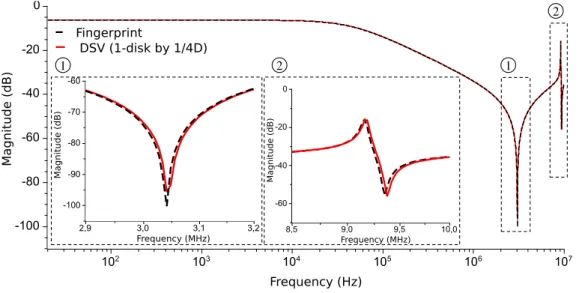
Case 1: Disk space variation (DSV) fault
CC-specific confidence levels for Case Study 1 (CC. The joint decision of all 12 indicators should be considered. The SIs evaluated for a given scenario, their corresponding ranking results and confidence levels are summarized in Table 16. Thus, the final assigned label for a given fault condition is green (healthy) operating mode.
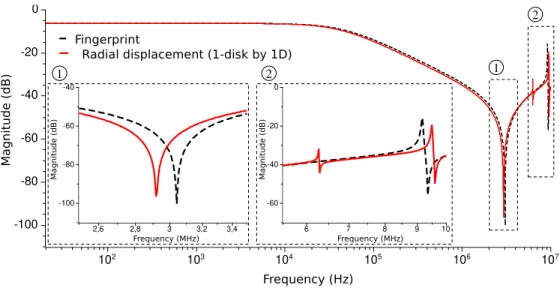
Clearly, the core mass of the current observation, where CC = 0.99745, lies in the red zone, which is why CC reports 100% certainty of belonging to the critical operating state. The CC-specific confidence levels for Case Study 2 (CC The estimated SIs and their respective classification results are reported in Table 17, showing an overall 37.07% and 63.93% confidence to belong to yellow (suspicious) and red ( critical) operating conditions, accordingly Based on the majority voting of the results of the statistical index, the given radial displacement scenario is thus considered to relate to the critical operating condition.
SI SI value Classification result Confidence (%) Green Yellow Red
CONCLUSIONS AND FUTURE WORK
- Conclusions
- Future work
- On-line FRA
- Three-phase winding RLC model
The established green-to-yellow (healthy-to-suspicious) and yellow-to-red (suspicious-to-critical) decision limits were applied to different levels of winding short-circuit severity and mechanical deformation. Grid stability and loading must also be considered during FRA line measurements. The detailed RLC model, as the name suggests, was based on distributed winding parameters - resistance, inductance and capacitance.
10.1109/ACCESS.2019.2932497
10.1109/ELINSL.2010.5549785
10.1109/ACCESS.2020.3027798
10.1109/TPWRD.2014.2306674
10.1109/TII.2020.3016966
10.1109/ACCESS.2019.2907648
Tenbohlen, “Comprehensive analysis of electrical and mechanical winding faults using a high-frequency model,” in Energies, vol. 22] Yann-Chang Huang, Hong-Tzer Yang, and Ching-Lien Huang, "Development of a Novel Transformer Fault Diagnosis System Using Evolutionary Fuzzy Logic," in IEEE Transactions on Power Delivery, vol. Saha, “Power transformer fault diagnosis under measurement-inherent uncertainties,” in IEEE Transactions on Dielectrics and Electrical Insulation, vol.
10.1109/TDEI.2012.6396956
Chakravorti, "Classification of Impulse Fault Patterns in Transformers Using Wavelet Network Joint International Conference on Power System Technology and IEEE Power India Conference, 2008, pp. Kulkarni, "Analysis of Buckling Strength of Inner Windings in Transformers Under Radial Short-Circuit Forces," in IEEE Transactions on Power Delivery, vol.
10.1109/TPWRD.2013.2272102
10.1109/TPWRD.2013.2276047
Hadjadj, "Electrical-based diagnostic techniques for the assessment of insulation condition in aged transformers," in Energies, vol. Patel Dynamic response of power transformers under axial short-circuit forces, part I windings and clamping as individual components," in Proceedings of IEEE PES Winter Meeting, New York, pp: 1558-1566. Shida Mechanical strength of transformer windings under short-circuit conditions, " in Proceedings of IEEE Winter Power Meeting, New York, pp: 2381-2390.
PAS, 104(2): 469-476, 1985
Alehoseini, “A new online monitoring method of transformer winding axial displacement based on measurement of scattering parameters and decision tree,” in Expert Syst. Kulkarni, "A novel approach for online deformation diagnostics of transformer windings," in IEEE Power and Energy Society, General Meeting, pp. Islam, "A Novel Online Technique to Detect Power Transformer Winding Faults," in IEEE Transactions on Power Delivery, vol. .
10.1109/IECON.2013.6700042
Feser, "Procedures for detecting winding displacements in current transformers by the transfer function method," in IEEE Transactions on Power Delivery, vol. Hanique, “A new frequency response analysis method for current transformers,” in IEEE Transactions on Power Delivery, vol. Gubanski, “High-Frequency Modeling of Power Transformers for Use in Frequency Response Analysis (FRA)” in IEEE Transactions on Power Delivery , vol.
10.1109/TPWRD.2008.917896
10.1109/TPWRD.2015.2448524
Fernando, "Application of SFRA techniques to discriminate short circuit faults
Fernando, "Application of SFRA techniques to discriminate short-circuit faults of transformer winding IEEE International Conference on Industrial and of transformer winding IEEE International Conference on Industrial and Information Systems (ICIIS), 2017, pp. Brynjebo, "Measurement Considerations using SFRA for condition assessment of Power Transformers International Conference on Condition Monitoring and Diagnostics, 2008, p.
10.1109/CMD.2008.4580428
10.1109/ACCESS.2020.2976157
10.1109/TPWRD.2020.2987205
Abu-Siada, “Use of digital image processing to detect transformer bushing faults and oil degradation using FRA polar plot signature,” in IEEE Transactions on Dielectrics and Electrical Insulation, vol. Gockenbach, “FRA-based transformer parameters at low frequencies International Conference on High Voltage Engineering and Applications, 2012, p.
10.1109/TPWRD.2010.2050342
Abu-Siada, "Application of DIP to Detect Power Transformers Axial Displacement and Disk Space Variation Using FRA Polar Plot Signature," in IEEE Transactions on Industrial Informatics, vol. Islam, “Diagnosis of transformer winding deformation faults based on binary image analysis obtained from FRA signature,” in IEEE Access, vol. Panda, “Evaluation of Statistical Interpretation Methods for Frequency Response Analysis Based on Transformer Winding Fault Detection IEEE International Conference on Sustainable Energy Technologies (ICSET), 2016, p.
10.1109/ICSET.2016.7811753
Phung, "Frequency response interpretation using statistical indices: A case study on 400 MVA transformer rd International Conference on Condition Assessment Techniques in Electrical Systems (CATCON), 2017, pp. Tao, "Experimental investigation of localized axial winding displacement in ' A high frequency range for power transformers International Conference on Condition Monitoring and Diagnosis (CMD), 2016, pp. Li, "Analysis of Operator's Visual Process Using a Human Information Processing Model," 16th International Conference on Artificial Reality and Teleexistence--Workshops (ICAT pp.
10.1109/ICAT.2006.42
Nafar, "Human reliability analysis in maintenance team of power transmission system protection," i Prot Control Mod Power Syst, vol.
10.1109/ACCESS.2020.2991844
10.1109/ICEMPE.2019.8727354
34; Classification of transformer winding faults based on transfer function analysis by a support vector machine,” in Electric Power Applications, IET.
10.1109/UPEC.2015.7339845
10.1109/EEEIC.2019.8783609
10.1109/TDEI.2009.5211871
Park, “Power transformer fault diagnosis using improved frequency response analysis,” in IEEE Transactions on Power Delivery, vol. Park, “Power transformer fault diagnosis using improved frequency response analysis,” in IEEE Trans. Miyazaki, "Analysis of Statistical Methods for Estimating Power Transformer Frequency Response Measurements," in IEEE Transactions on Power Delivery, vol.
10.1109/TII.2020.3007607
34;A New Diagnostic Technique for Reliable Decision-Making on Transformer FRA Data in Interturn Short-Circuit Condition," i IEEE Transactions on Industrial Informatics, vol.
APPENDICES
Appendix A. Self- and Mutual inductances calculation
Appendix B. Mutual inductance function
Appendix C. AC resistance calculation
Calculation of rotational capacities between turns of the same disk theta = np.arccos(1 - np.log(D_wire/d)/e_r) # intersection angle Theta*.
Appendix E. Netlist generation for winding with 10 disks with 6 turns per disk
Cdd_flip = Cdd_piko # disk-disk capacitance vector Cdd_print = Cdd_piko # first 6 Cdds.
Appendix F. Netlist for winding with 10 disks with 6 turns per disk
Appendix G. Coherence of SIs
Bolstered error estimation method Python main function
Appendix J. Area under the kernel calculation
![Figure 2.2. Transformer failure factor frequency [34]](https://thumb-ap.123doks.com/thumbv2/azdokorg/10954509.0/23.918.219.758.481.785/figure-2-2-transformer-failure-factor-frequency-34.webp)
![Figure 2.4. Illustration of different mechanical conditions of transformer winding structure, taken from [8], [41]-[44], [109]](https://thumb-ap.123doks.com/thumbv2/azdokorg/10954509.0/26.918.249.703.109.308/figure-illustration-different-mechanical-conditions-transformer-winding-structure.webp)
![Figure 2.6. Impact of different levels of the buckling on V-I locus diagram [80]](https://thumb-ap.123doks.com/thumbv2/azdokorg/10954509.0/31.918.298.683.106.385/figure-impact-different-levels-buckling-v-locus-diagram.webp)
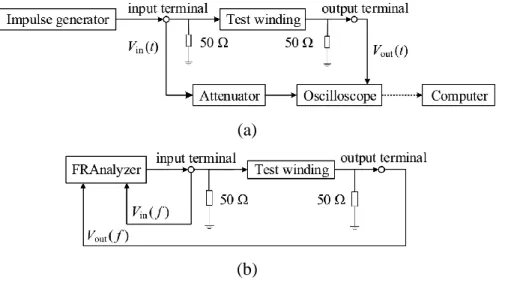
![Figure 3.1. FRA test setup: (a) off-line mode and (b) online mode, taken from [110]](https://thumb-ap.123doks.com/thumbv2/azdokorg/10954509.0/35.918.276.710.110.521/figure-fra-test-setup-line-mode-online-taken.webp)
![Figure 3.2. Example of FRA signature of the three-phase transformer with frequency sub-bands indicated, taken from [117]](https://thumb-ap.123doks.com/thumbv2/azdokorg/10954509.0/36.918.304.710.108.395/figure-example-signature-phase-transformer-frequency-bands-indicated.webp)
