Michele Low Yen Wen
Bachelor of Science with Honours (Cognitive Science) 2020
ACHIEVEMENT GOAL ORIENTATION AND MATH ANXIETY
AMONG UNIMAS UNDERGRADUATE STUDENTS
UNIVERSITI MALAYSIA SARAWAK
Grade: _____________
Please tick one
Final Year Project Report ☒
Masters ☐
PhD ☐
DECLARATION OF ORIGINAL WORK This declaration is made on the 30 day of JULY year 2020.
Student’s Declaration:
I, MICHELE LOW YEN WEN , 61414, FACULTY OF COGNITIVE SCIENCES AND HUMAN DEVELOPMENT, hereby declare that the work entitled, ACHIEVEMENT GOAL ORIENTATION AND MATH ANXIETY AMONG UNIMAS UNDERGRADUATE STUDENTS is my original work.
I have not copied from any other students’ work or from any other sources with the exception where due reference or acknowledgement is made explicitly in the text, nor has any part of the work been written for me by another person.
30 JULY 2020
MICHELE LOW
MICHELE LOW YEN WEN (61414) Supervisor’s Declaration:
I, NUR FATIHAH MAT YUSOFF , hereby certify that the work entitled, ACHIEVEMENT GOAL ORIENTATION AND MATH ANXIETY AMONG UNIMAS UNDERGRADUATE STUDENTS was prepared by the aforementioned or above mentioned student, and was submitted to the
“FACULTY” as a *partial/full fulfillment for the conferment of BACHELOR OF SCIENCE WITH HONOURS (COGNITIVE SCIENCE), and the aforementioned work, to the best of my
knowledge, is the said student’s work
Received for examination by: _______________________________ Date: 30 JULY 2020 (NUR FATIHAH MAT YUSOFF)
I declare this Project/Thesis is classified as (Please tick (√)):
☐ CONFIDENTIAL (Contains confidential information under the Official Secret Act 1972)*
☐ RESTRICTED (Contains restricted information as specified by the organisation where research was done)*
☒ OPEN ACCESS
I declare this Project/Thesis is to be submitted to the Centre for Academic Information Services (CAIS) and uploaded into UNIMAS Institutional Repository (UNIMAS IR) (Please tick (√)):
☒ YES
☐ NO
Validation of Project/Thesis
I hereby duly affirmed with free consent and willingness declared that this said Project/Thesis shall be placed officially in the Centre for Academic Information Services with the abide interest and rights as follows:
• This Project/Thesis is the sole legal property of Universiti Malaysia Sarawak (UNIMAS).
• The Centre for Academic Information Services has the lawful right to make copies of the Project/Thesis for academic and research purposes only and not for other purposes.
• The Centre for Academic Information Services has the lawful right to digitize the content to be uploaded into Local Content Database.
• The Centre for Academic Information Services has the lawful right to make copies of the Project/Thesis if required for use by other parties for academic purposes or by other Higher Learning Institutes.
• No dispute or any claim shall arise from the student himself / herself neither a third party on this Project/Thesis once it becomes the sole property of UNIMAS.
• This Project/Thesis or any material, data and information related to it shall not be distributed, published or disclosed to any party by the student himself/herself without first obtaining approval from UNIMAS.
Student’s signature:
MICHELE LOW
Supervisor’s signature: ________________Date: 30 JULY 2020 Date: 30 JULY 2020 Current Address:
UNIVERSITI MALAYSIA SARAWAK
94300 KOTA SAMARAHAN, SARAWAK MALAYSIA
Notes: * If the Project/Thesis is CONFIDENTIAL or RESTRICTED, please attach together as annexure a letter from the organisation with the date of restriction indicated, and the reasons for the confidentiality and restriction.
ACHIEVEMENT GOAL ORIENTATION AND MATH ANXIETY AMONG UNIMAS UNDERGRADUATE STUDENTS
MICHELE LOW YEN WEN
This project is submitted
in partial fulfilment of the requirements for a Bachelor of Science with Honours
(Cognitive Science)
Faculty of Cognitive Sciences and Human Development UNIVERSITI MALAYSIA SARAWAK
(2020)
The project entitled ‘ACHIEVEMENT GOAL ORIENTATION AND MATH ANXIETY AMONG UNIMAS UNDERGRADUATE STUDENTS ’ was prepared by Michele Low Yen Wen and submitted to the Faculty of Cognitive Sciences and Human Development in partial fulfillment of the requirements for a Bachelor of Science with Honours (Cognitive Science).
Received for examination by:
--- (NUR FATIHAH MAT YUSOFF)
Date:
30th July 2020
---
Grade
A
i
ACKNOWLEDGEMENTS
First of all, praises and thanks to the God, the Almighty, for showering me strength and courage throughout my research work to complete the final year project successfully.
I would also like to express my sincere appreciation to my supervisor, Madam Nur Fatihah Mat Yusoff for her patience, valuable guidance and effort in assisting me throughout the research. I am thankful for her dedication and encouragement which have deeply motivate and inspire me.
Last but not least, I would also like to express my acknowledgement to my family members and friends for their unconditional love, caring and encouragement. Without their support, I will not be able to complete this research successfully.
ii
TABLE OF CONTENTS
LIST OF TABLES ... iii
LIST OF FIGURES ... iv
ABSTRACT ... v
ABSTRAK ... vi
CHAPTER ONE ... 1
CHAPTER TWO ... 10
CHAPTER THREE ... 23
CHAPTER FOUR ... 33
CHAPTER FIVE ... 45
REFERENCES ... 53
APPENDIX ... 59
iii
LIST OF TABLES
Table 1. Definition of Term ... 7
Table 2. Summary of Questionnaire ... 26
Table 3. Cronbach’s Alpha value for the variables ... 28
Table 4. Skewness and Kurtosis Test of Normality ... 32
Table 5. Distribution of Respondent ... 33
Table 6. Distribution of Respondent based on Gender ... 34
Table 7. Distribution of Respondent based on Races ... 35
Table 8. Distribution of Respondent based On Year ... 36
Table 9. Distribution of Respondent based on Faculty ... 37
Table 10. Distribution of Respondent based on CGPA ... 39
Table 11. Pearson correlation of mastery goal and math anxiety ... 40
Table 12. Pearson correlation of performance avoidance goal and math anxiety ... 41
Table 13. Pearson correlation of performance approach goal and math anxiety ... 42
Table 14. Mean and standard deviation of UNIMAS undergraduate students based on gender ... 43
Table 15. Independent T-test of Gender and Math Anxiety ... 43
Table 16. Research Result ... 50
iv
LIST OF FIGURES
Figure 1.Conceptual Framework ... 6
Figure 2.Cycle of Math Avoidance Model... 12
Figure 3. Trichotomous Model of Achievement Goal ... 16
Figure 4. 2 X 2 Model of Achievement Goal ... 18
Figure 5. Boxplot for Mastery Goal ... 29
Figure 6. Boxplot for Performance - Approach Goal ... 29
Figure 7. Boxplot for Performance - Avoidance Goal ... 30
Figure 8. Boxplot for Math Anxiety... 30
Figure 9. Bar Graph of Respondent Distribution based on Races ... 35
Figure 10. Bar Graph of Respondent Distribution based on Year ... 36
Figure 11. Bar Graph of Respondent Distribution based on Faculty ... 37
Figure 12. Bar Graph of Respondent Distribution based on CGPA ... 39
v ABSTRACT
The purpose of present study was to investigate the relationship between achievement goal orientation and math anxiety. Different types of achievement goals (mastery goal,
performance approach goal and performance avoidance goal) were explored in this study.
Besides, the difference in math anxiety between gender was also explored. Questionnaire was chosen as our instrument to collect data and the sample of present study involved a total number of 400 UNIMAS undergraduate students. The questionnaire used in this study
included Achievement Goal Questionnaire Revised (ACQ-R) and Math Anxiety Rating Scale (MARS). Quantitative and cross-sectional design was used in this study. Independent t-test was used to compare the difference in math anxiety between male and female and the Pearson’s correlation was used to determine the relationship between the achievement goal orientation and math anxiety. Present finding showed that there was no significant difference in math anxiety between gender. Moreover, present finding proved that mastery goal had positive relationship with math anxiety and performance approach goal had negative
relationship with math anxiety. Moreover, it also found that performance avoidance goal was not correlated with math anxiety.
Keywords: achievement goal orientation, math anxiety, UNIMAS undergraduate students
vi ABSTRAK
Kajian ini bertujuan untuk mengkaji hubungan antara orientasi matlamat pencapaian dan kebimbangan matematik. Pelbagai jenis tujuan pencapaian (tujuan penguasaan, matlamat pendekatan prestasi dan matlamat penghindaran prestasi) telah diterokai dalam kajian ini.
Selain itu, perbezaan kebimbangan matematik antara jantina juga diterokai. Soal selidik dipilih sebagai instrumen kami untuk mengumpulkan dan sampel kajian ini melibatkan sejumlah 400 pelajar sarjana UNIMAS. Reka bentuk kuantitatif dan keratan rentas digunakan dalam kajian ini. Ujian-t bebas digunakan untuk membandingkan perbezaan kebimbangan matematik antara lelaki dan perempuan dan korelasi Pearson digunakan untuk menentukan hubungan antara orientasi matlamat pencapaian dan kebimbangan matematik. Hasil kajian menunjukkan bahawa tidak ada perbezaan yang signifikan dalam kebimbangan matematik antara jantina. Selain itu, kajian ini membuktikan bahawa tujuan penguasaan mempunyai hubungan positif dengan kebimbangan matematik dan tujuan pendekatan prestasi mempunyai hubungan negatif dengan kebimbangan matematik. Selain itu, kajian ini juga mendapati bahawa tujuan penghindaran prestasi tidak berkaitan dengan kebimbangan matematik.
Kata kunci: orientasi matlamat pencapaian, kebimbangan matematik, pelajar sarjana UNIMAS
1
CHAPTER ONE INTRODUCTION Background of Study
Mathematical comprehension is usually seen as essential to career success and effective day-to-day personal management (Jain & Dowson, 2009). Mathematics is therefore seen as a core discipline in education across primary to higher education (Baloglu & Kocak, 2006). Additionally, achievement in mathematics is an important element in decisions affecting the placement, selection and admission of students across most education systems (Nasser & Birenbaum, 2005). A growing, economically competitive world demanded change in math education. The need to understand mathematics is important with the increasing use of computer technology.
However, math anxiety is one of the main issues for several students. It is a key issue that can influence on learning and performance in mathematics and thus may adversely affect students’ education, career and overall future (Jain & Dowson, 2009). As mentioned by Richardson and Suinn (1972), "mathematical anxiety includes the feelings of stress and anxious which implies with numerical manipulation and mathematical problem solving in general and academic contexts." Math anxiety can be described as a situation where students experience discomfort when they have mathematical task to perform (Jain & Dowson, 2009).
Nowadays, mathematics become a significant challenge for youngsters as they have negative attitude toward the mathematics. This situation is known as math anxiety (Geist, 2010). Moreover, he emphasised that an anti-anxiety curriculum is necessary as this can help students to build their confidence while performing mathematical task, particularly as more students are encouraged to go to fields of science, technology, engineering and mathematics (STEM). Thus, it is crucial to help students recognise and resolve their problem so that they
2
can deal and overcome these anxieties that would otherwise adversely affect their potential decision-making in education and career.
According to achievement goal theory, there are several purposes for students to participate and showing low participation in education (Patrick, Kaplan, & Ryan, 2011). In the trichotomous model of achievement theory, three subgroups of goal orientation have been studied: mastery orientation, performance-approach orientation, and performance-avoidance orientation (Skaalvik, 2018). Students espousing mastery goal are emphasising to gain new knowledge and improve their capability and skill. Students espousing performance- approach orientation are concerning whether they could surpass others and demonstrate competence whereas students with performance avoidance goal focusing on covering their incompetence to other people so that they can prevent negative perception from others toward them
(Skaalvik, 2018). Previous studies repeatedly indicate that these goal orientations have effect on the achievement, emotion and behaviour of the student (Meece, Anderman & Anderman 2006). Therefore, investigating the relationship between achievement goal orientation and math anxiety among UNIMAS undergraduate student is the purpose of present study. The association of the achievement goal orientation (mastery goal, performance - approach goal and performance - avoidance goal) with math anxiety will be explored. These findings will help to enhance the understanding of mathematics learning with respect to math anxiety.
3 Problem Statement:
The need for specialists in science, technology, engineering and mathematics (STEM) is increasing globally. To accommodate this demand adequately, many governments and private companies have updated STEM education and facilitated training to enhance math and science skills among students and employees (Foley, Herts, Borgonovi, Guerriero, Levine, & Beilock, 2017). Learning and training programs usually concentrate on increasing the understanding of mathematics and science among individuals.
Mathematics proficiency is a major advantage for industrialized nations. Evidence from laboratory studies and major international assessments show that fear or apprehension of mathematics, mathematical anxiety, should also be taken into account when attempting to improve mathematical achievement and STEM career performance (Foley et al., 2017).
However, many people choose to avoid math and math-related occupations as they become anxious while doing math tasks (Maloney & Retanal, 2020). Consequently, people with mathematical anxiety have the restriction on choosing their earning opportunity and potential work prospect (Maloney & Retanal, 2020). The lack of skill people to participate in the fields of STEM, will cause negative effects to the country as society are becoming more
technologically based (Beilock & Maloney, 2015). Globally, increased mathematical anxiety is associated with reduced mathematical efficiency and this is not limited to academic
circumstances (Foley et al., 2017). For example, math-anxiety nurse who have math anxiety will have poor dosage calculations, women with math-anxiety have the tendency to
participate in poor financial management, and people with math-anxiety are poor in analysing health statistic.
Considering that math-anxiety has significant negative effects to people's everyday lives, it is important to understand math anxiety and solve this problem. However, most of the
4
past studies about math anxiety are only emphasised on the relationship of math anxiety with the achievement of student in mathematics (Maloney & Retanal, 2020). Achievement goal orientation is one of the motivational structures that plays a significant role in assessing student success in learning. The application of a certain goal instruction contributes to multiple learning outcomes (Rameli & Kosnin, 2002). However, there are only less research about the relationship of math anxiety with the different achievement goal orientation (Skaalvik, 2018). Moreover, inconsistent results were found in the relationship of performance - approach goal and math anxiety (Skaalvik, 2018). Thus, conducting the research to explore the relationship of different achievement goal orientation (mastery goal, performance - approach goal and performance - avoidance goal) with math anxiety is beneficial and crucial.
5 General Objective:
The main purpose of present study is to investigate the relationship between achievement goal orientation with math anxiety among UNIMAS undergraduates in University Malaysia Sarawak.
Research Objective:
1. To investigate the relationship between mastery goal and math anxiety
2. To investigate the relationship between performance approach goal and math anxiety 3. To investigate the relationship between performance avoidance goal and math anxiety 4. To investigate the difference in math anxiety between male and female
Hypothesis:
H1: There is significant relationship between mastery goal with math anxiety
H2: There is significant relationship between performance - approach goal with math anxiety H2. There is significant relationship between performance - avoidance goal with math anxiety H3. There is significant difference in math anxiety between male and female
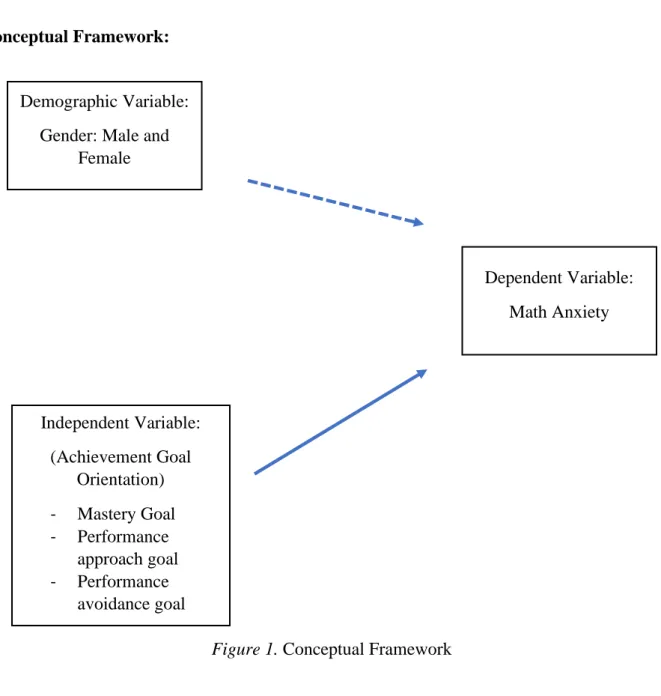
6 Conceptual Framework:
Represent Difference Represent Correlation Demographic Variable:
Gender: Male and Female
Independent Variable:
(Achievement Goal Orientation) - Mastery Goal - Performance
approach goal - Performance
avoidance goal
Dependent Variable:
Math Anxiety
Figure 1. Conceptual Framework
7 Table 1
Definition of Term
Term Conceptual Definition Operational Definition Math anxiety The discomfort feeling that
experienced by students when they are performing mathematical
calculations is characterised as math anxiety. (Cemen, 1987). Moreover, the students will experience stress and apprehension. This situation will disrupt the numerical manipulation as well as mathematical resolutions (Richardson and Suinn, 1972).
Math Anxiety Rating Scale (MARS) was used to evaluate math anxiety. This MARS was built by
Richardson and Suinn (1972). Higher mean scores indicate higher math anxiety level.
Mastery goal Students with mastery goal concentrate solely on the mission rather than any extrinsic incentives and their goal is to learn, understand and solves problems (Nicholls, 2017)
Mastery goal in this study was measured by using Achievement Goal Questionnaire-Revised (ACQ-R) developed by Ratsameemonthon (2015).
Performance- approach goal
Students with performance-approach goal concentrate on showing their capability and they want to achieve better than others (Skaalvik, 2018).
Achievement Goal Questionnaire-Revised (ACQ-R) developed by Ratsameemonthon (2015)
8
was used to measure
performance-approach goal.
Performance- avoidance goal
Students with performance-avoidance goal concentrate on covering their incompetence to other people so that they can prevent negative perception from others toward them (Skaalvik, 2018).
Achievement Goal Questionnaire-Revised (ACQ-R) developed by Ratsameemonthon (2015) was used to measure performance-avoidance goal.
9 Significance of Study
This study is beneficial for the students who have the problem with math anxiety. With the finding, this serves as a recommendation for the students to cope with their math anxiety.
Moreover, this study can also serve as a guideline for the educators on how to deal with students with math anxiety. This study can be served as a reference for the future study in concern to the relationship between achievement goal orientation with math anxiety. Apart from that, this study also can make contribution to STEM education as it can serve as a guideline to solve math anxiety among students so that more students will take part in STEM related field. Moreover, this research informs other educators to identify that achievement goal orientation is important in education.
10
CHAPTER TWO LITERATURE REVIEW
Math Anxiety
Math anxiety typically refers to tension or fear of mathematic, which inhibits a student from understanding mathematic related topic (Gurefe & Bakalim, 2018). Math anxiety is described as feeling of discomfort, apprehension or fear that faced by most of the people when they engage in mathematics (Ashcraft, 2002). Bessant (1995) describes math anxiety as a negative mindset towards mathematic learning, fear of failure and loss of self- confidence. Math anxiety is not just about fear of mathematic, but it will cause
disappointment, pressure, fear, mental disturbance, helplessness, frustration and anxiousness (Ma & Xu, 2004). Most people describe math as the punishment or major stressor (Gurefe &
Bakalim, 2018). Furner and Gonzalez-DeHass (2011) stated that they seem to be nervous when are going for a math test (math test anxiety), they even feel panic when faced with some sort of computational exercise (number anxiety). Some students also feel fear when taking math classes and this can occur at primary, secondary or university levels (math course anxiety). It is stated that the learning output decreases to its lowest level when the anxiety reaches its highest level (Furner & Gonzalez-DeHass, 2011). Thus, it can be said that math anxiety causes severe effect on learning.
Math anxiety does not have particular cause, it was due to the several different causes, including truancy, low self-image, poor management skills and focus on learning
mathematics without understanding its context. Zakaria and Nordin (2008) also claimed that teaching methodologies were the key cause of mathematical anxiety. This is because math classes did not foster comprehension and reasoning. The issues with mathematical anxieties will not be solved until lecturers applied problem-solving process to the teaching of
11
arithmetic and mathematics (Zakaria & Nordin, 2008). Butterworth (1999) stated that lack of understanding is the factor of anxiety and avoidance, and he suggested that understanding based learning is more efficient than drill and practice. Stuart (2000) stated that lack of confidence when work with mathematical situations is the cause of anxiety in mathematics.
Student with higher math anxiety are less fluent in computing and mathematics, and they are less likely to discover particular approaches and relationships within the field of mathematics (Zakaria & Nordin, 2008). Thus, lecturer is encouraged to build a healthy, tension-free learning environment and make sure it is free from embarrassment or humiliation so that the mathematic anxiety can be reduced (Zakaria & Nordin, 2008).
Math Avoidance Model’s Cycle
According to the math avoidance model’s cycle, Pries and Biggs (2001) stated thatthe individual will response toward the math circumstances negatively in the first stage. These may arise from previous bad mathematics experiences. This direct to the second stage that causes the individual to avoid mathematics circumstances. Thus, it causes poor preparation of mathematics in stage three, which leads them to perform poorly in mathematics in stage four.
It causes more negative mathematics experiences, and it takes them back to the first stage.
The loop can be repeated frequently and never broken that the individual with math anxiety is persuaded that he cannot do mathematics. Biological studies of math anxiety have shown that individual with math anxiety have insufficient inhibition mechanism at which their working memory are occupied and distracted by unrelated tasks. Students who do not perform well in assessments and examinations claim to be confused, cannot concentrate on their task. This is because they keep worrying about their poor performance in mathematics (Mutodi &
Ngirande, 2014). Math anxiety causes interference on the working memory, affects its productivity as well as the accuracy.
12 Gender and Math Anxiety
Most of the studies have found that women have higher rates of math anxiety as compared to men (Ramirez, Shaw & Maloney, 2018).Nonetheless, there are also some studies that have not found gender difference in math anxiety (Ramirez, Shaw & Maloney, 2018). However, it does appear that there are gender gaps when analyzing math anxiety on a wide scale. Stoet, Bailey, Moore and Geary (2016) have conducted a research to assess the high school students about their math anxiety. This involved 761,655 participants across 68 PISA participating countries. They found that women participants experienced more
mathematical anxiety than men, and mathematical anxieties and gender gap were broadened as the country increased in economic growth. Similarly, researchers also noted that in the 2003 PISA Gender Equality and Mathematics Anxiety data, girls in more gender equal countries had comparatively higher rates of math anxiety compared with boys in more gender-equal countries (Else-Quest Hyde & Linn, 2010). This is because higher gender equility and lower power distance would encourage girls to compare themselves with boys
Mathematics Avoidance Negative Mathematics
Experience
Poor preparation Poor Mathematics
Performance
Figure 2. Math Avoidance Model’s Cycle
13
more than in circumstances of lower gender equality and greater power distance. The
increased between sex-comparisons will cause the increasing of math anxiety among girls in gender-equal countries and this contribute to greater gender differences.
To now, the issue about women have higher rates of math anxiety as compared to men has not been addressed decisively. However, study have shown that the differences in math anxiety among between male and female are due to the differences of spatial processing capability among gender (Stoet, Bailey, Moore & Geary, 2016). Spatial processing is
important in mathematics (Cheng & Mix, 2014). However, the spatial processing of female is poor as compared to male. Thus, they are more worried about math as compared to male.
Ashcraft (2002) hypothesized that there might be a gender gap in math anxiety as women report anxiety more comfortably compared to men. The social stereotype of female cannot achieve better than male in math has caused the gender gap in math anxiety (Beilock, Rydell,
& McConnell, 2007). Goetz, Bieg, Lüdtke, Pekrun and Hall (2013) have conducted a study to examine the differences in trait level of the students among gender by using questionnaires.
The result found supported this social stereotype as well. They stated that female have higher math anxiety as compared to male. However, when the math anxiety test was conducted before and during the examination, female student did not show more symptoms of math anxiety than male student. This showed that the disparity between trait and state math anxiety is greater among student with weak mathematical conception and those who endorsed
traditional gender stereotypes that mathematics is dominated by men (Bieg, Goetz, Wolter, &
Hall, 2015).
14 Achievement Goal Orientation Theory
“Achievement goal orientation proposed within the principles of Social Cognitive Theory of Motivation (SCTM) is a view of human agency in which individuals are agents proactively engaged in their own development including a possession of self-confidence to guide their performance” (Bandura, 1986). According to Ratsameemonthon (2015),
achievement goal orientation defined as a motive factor for the person to control their actions so that they can achieve their goals. According to this theory, it stated that there are several motives for the students to make decision on their engagement in learning activity and they have the different evaluation standards for the result of this activity.
Throughout the late 1970s and early 1980s, this theory was emphasised on mastery goal and performance goal (Federici, Skaalvik, & Tangen, 2015). Mastery goal can be also known as task goal in which students are emphasise on the task. Students espousing mastery goal are concerning more to learn new skills and improve their understanding and capability.
They believe that their intellect is malleable and can be enhanced. Thus, they use their internal referencing of their successful result in previous condition to control their behaviour so that they can complete their goal. While students with performance goal are confidence that their intellect and performance are fixed. Thus, they use external comparison by focusing more on proving themselves, how they compare and perceived by others in order to motivate themselves to achieve their goal. According to Furner and Gonzalez-DeHass (2011) students with mastery goal tend to seek out challenges, view difficulties as a chance to learn. They are more intrinsically motivated and persist in the face of obstacle. On the contrary, students with performance goal are less intrinsically motivated. They view mistake as indicative of failure and tend to avoid challenges.
15 Trichotomous Model of Achievement Goal
However, inconsistent results are found in terms of performance goal. Thus, Elliot and Murayama (2008) stated that performance goal should be split into the categories of approach and avoidance as they may cause both bad and good effects on the achievement- relevant processes and results. They have been characterised between performance-approach goal and performance-avoidance goal. Students endorsing performance-approach goal focusing on surpassing others and demonstrating competence whereas students endorsing performance-avoidance goal focusing on avoiding showing competence as they are fearful of others opinion toward them. Thus, they prefer to conceal their relative incompetence to others (Skaalvik, 2018). This distinction resulted in mastery goal, performance-approach goal, and performance-avoidance goal. In this trichotomous model, students with mastery goal are more intrinsically motivated and have higher self-regulation in learning. Besides, it views learning tasks as challenges and it is negatively linked to test anxiety. Performance-approach goal has positive relation with test performance, commitment and dedication when studying.
Although students with performance-approach goal view learning tasks as challenges, but they are effective in using strategy and intrinsically motivation. However, it was also related to help-seeking behaviour avoidance, surface processing strategy, fearful of lose and test. The performance-avoidance goal makes students viewing achievement situation as a risk instead of a chance with small probability of lose. Moreover, performance-avoidance goal is
positively linked to fearful of lose and test as students do not organise their study and use of strategy properly. They always procrastinate and process the information shallowly. The performance-avoidance goals make students assuming learning tasks as risks. Thus, it causes students to have low grade in their examination result, as they are less intrinsically motivated, and they avoid seek for help when they are confusing (Furner & Gonzalez-DeHass, 2011).
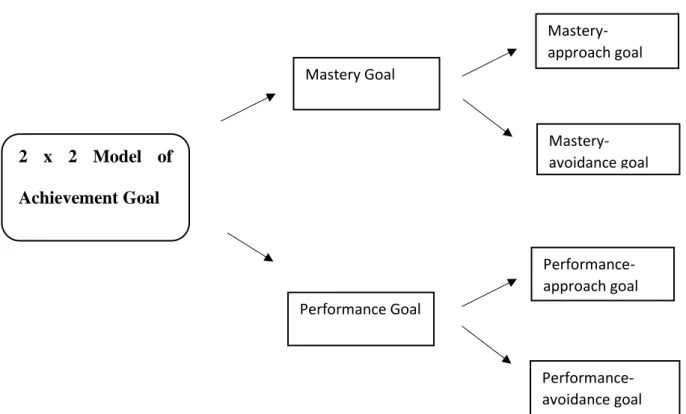
16 2 x 2 Achievement Goal Orientation Model
After distinguishing performance goals, the 2 X 2 model with approach-avoidance categorisations of mastery goal and performance goal was developed (Ratsameemonthon, 2015). Based on Ratsameemonthon’s (2015) study, mastery-approach goal is described as
“the competency development or task mastery achievement”. Individual who embrace mastery-approach are usually determined to improve their skill, ability and knowledge. They always make sure that they understand and master the knowledge so that they can achieve greater understanding (Elliot & Murayama, 2008). Thus, students with mastery approach tends to be more favourably linked to task engagement and intrinsic motivation than to academic result alone (Elliot & Murayama, 2008). While individual with mastery-avoidance goal is focusing on preventing self-referential or task-referential incompetence. Students espousing mastery-avoidance seek not to lose his skills and abilities. Thus, students with mastery avoidance might be related to improper learning style and negative self-motivational believes as they only concerned about not to behave inappropriately. Moreover, they might
Performance Goal Mastery Goal
Performance- approach goal
Performance- avoidance goal Trichotomous Model of
Achievement Goal
Figure 3. Trichotomous Model of Achievement Goal
17
tend towards depending help-seeking instead of applying adaptive help-seeking (Pintrich, 2000).
There are also two components of approach-avoidance to the performance goals.
Students espousing performance goal view wisdom as inherent aptitude and they are fearful of others’ negative opinion toward them. Students with either approach or avoidance
performance goal are also fear of failure but the way they react to fear of failure is different.
Students who endorse performance-approach goal conveys their fear of lose by increasing their capacity so that they can protect their amour-propre and get approved by other people.
Fear of lose therefore can motivate students to work harder to achieve high score. On the contrary, students who embrace performance-avoidance goal express their fear of lose and criticism of other people by delaying their completion of task or avoiding failure. Thus, individuals with performance-avoidance goal is closely linked with diminished academic performance and procrastination (Ratsameemonthon, 2015).
However, Elliot and McGregor (2001) found that the pattern for mastery in the form of avoidance was more negative than approach in terms of their pattern but was more positive as compared to performance-avoidance goal. This result showed that avoidance goals were related to premises of fear of lose. It means that there is a propensity to suffer from
nervousness or panic attack in evaluative situations as failure is associated with undesired outcomes. Students with these avoidance goals are linked to low self-determination too. The implications included disorganised study and anticipatory test anxiety. Mastery-avoidance goal, though, give some positive qualities as students would adopt performance-approach goal as well as mastery-approach goal later. As performance-avoidance goal predicted examination achievement negatively, this goal was known as the main regulatory weakness in accomplishment setting (Elliot & McGregor, 2001). The fear of lose and its relation with
18
achievement goal was further explored. It was found that fear of lose had strong predictions for the mastery-avoidance goal and performance-avoidance goal, while it is a weaker predictor for the performance-approach goal. In specific, these avoidance goals had strong relationship with feelings of embarrassment and humiliation. They also found that the fear of lose caused the students biased towards the avoidance achievement goals.
Mastery Goal
Performance- approach goal 2 x 2 Model of
Achievement Goal
Performance Goal
Performance- avoidance goal
Mastery- approach goal
Mastery- avoidance goal
Figure 4. 2 x 2 Model of Achievement Goal
19
Past Research about Achievement Goal Orientation
Previous study consistently indicate that mastery goal has relationship with variety of adaptive cognitive, motivational and behavioural effects, for example lower anxiety levels, integrated learning approaches such as help seeking behaviour, and recognition of the importance of education (Skaalvik, 2018). The mastery-approach goal is linked to intrinsic motivation and deep processing, while mastery-avoidance goal is linked to disorganised study and test anxiety. Performance-approach goal concerning shallow processing while
performance-avoidance goal has positive relationship with test anxiety and negative
relationship intrinsic motivation, test performances (Skaalvik, 2018). Performance-avoidance is consistently linked to test anxiety, and the ‘worry component’ in anxiety may weaken the performance of the exam (Ryan, Ryan, Arbuthnot, & Samuels, 2007). But, some findings of the study indicate that mastery-avoidance goal is related with cognitive anxiety and fear of lose. These findings propose that “the emotional cost of adopting mastery-avoidance goals might be higher and even more substantial as compared with the adoption of performance- avoidance goals, wherein there is clear evidence of their detrimental effects on achievement and affect” (Furner & Gonzalez-DeHass 2011).
20 Achievement Goal Orientation and Math Anxiety
There are only few researches have been explored on the relation between math anxiety with the four achievement goal orientations. In Bong’s (2009) study, he found that primary and secondary students who engaged with either mastery-avoidance, performance- avoidance or performance-approach goals will encounter higher level of math anxiety.
Among these three goals, mastery-avoidance goal cause the highest level of math anxiety. In combating help-seeking avoidance and text anxiety faced by students, the mastery-approach seemed especially useful for the students who deal with the competitive and ability-focused learning environment. Putwain and Daniels (2010) have researched to examine how the achievement goals moderate the test anxiety and competency belief in mathematic students of secondary school in England. Interestingly, they found that all the four achievement goals have weak to moderate association with uneasiness about the consequences of examination and students will experience hand tremor throughout the examination. However, both the avoidance goals depict the slightly stronger effect as compared to both the approach goals. In addition, student who espousing mastery avoidance goal and at the same time having lower competence believe in mathematic will suffer higher level of uneasiness thought.
Some of the past studies have investigated the relationship between the achievement goal of students with math anxiety by using the trichotomous framework. According to Skaavik (2018), they found that Norwegian students who endorsing performance approach- avoidance goals have relationship with the "emotionality" aspect of math anxiety. The math anxiety is used to reflect how anxious or tense a student might feel during math lesson. It is also found that these relationships were independent from the student perceived ability.
Similarly, Middleton and Midgley (1997) also obtained the similar result in which both the performance approach-avoidance goals of the sixth-grade students higher level of uneasiness thought as they were worrying that they cannot perform in the mathematic examination. The
21
Performance-avoidance goal is strongly linked to math anxiety as compared with performance-approach goal.
The relation of trichotomous achievement goal with motivational achievement of pupils in mathematical tasks was explored (Zusho, Pintrich & Cortina, 2005). The sense of uneasiness and tension that experienced by pupils when performing mathematical task was identified as anxiety. They found that performance-avoidance goal contributed to lower achievement score and competence level, and higher anxiety rates. On the other hand, performance-approach and mastery goals had positive effect on student engagement and awareness. Thus, researchers have claimed that "no one definite road with student achievement". They also affirmed the benefits of endorsing mastery goal as well as performance-approach goal to improve student enthusiasm and accomplishment.
Linnenbrink (2005) had done a research which concentrating only on the difference of mastery goal and performance-approach goal to examine the effect of classroom goal
condition and student personal goal on the motivation of 5th- and 6th-grade students on math task. It is found that the performance-approach goal has a positive relation with math test anxiety while mastery goal is not related to test anxiety. It is also found that the pattern of outcomes for personal goal of student favours the mastery goal. Then, students with mastery goal and performance-approach goal had higher achievement as they are willing to seek for help when they face problems. This personal goal will not have any influence on the effect of classroom goal structure. However, Linnenbrick (2005) stated that it is better if performance- avoidance could be included in this research in order to provide clearer description about the impact of personal and classroom achievement goals on motivation outcome of students.
In a nutshell, the achievement goal orientation associated with the math anxiety differently depending on the motivations or intentions of the student pursuing their goal.
22
Previous studies exploring the relationships between the achievement goal orientation and math anxiety have clearly shown us that the advantages of students pursuing mastery- approach goal. Moreover, the studies also highlight the negative consequences of students pursuing performance-avoidance goal.
23
CHAPTER THREE RESEARCH METHOD
Research Design
The research design that used for this study was quantitative design. The quantitative design method aimed to classify and count the features, contrast statistical models in attempts what was observed (McCusker & Gunaydin, 2015). This method is very effective in
collecting a large amount of data. According to McCusker and Gunaydin (2015), tools such as questionnaires or equipment are used in quantitative research designs to collect numerical data and all aspects of the research are carefully designed before data collection.
In this research, the questionnaire was distributed to the respondents that consisted of UNIMAS undergraduate students. The outcome of the data was analysed from the
questionnaire. In this research, correlational design is adopted to investigate the relationship between different variables. It is used to investigate the relationship between the dependent variable (math anxiety) with the independent variable (achievement goal orientation) and demographic variable (gender).
Population, Sampling Method and Sample Size
Population can be described as any group of individuals that share the common traits, while sample is explained as a part of the huge population (Zikmund, Carr, & Griffin, 2013).
In this research, the sample size was selected rather than population. This is because the target respondents of this research are UNIMAS undergraduate students, so population is not suitable for this research.
When the population consists of a variety of subgroups, or strata that may vary in the characteristics being studied, stratified random sampling is the appropriate method (Ary,
24
Jacobs, Sorensen & Razavieh, 2010). Thus, stratified random sampling method was used in this research. In stratified random sampling, the strata of interest must be first identified and then a specified number of subjects from each stratum will be randomly drawn. In this
research, the UNIMAS undergraduate student population was divided into 2 subgroups based on gender, which were male and female. Then, the respondent was selected randomly from each of the subgroups.
Based on the UNIMAS official website, there are 13,517 undergraduate students in Universiti Malaysia Sarawak (UNIMAS). Slovin’s formula is employed to determine the sample size required for this research, as shown below:
𝑛 = 𝑁 (1 + 𝑁𝑒2)
Where,
n = Sample size
N = Size of the population
e = The proportion of sampling error or 0.05 Source: Tejada & Punzalan, 2012
Sample size = 13,517
1+(13,517 ×0.052)
= 389 respondents
According to the calculation, the appropriate minimum sample size is 389 respondents.
Hence, a total number of 400 UNIMAS undergraduate students were involved in this study.
25 Research Instrument
Questionnaire was used as research instrument to collect the data. The questionnaire was prepared in Malay and English language. The questionnaire was divided into 3 sections containing Section A, Section B and Section C. In Section A, there were 5 questions
regarding the demographic variable of the respondents such as gender. In Section B, it consisted of 12 questions that are related to the independent variable such as student
achievement goal of the respondent. While in Section C, it consisted of 30 questions and it is about the dependent variable such as the scale of math anxiety of the respondents.
Achievement Goal Questionnaire Revised (ACQ-R). Achievement Goal
Questionnaire (ACQ) was originally developed by Elliot and Murayama (2008). ACQ-R, a revised version by Ratsameemonthon (2015) to rectify some problems present in the original version of (ACQ). ACQ-R consisted of 12 items which are categorised into 4 achievement goal including mastery-approach orientation, mastery-avoidance orientation, performance- approach orientation and performance-avoidance orientation. Each of the questions is determined in five-point Likert Scales which is from 1 (Strongly Disagree) to 5 (Strongly Agree).
Math Anxiety Rating Scale (MARS). Math Anxiety Rating Scale (MARS) was developed by Richardson & Suinn (1972). It consisted of 30 items in measuring the math anxiety scale of the students. Each of the questions will be determined in five-point Likert Scales which is from 1 (Not at all) to 5 (Very much).
26 Table 2
Summary of Questionnaire
Section Title No. of
Measurement Items
Sources
A Demographic Data 5 -
B Achievement Goal
Questionnaire Revised (ACQ-R).
12 Ratsameemonthon, 2015
C Math Anxiety Rating Scale (MARS).
30 Richardson and Suinn, 1972
Total 47
For the Achievement Goal Questionnaire Revised (ACQ-R), the score is based on the five- point Likert Scales:
1 2 3 4 5
Strongly Disagree Disagree Neutral Agree Strongly Agree
For the Math Anxiety Rating Scale (MARS), the score is based on the five-point Likert Scales:
1 2 3 4 5
Not at all A little A fair amount Much Very much
27 Pilot Study
The validity and reliability are important elements in justifying the research outcome.
Before conducting for full research, pilot study was initiated by distributing the questionnaire to 50 respondents which are not the actual respondents of the research. The questionnaire was distributed through Google form to a total number of 50 second year student from 3 different faculty such as FSKPM, FEB, and FCSIT.
The reliability of a measuring instrument refers to the degree of consistency and accuracy with the actual measuring instrument. Cronbach’s Coefficient Alpha will be utilized to measure the reliability ranging from 0 to 1 for this research study. The reliability of the instrument will be considered as high if the alpha value is close to positive one (+1) (Fraenkel
& Wallen, 1993). If the value is 0.7 closer to 1.0, it means that the greater the internal
consistency in the scale. On the contrary, if the value is below 0.7, it indicates the result is not reliable or has poor reliability.
The collected questionnaire was analyzed by using SPSS (version 20) to determine the Cronbach’s Alpha Value. The result of reliability analysis showed that the Cronbach α for mastery goal, performance-approach goal, performance-avoidance goal and math anxiety are .802, .812, .817 and .962 respectively. Since all the values obtained are greater than 0.7, the questionnaire is reliable.
28 Table 3
Cronbach’s Alpha value for the variables
Variable N of item Cronbach’s Alpha
Mastery Goal 3 0.802
Performance Approach Goal 3 0.812
Performance Avoidance Goal 3 0.817
Math Anxiety Scale 30 0.962
Research Procedure
The research was conducted in University Malaysia Sarawak (UNIMAS). In the study, an online survey was used to distribute the questionnaire to the respondents. The target respondent are the undergraduate student studying in UNIMAS. The details of the research will be provided and attached along with the questionnaire. The details provided includes the research topic, purpose of the research, and the confidentiality of the respondent and the contact info of the researcher. The contact info was provided so that the respondent can contact the researcher when they have confusion in answering the survey. Online survey was selected to recruit respondent by using Google form as it is cost-saving and able to obtain huge sample. The questionnaire was uploaded and distributed via social media such as WhatsApp and Facebook. Respondents had to answer all the questions provided and submit the form after they have completed the questionnaire. After collecting the data, it was analysed by using Statistical Package for Social Science (SPSS) with version 20.
A screening process was done to ensure only UNIMAS undergraduate students take part in our study. The pros for using online survey are it can be distributed very fast and reached the participant from different faculty. However, the cons for online survey is, we
29
cannot immediately respond to participant when they have any confusion toward the questionnaire.
Data Screening
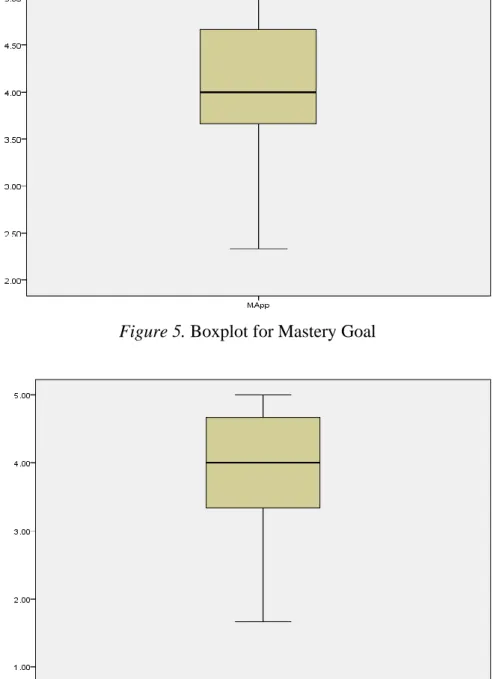
Figure 5. Boxplot for Mastery Goal
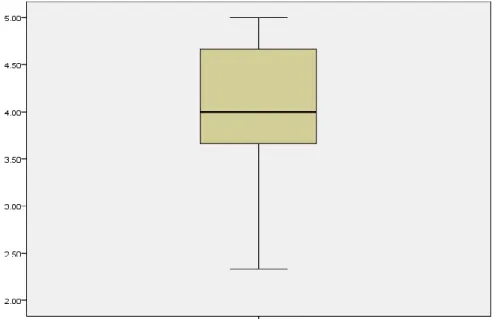
Figure 6. Boxplot for Performance-Approach Goal
30
Based on the figure 5 to figure 8, no outlier was found on the mastery goal, performance approach goal, performance avoidance goal and math anxiety. This is because all the variables were presented in five-point Likert Scales. Based on the scales given, the
respondents can only choose from 1 (Not at all) to 5 (Very much). On the other hand, there was no missing value in the data since all the questions given on the Google form were compulsory to be answered by the respondents.
Figure 7. Boxplot for Performance-Avoidance Goal
Figure 8. Boxplot for Math Anxiety
31 Data Analysis
Descriptive statistics and inferential statistics were used as the data analysis method in this research. The software used for statistical analysis is Statistical Package for Social
Science (SPSS) with version 20.
Descriptive statistic is a brief descriptive coefficient that summarize a given data set, which can be either a representation of the entire population or a sample of it (Pizarro, 2015).
Descriptive statistic is broken down into the measure of central tendency and measure of variability. Along with simple graphics analysis, the basis of every quantitative analysis of data was formed virtually. Descriptive statistic allows us to present the data in a more meaningful way, as it allows a simple interpretation of the data. In this study, descriptive analysis will be utilized to identify the respondents’ demographic profile.
Inferential statistic can be used to estimate the characteristic of the population (parameter) from the characteristic of sample (statistic). Inferential statistic allows us to test the hypothesis about population-based data obtained from the sample drawn from population.
Independent T-test is used to compare the means of two samples. It used to analyse the significant difference between the two variables. In the present study, Independent T-test is implemented to determine the significant difference between gender and math anxiety.
Pearson’s Correlation is used to determine the strength and the relationship among the variables. The Pearson’s correlation coefficient values can alter from -1.00 to +1.00. It depends on the positive correlation (+1.00) or negative correlation (-1.00) or no linear relationship (0.00) between two variables. The linear relationship between different goal- orientation and math anxiety can be determined by using Pearson’s correlation.
32 Normality Test
Table 4
Skewness and Kurtosis Test of Normality
Skewness Kurtosis
Mastery Goal -0.198 -0.596
Performance Avoidance Goal -0.410 -0.434
Performance Approach Goal -0.355 -0.735
Math Anxiety -0.384 -0.325
A normality test was performed to test the normality of the data from our study. The value of skewness represents the degree and direction of asymmetry while the value of kurtosis represents the heaviness of the distribution tails. Based on the result, questionnaire for mastery goal, performance-avoidance goal and performance-approach goal obtained the skewness value of -0.198, -0.410, -0.355 and kurtosis value of -0.596, -0.434, -0.735
respectively. While the questionnaire for math anxiety acquired the skewness value of -0.384 and kurtosis value of -0.325. The data is considered normally distributed when the skewness and kurtosis value are in the range between -1.0 and 1.0 (Brown, 2016). Hence, the skewness and kurtosis value on the table 4 showed that the questionnaire for achievement goal and math anxiety have normal distribution.
33
CHAPTER FOUR RESULTS Descriptive Analysis
Table 5
Distribution of Respondent
Demographic Backgrounds Frequency Percentage (%)
Gender Female 230 57.5
Male 170 42.5
Year of Study Year 1 72 18.0
Year 2 91 22.8
Year 3 189 47.3
Year 4 & above 48 12.0
Faculty FCSIT 47 11.8
FACA 14 3.5
FK 37 9.3
FSS 18 4.5
FEB 58 14.5
FSTS 35 8.8
FPSK 29 7.2
CLC 36 9.0
FBE 4 1.0
FCSHD 122 30.5
CGPA <2.0
2.0-2.5 2.51-3.0 3.01-3.5 3.51-4.0
1 12 72 167 148
0.3 3.0 18.0 41.8 37.0
34
Table 5 demonstrated the distribution of respondent based on selected demographic background which are gender, races, year of study, faculty and CGPA. The background distribution of 400 respondents were analysed in frequency and percentage.
Demographic Background
Respondent Analysis based on Gender Table 6
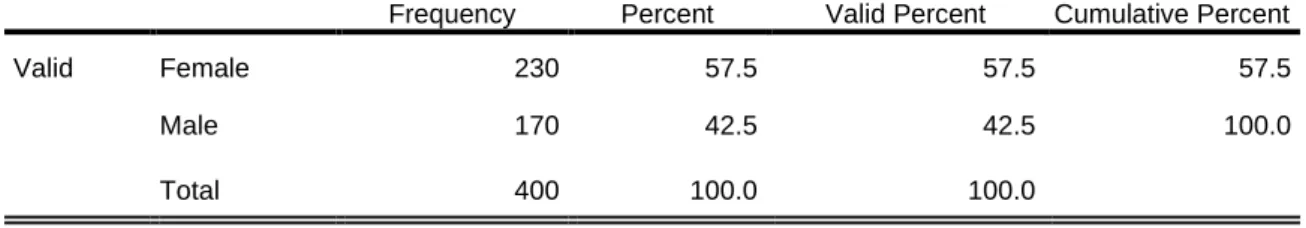
Distribution of Respondent based on Gender
Gender
Frequency Percent Valid Percent Cumulative Percent
Valid Female 230 57.5 57.5 57.5
Male 170 42.5 42.5 100.0
Total 400 100.0 100.0
This study involved 400 respondents in total. The number of female respondents is 230 while male respondents are 170 which corresponded to 57.5% and 42.5% of the total respondents respectively. The result shows that female respondent is greater compare to male respondent by 15%.
35 Respondent Analysis based on Races
Table 7
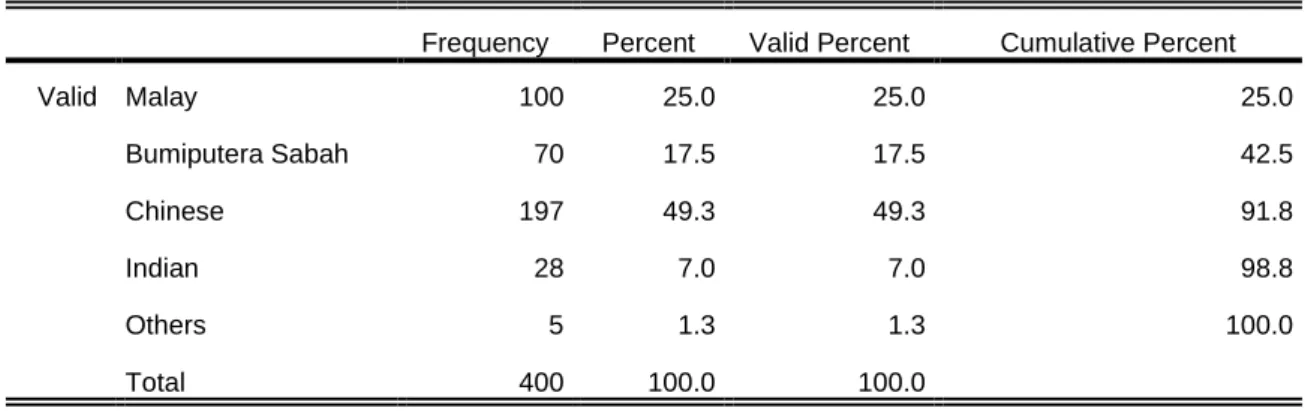
Distribution of Respondent based on Races
Figure 9. Bar Graph of Respondent Distribution based on Races
Table above indicates the distribution of respondents based on the races. Based on the table above, majority of the respondents were Chinese with a frequency of 197 respondents (49.3%). While Malay, Bumiputera Sabah & Sarawak and Indian had a frequency of 100 (25%), 70 (17.5%) and 28 (7%) respectively. Other races had the least frequency. There were only 5 respondents which equivalent to 1.3%.
Races
Frequency Percent Valid Percent Cumulative Percent
Valid Malay 100 25.0 25.0 25.0
Bumiputera Sabah 70 17.5 17.5 42.5
Chinese 197 49.3 49.3 91.8
Indian 28 7.0 7.0 98.8
Others 5 1.3 1.3 100.0
Total 400 100.0 100.0
36 Respondent Analysis based on Year
Table 8
Distribution of Respondent based on Year
Year
Frequency Percent Valid Percent
Cumulative Percent
Valid Year 1 72 18.0 18.0 18.0
Year 2 91 22.8 22.8 40.8
Year 3 189 47.3 47.3 88.0
Year 4 & above 48 12.0 12.0 100.0
Total 400 100.0 100.0
Figure 10. Bar Graph of Respondent Distribution based on Year
Table above shows the distribution of respondents based on the year of study. In the table above, the percentage of ‘Year 3’ students show the highest frequency of 189 respondents (47.3%) while the ‘Year 2’ students show the second highest frequency of 91 respondents (22.8%). The remaining respondents are ‘Year 1’ students with frequency of 72 respondents (18%) followed by ‘Year 4 and above’ students with frequency of 48
respondents (12%).
37 Respondent Analysis based on Faculty Table 9
Distribution of Respondent based on Faculty
Faculty
Frequency Percent Valid Percent
Cumulative Percent
Valid FCSIT 47 11.8 11.8 11.8
FACA 14 3.5 3.5 15.3
FK 37 9.3 9.3 24.5
FSS 18 4.5 4.5 29.0
FEB 58 14.5 14.5 43.5
FSTS 35 8.8 8.8 52.3
FPSK 29 7.2 7.2 59.5
CLC 36 9.0 9.0 68.5
FBE 4 1.0 1.0 69.5
FCSHD 122 30.5 30.5 100.0
Total 400 100.0 100.0
Figure 11. Bar Graph of Respondent Distribution based on Faculty
38
Table 9 shows the distribution of respondents based on faculty. Based on the graph above, majority of the respondents were from FCSHD which had a frequency of 122 or 30.5%. Then, FEB shows the second highest frequency of 58 respondents (14.5%), followed by FCSIT, FK, CLC, FSTS, FPSK, FSS and FACA. From FSCIT to FACA, the respondents who were involved in this research consisted of 47 respondents (11.8%), 37 respondents (9.3%), 36 respondents (9.0%), 35 respondents (8.8%), 29 respondents (7.2%), 18
respondents (4.5%) and 14 respondents (3.5%), While the FBE shows the least frequency as it only consisted of 4 respondents (1.0%).
39 Respondent Analysis based on CGPA
Table 10
Distribution of Respondent based on CGPA
CGPA
Frequency Percent Valid Percent
Cumulative Percent
Valid <2.0 1 .3 .3 .3
2.0 - 2.5 12 3.0 3.0 3.3
2.51 - 3.0 72 18.0 18.0 21.3
3.01 - 3.5 167 41.8 41.8 63.0
3.51 - 4.0 148 37.0 37.0 100.0
Total 400 100.0 100.0
Figure 12. Bar Graph of Respondent Distribution based on CGPA
Table 6 indicates the distribution of respondents based on the CGPA. In the table above, majority of the respondents have CGPA of 3.01 to 3.5 with frequency of 167
respondents (41.8%). While CGPA of ‘3.51-4.0’, ‘2.51-3.0’ and ‘2.0-2.5’ had a frequency of 148 (37.0%), 72 (18.0%) and 12 (3.0%) respectively. CGPA of ‘<2.0’ had the least frequency as it only consisted of 1 respondent which equivalent to 0.3%.
40 Inferential Statistics
Hypothesis 1
H01: There is no significant relationship between mastery goal and math anxiety Table 11
Pearson correlation of mastery goal and math anxiety
Correlations
MApp MA_Mean
MApp Pearson Correlation 1 -.218**
Sig. (2-tailed) .000
N 400 400
MA_Mean Pearson Correlation -.218** 1
Sig. (2-tailed) .000
N 400 400
**. Correlation is significant at the 0.01 level (2-tailed).
Pearson Correlation was used to determine if there was any relationship between mastery goal and math anxiety. In this correlation, the independent variable is mastery goal while the dependent variable is math anxiety. Based on table, the p value is 0.00. This shows that the p-value is smaller than the level of significant (p<0.05). Hence, the correlation is statistically significant and H01 is rejected. Thus, there is a significant relationship between mastery goal and math anxiety.
In the Pearson Correlation Coefficient, correlation value, r= - 0.218 revealed that there is a weak negative correlation between mastery goal and math anxiety which was significantly significant. (r= -0.218, p=0.00). It shows that students with higher mastery goal will have lower math anxiety.
For the 400 respondents, the relationship between mastery goal and math anxiety were weakly and significant correlated, r(400)= -.218, p= 0
41 Hypothesis 2
H02: There is no significant relationship between performance-avoidance goal and math anxiety Table 12
Pearson correlation of performance-avoidance goal and math anxiety
Correlations
PAv_Mean MA_Mean
PAv_Mean Pearson Correlation 1 .048
Sig. (2-tailed) .340
N 400 400
MA_Mean Pearson Correlation .048 1
Sig. (2-tailed) .340
N 400 400
Pearson Correlation was used to determine if there was any relationship between performance-avoidance goal and math anxiety. In this correlation, the independent variable is performance-avoidance goal while the dependent variable is math anxiety. Based on Table 12, the p value is 0.340. This shows that the p-value is higher than the level of significant (p>0.05). Hence, we failed to reject H02 as the p value is higher that the significant value and there is no significant relationship between performance avoidance goal and math anxiety.
For the 400 respondents, the relationship between performance avoidance goal and math anxiety were not significant correlated, r(400)= .048, p= .340
42 Hypothesis 3
H03: There is no significant relationship between performance-approach goal and math anxiety Table 13
Pearson correlation of performance-approach goal and math anxiety
Correlations
PAp MA_Mean
PAp Pearson Correlation 1 .178**
Sig. (2-tailed) .000
N 400 400
MA_Mean Pearson Correlation .178** 1
Sig. (2-tailed) .000
N 400 400
**. Correlation is significant at the 0.01 level (2-tailed).
Pearson Correlation was used to determine if there was any relationship between performance-approach goal and math anxiety. The independent variable is performance- approach goal while the dependent variable is math anxiety. Based on table, the p value is 0.00 This shows that the p-value is lower than the level of significant (p<0.05). Hence, the correlation is statistically significant and H03 is rejected. Thus, there is a significant relationship between performance-approach goal and math anxiety.
In the Pearson Correlation Coefficient, correlation value, r= 0.178 revealed that there is a weak positive correlation between performance approach goal and math anxiety which was significantly significant. (r= 0.178, p= 0.00). It shows that students with higher
performance approach goal will have higher math anxiety.
For the 400 respondents, the relationship between performance approach goal and math anxiety were weakly and significant correlated, r(400)= .178, p= 0