I hereby declare that this project report is based on my original work, except for quotations and citations duly acknowledged. In this project, the highest training accuracy of 73.3% and 68.4% was achieved for 2-level and 4-level anxiety classification, respectively, by including all 175 features.
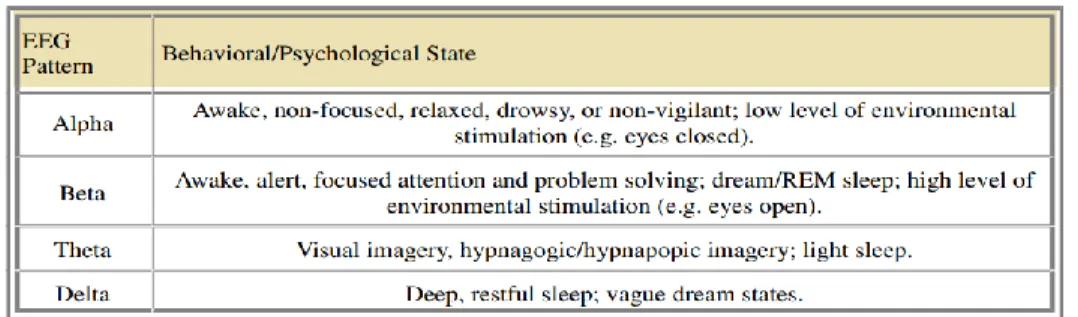
Background
There are a few types of anxiety disorders: panic disorder, social anxiety disorder (SAD), generalized anxiety disorder (GAD), etc. Besides that, electrocardiogram (ECG) measurement and DNA methylation were also used to evaluate the presence of anxiety disorders.
Problem Statements
Besides that, people who suffer from social anxiety are those who have extreme fear of perceiving negative judgments from others. Therefore, there is a need for a reliable and effective technique to detect the risk of anxiety disorders in early stages so that the necessary steps can be taken to better alleviate the condition.
Aims and Objectives
Anxiety Study using DASPS EEG Public Dataset
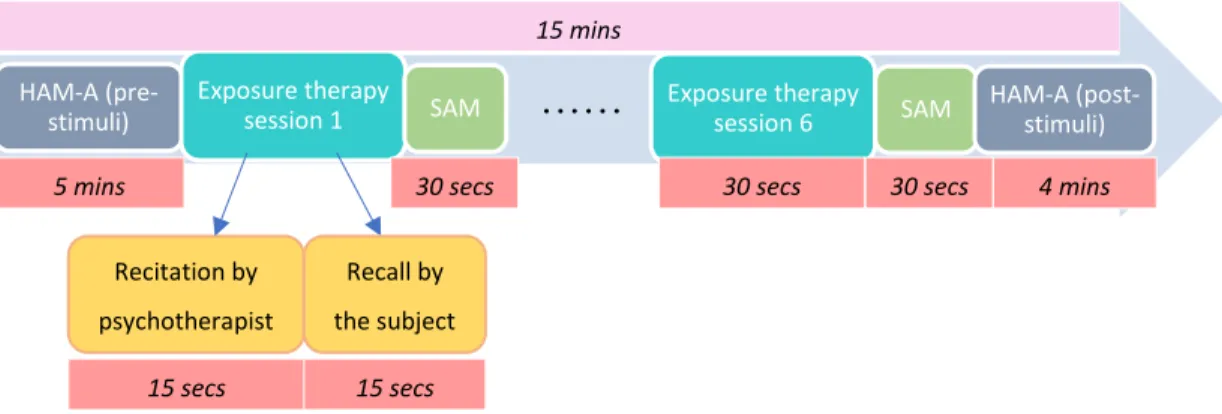
Experimental Design
Based on the results, it was proved that the anxiety level of most of the participants increased after the stimulation process. To collect the subjects' raw EEG data, the same experimental procedures were repeated, but this time EPOC EEG wireless headphones were used to capture the EEG signals generated before and after the stimulation procedure.
Removal of Artifacts from EEG Signals
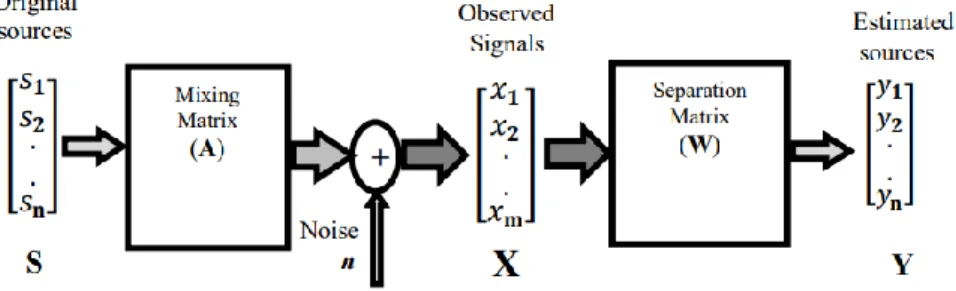
In the work of Baghdadi, et al. 2019), the Blind Source Separation (BSS) algorithm is implemented in the pre-processing step of the EEG data. Therefore, a higher-order filter was used to increase the delay, allowing more features or inputs to be accumulated from the EEG signal.
Classification of Anxiety Levels
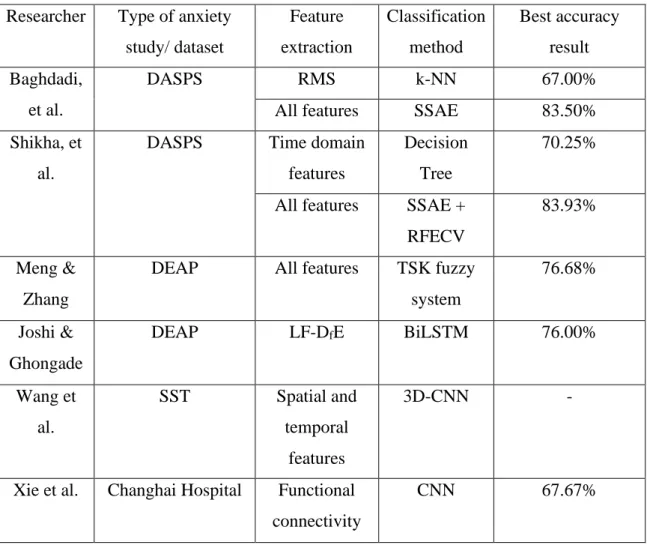
Based on the work of Baghdadi et al. 2019), RMS functions were calculated during the wavelet decomposition of the EEG signal. On the other hand, in the research conducted by Shikha, et al. 2021), Decision Tree and Random Forest classifiers were implemented to classify 2-level anxiety states during the 15s trial using the same DASPS dataset.
Anxiety Study using Other Datasets
- DEAP Public Dataset
- Stop Signal Task (SST) Personal Dataset
- Changhai Hospital Personal Dataset
- Healthy Brain Network (HBN) Public Dataset
- Social Anxiety Disorder (SAD) Study using Deep Learning
- Trait Anxiety Detection using MUSE EEG Headband
Features such as differential entropy (DfE), rational asymmetry (RASM) and linear formulation of differential entropy (LF-DfE) were extracted from the EEG data. The obtained EEG signals were fed into a filter and then preprocessed using the PCA algorithm. According to Al-Ezzi et al. 2021), effective connectivity features were extracted from the EEG signals and quantified using the Partial Directed Coherence (PDC) algorithm to predict SAD.
The features extracted from the EEG signals include maximum absolute value, signal energy, signal sum, etc.
Treatment of Anxiety Disorder
Early History of Treatments Used
Neurofeedback Treatment
The result is long term; hence it is concluded that CBT has a positive effect on the treatment of anxiety disorders. The increase in frontal asymmetry index may be associated with the increase in alpha power in the right frontal hemisphere compared to left hemisphere. Therefore, it is believed that frontal alpha asymmetry neurofeedback may be useful for the treatment of anxiety and certain phobias.
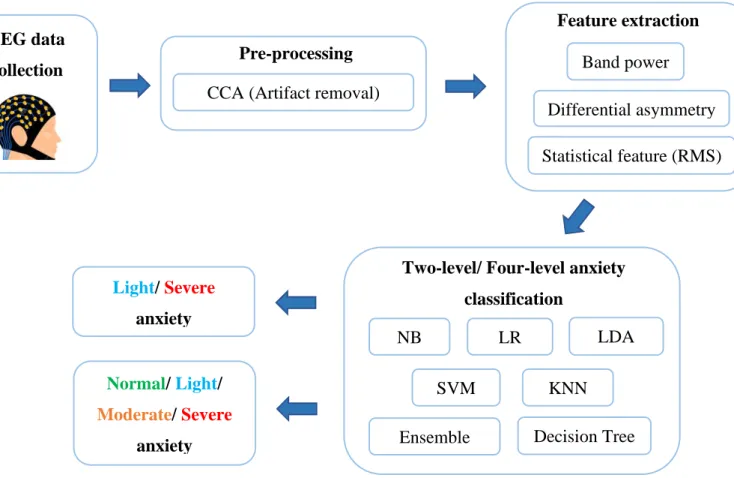
Overview of Project Flow
EEG Data Collection
Data Analysis
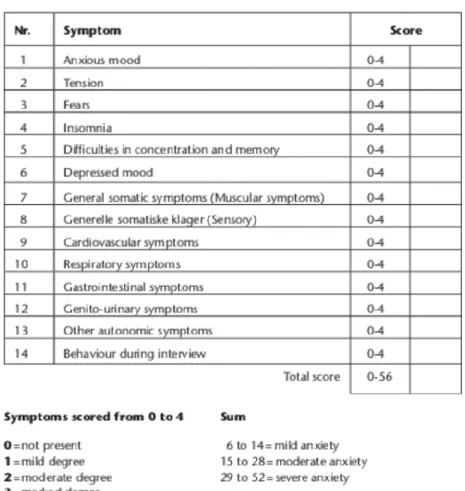
Prior to the pretreatment step, the SAM and HAM-A scores were re-evaluated in the work of previous researcher, Baghdadi, et al. In addition to that, the comparison of data from all participants was made by calculating the coefficient of variation (CV) of their ratings in the six exposure therapy sessions. Besides that, the increase in the number of subjects with severe anxiety after the experiment was also recorded by comparing the scores obtained in Hamilton 1 (HAM-A pre-stimuli) and Hamilton 2 (HAM-A post-stimuli).
Pre-processing
As previously mentioned, physiological artifacts such as EOG and EMG artifacts are commonly found in recorded EEG signals. As a result, EOG artifacts can also be detected by electroencephalogram and are usually found in the frontal region of the brain. On the other hand, EMG artifacts originate from muscle movement caused by different types of muscle groups in the subject.
Furthermore, the waveform of the artifacts changes accordingly at a different degree of muscle contraction, making it difficult for the author to eliminate these noises from the EEG signals.
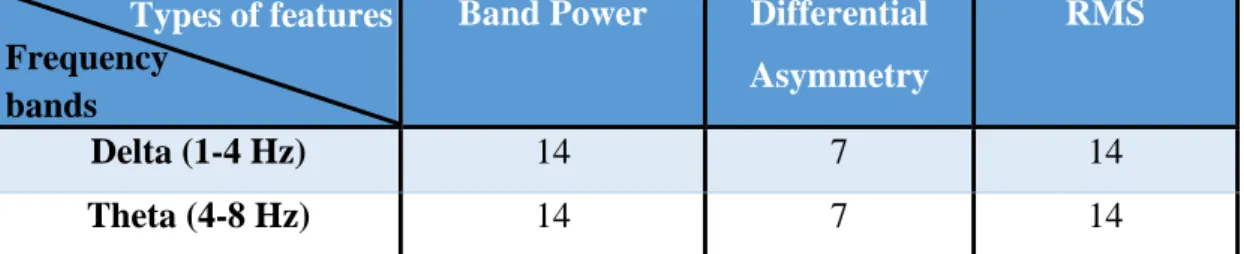
Feature Extraction
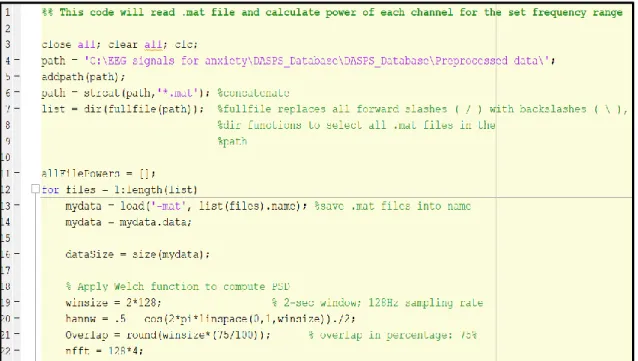
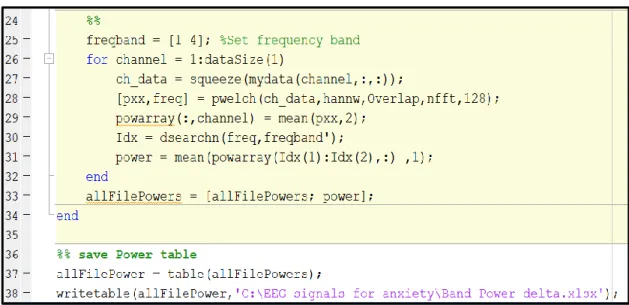
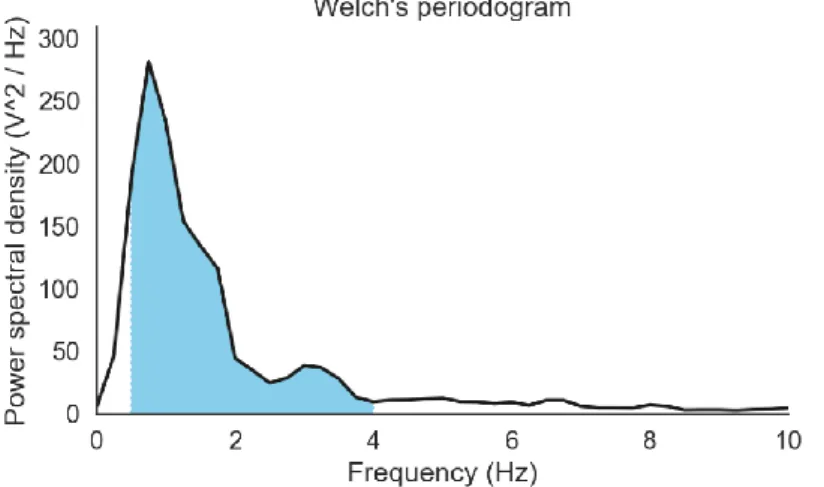
Frequency-domain Feature – Band Power
After that, the frequency range of each band was determined to find the frequency bins that intersect the frequency range of interest. Welch's method was proposed as a feature extraction approach because it is computationally efficient and effective in reducing the computational steps involved in analyzing EEG signals. In addition, DFT is also able to reduce time complexity, making it a fast and straightforward method for feature extraction.
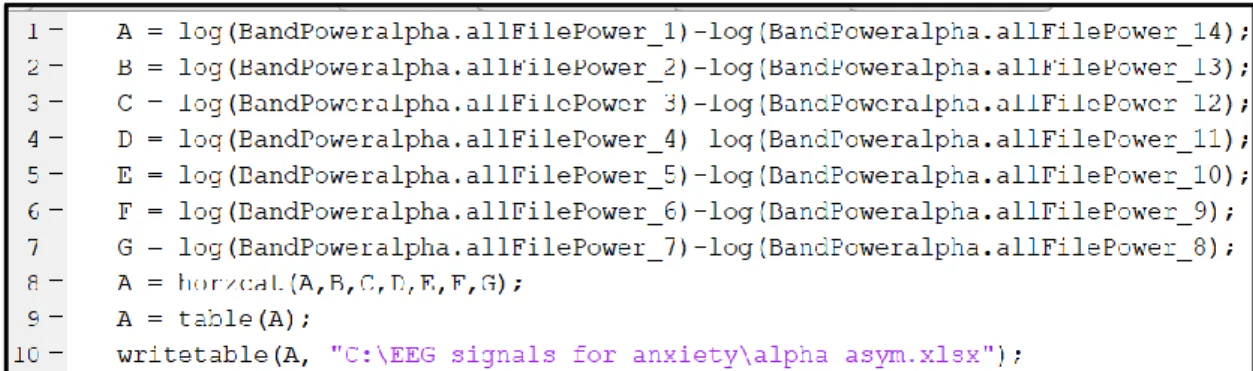
Electrode Combination Feature – Differential Asymmetry
For example, from line 1 in Figure 3-6, Equation 3.1 is applied so that the variable A represents the natural log of the power of channel 1 (AF3) divided by the power of channel 14 (AF4). From line 2, variable B represents the natural logarithm of the power of channel 2 (F7) divided by the power of channel 13 (F8), followed by the division of the powers of other left and right channels. The arrays were then concatenated horizontally to form a table, as described in lines 8 and 9 of the coding in Figure 3-6.
Figures and 3.10 show an algorithm written in MATLAB to calculate the differential asymmetry features in beta, delta, theta, and gamma.
Statistical Feature – Root Mean Square (RMS)
A total of 23 data sets were loaded one at a time and a combination of low-pass and high-pass FIR filters was performed to create a bandpass filter that cuts off the EEG signal in a specific frequency range. A slight buffer is provided to allow EEGLAB to perform filtering at the intended frequency. For example, the beta range is defined as 12.6 Hz to 32 Hz in the written script shown in Figure 3.11, while the output after executing the command is 13 Hz to 30 Hz, as shown in Figure 3.12.
Then the function rmsave was used to calculate the RMS score for each channel at the end of each epoch.
Classification of Human Anxiety
- Decision Trees
- Linear Discriminant
- Logistic Regression
- Naïve Bayes
- Support Vector Machines
- K-Nearest Neighbours
- Ensemble
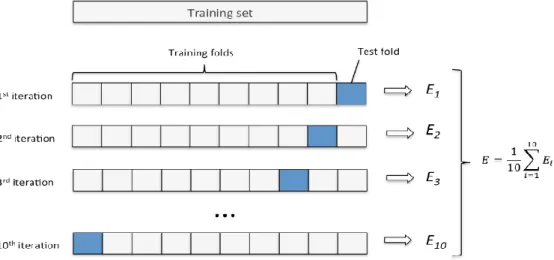
The first fold is used in the last iteration to test the model, while the remaining folds are used to train the model. The accuracy of the test was calculated using an algorithm written in MATLAB, as shown in Figure 3.16. Predicted anxiety classes were compared with actual classes to ensure the accuracy of the test.
So KNN was used to train the training data and the algorithm written to calculate test accuracy on the test data is shown in Figure 3.21 below.
Optimization
Introduction
Classification using Band Power Features
The distribution was then presented in the form of a bar chart with the number of subjects on the y-axis and anxiety levels based on HAM-A scores on the x-axis. On the other hand, the training data set in Hamilton 1 is balanced as it is reasonably distributed across all anxiety levels despite having two or four levels. Therefore, it is expected that better classification results will be obtained based on Hamilton 1 compared to those of Hamilton 2.
In addition, it is hypothesized that 2-level anxiety would provide better classification accuracy compared to 4-level anxiety since the overall distribution of 2-level anxiety is more proportional compared to 4-level anxiety. .
Distribution across participants involved in train data
Two-level Anxiety Classification
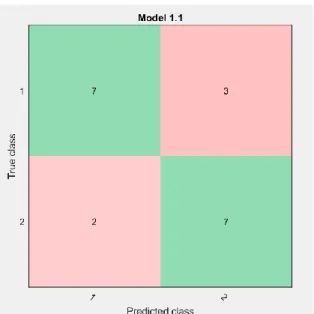
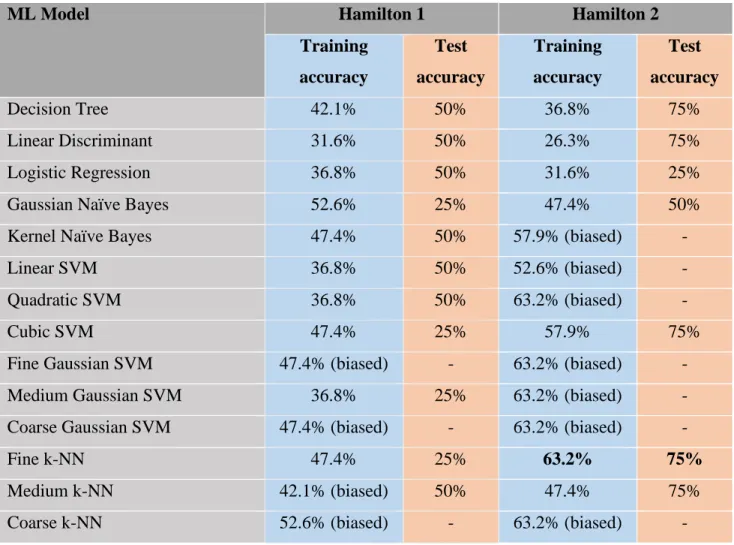
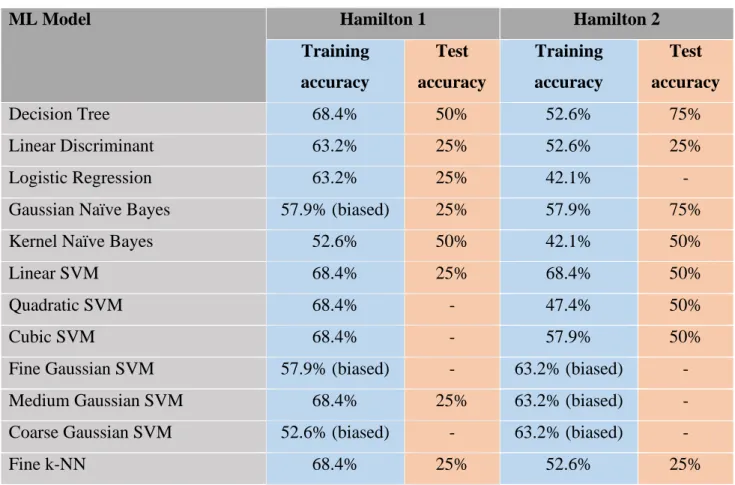
From Table 4.1, it can be observed that Decision Tree classifiers compute the highest training accuracy of 73.7% and testing accuracy of 75% each for 2-level anxiety classifier based on Hamilton 1, followed by Fine k-NN and LDA, yielding training accuracies of 63.2% and 57.9% respectively. Whereas for the 2-level anxiety classifier based on Hamilton 2, the Ensemble (Bagged Trees) classifier provides the highest training accuracy of 63.2% and testing accuracy of 75%. Furthermore, the test accuracies for 2-level anxiety classification based on Hamilton 1 and Hamilton 2 were also compared.
Overall, machine learning models were better trained based on Hamilton 1 to detect anxiety at 2 levels compared to Hamilton 2.
Four-level Anxiety Classification
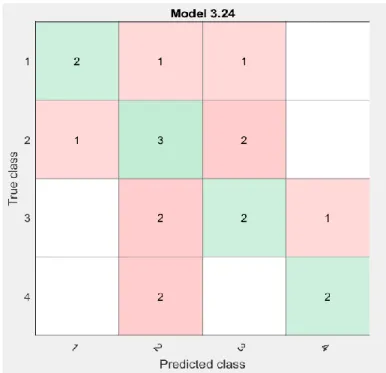
From Table 4.2 it can be observed that Ensemble (RUSBoosted Trees) classifier delivers the highest training accuracy of 47.4% and test accuracy of 50% for 4-level anxiety classification based on Hamilton 1. For Hamilton 2, SVM, Coarse k-NN and Ensemble (Boosted Trees ) classifiers yield the highest training accuracy of 47.4% each, but the result shown in confusion matrix is biased towards class 4 anxiety. Thus, this is not a valid result as there are more sample data of class 4 anxiety in the training dataset compared to other classes.
Thus, test accuracies were not calculated for these Hamilton 2 classifiers due to the unbalanced data set used for the 4-level anxiety classification, as shown in Figure 4.1.
Classification using Differential Asymmetry
- Two-level Anxiety Classification
- Four-level Anxiety Classification
It can be seen from Table 4.3 that the highest training accuracy of 68% is obtained by the Ensemble classifier using asymmetry functions for 2-level fear detection based on Hamilton 1, while the highest training accuracy is 63.2% and test accuracy is 75%. In general, the models trained based on Hamilton 1 have fewer problems with biased classification compared to those based on Hamilton 2. In general, the training accuracies for 4-level fear classification based on Hamilton 1 are lower than those based on based on Hamilton 2.
Therefore, it can be concluded that the models are not well trained due to the unbalanced data set based on Hamilton 2.
Classification using Statistical Feature - RMS
- Two-level Anxiety Classification
- Four-level Anxiety Classification
The same 19 subjects as in the previous anxiety rating process were allocated for training, and data from the remaining 4 subjects were reserved for testing. Under Hamilton 2, the highest achieved training accuracy also corresponds to 73.7% using Ensemble (RUSBoosted Trees) classifier. However, the test accuracies obtained using the Ensemble classifiers based on both Hamilton 1 and Hamilton 2 were relatively low, such as 25% and 50%.
However, the result obtained on Hamilton 2 is biased towards class 2 and class 4 anxiety due to more subjects involved in these two classes.
Comparison between Classification using a Single Feature and Multiple Features based on Hamilton 1 and Hamilton 2
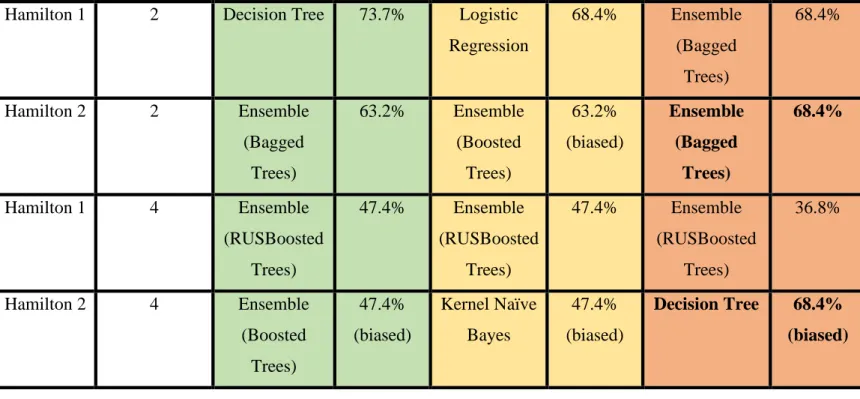
It can be seen from Table 4.7 that the training accuracy for a 2-level anxiety classification obtained from Hamilton 2 increases from 63.2% to 68.4% after adding differential asymmetry and RMS features to the existing predictor group. In addition, the training accuracy for 4-level fear classification has also increased from 47.4% with band strength functions only to 68.4% with all functions. However, for a 2-level fear rating based on Hamilton 1, there is a slight decrease in training accuracy from 73.3% using band power functions only to 68.4% using all functions.
Whereas from Table 4.8 it can be observed that the test accuracy for 4-level anxiety classification based on Hamilton 2 is also improved so that a test accuracy of 50% is achieved using all features.
Comparison between Classification Results Obtained in this Work and Previous Research
On the other hand, different number of features used will also affect the accuracy result. For example, the features used in the author's work were extracted from all 5 frequencies, while only 4 frequencies (delta was excluded) were implemented in the research of Baghdadi, et al. Furthermore, different number of k-folds used in the cross-validation can also cause changes to training accuracy.
For example, 10-fold cross-validation is required for the best accuracy result in this work, while 5-fold cross-validation worked well in the study by Baghdadi et al.
Conclusion
Furthermore, the optimization process has been performed by adding asymmetry and RMS features in the training dataset. By doing so, the training accuracy and testing accuracy based on Hamilton 2 have increased significantly. Besides that, the training accuracy using RMS features also increased using the method proposed in this work when compared to that of Baghdadi, et al.
Recommendations for Future Improvement
Available at:
Fusion of Electroencephalogram and Eye Movement with Group Sparse Canonical Correlation Analysis for Anxiety Detection.