ANALYSIS OF THERMAL AND MECHANICAL PROPERTIES OF LOW DENSITY POLYETHYLENE (LDPE) WITH GLASS FIBRE
(GF) COMPOSITES
by
Karrthik a/l Subramaniam 15450
Dissertation submitted in partial fulfilment of the requirements for the
Bachelor of Engineering (Hons) (Chemical Engineering)
SEPT 2014
Universiti Teknologi PETRONAS Bandar Seri Iskandar
31750 Tronoh Perak Darul Ridzuan
CERTIFICATION OF APPROVAL
ANALYSIS OF THERMAL AND MECHANICAL PROPERTIES OF LOW DENSITY POLYETHYLENE (LDPE) WITH GLASS FIBRE
(GF) COMPOSITES
by
Karrthik a/l Subramaniam 15450
A project dissertation submitted to the Chemical Engineering Programme Universiti Teknologi PETRONAS in partial fulfilment of the requirement for the
BACHELOR OF ENGINEERING (Hons) (CHEMICAL ENGINEERING)
Approved by,
_________________________
(Prof. Dr. Khairun Azizi binti Mohd. Azizli)
UNIVERSITI TEKNOLOGI PETRONAS TRONOH, PERAK
Sept 2014
CERTIFICATION OF ORIGINALITY
This is to certify that I am responsible for the work submitted in this project, that the original work is my own except as specified in the references and acknowledgements, and that the original work contained herein have not been undertaken or done by unspecified sources or persons.
____________________________
KARRTHIK SUBRAMANIAM 15450
CHEMICAL ENGINEERING
i
ABSTRACT
Low Density Polytehylene (LDPE) is known as a low cost engineering plastics with its outstanding properties. It has been widely used in various industries. Glass fibre (GF) is one of the well-known reinforcing agents. This research is conducted to study the mechanical and thermal properties of GF reinforced LDPE. The mix formulations used for the GF reinforced LDPE are 10% wt GF, 15% wt GF and 20% wt GF by using compression moulding. By increasing the weight percentage of GF, the tensile strength of the composite was found to be increased. However, the percentage of elongation at break displayed an inverse pattern. Besides, analysis of thermal properties showed that the thermal degradation temperature and degree of crystallinity was increased with the weight percentage of GF. 20 wt% GF reinforced LDPE exhibited the highest tensile strength and thermal degradation temperature. In addition, the fracture surface morphology of each samples were obtained. It showed that with higher weight percentage of GF had less void content and performs less plastically deformed. Hence, it could be concluded that the objectives of this project were achieved where the mechanical and thermal properties of GF reinforced LDPE were studied. It was shown that there were improvements on LDPE’s mechanical and thermal properties by reinforcing with GF.
ii
ACKNOWLEDGEMENT
First and foremost, I would like to express my deepest gratitude to Chemical Engineering Department of Universiti Teknologi Petronas for granting me with this excellent platform to undertake this remarkable Final Year Project (FYP) course as a medium to enhance my skills and knowledge to become a better engineer. Via this project, I have understood the needs of the industrial demand in research side and also the importance of in depth analysis on various tasks. The project also helped me with my problem solving skills and writing skills as well.
Furthermore, a very special note of thanks to my kind supervisor, Dr. Khairun Azizi, who has always been willing to spend her time in assisting me and provided good support since the start of the project until it reached completion. Through the weekly discussions with my supervisor, I have received numerous share of insight on the different aspects to be assessed for this project to become feasible. Her excellent support, patience and effective guidance have brought a great impact my project. Nevertheless, I would also like to thank the FYP course coordinator for arranging various seminars as support and knowledge transfer to assist my work in the project. The seminars and lectures were indeed very helpful and provided useful tips throughout. I would like to thank all lecturers of Universiti Teknologi PETRONAS whom had given me guidance throughout the period of the project. Last but not least, my heartfelt gratitude goes to my family and friends for providing me continuous support throughout the easy and challenging times. Thank you all.
1
Table of Contents
ABSTRACT ... i
ACKNOWLEDGEMENT ... ii
LIST OF FIGURES ... 3
LIST OF TABLES ... 4
CHAPTER 1: INTRODUCTION ... 5
1.1 BACKGROUND ... 5
1.2 PROBLEM STATEMENT ... 7
1.3 OBJECTIVES AND SCOPE OF STUDY... 7
CHAPTER 2: LITERATURE REVIEW ... 8
2.1 LOW DENSITY POLYETHYLENE ... 8
2.2 SHORT FIBRE REINFORCED POLYMER COMPOSITES ... 9
2.3 LOW DENSITY POLYETHYLENE WITH GLASS FIBRE ... 11
2.4 THERMAL PROPERTIES ... 12
2.4.1 Differential Scanning Calorimetry (DSC) ... 13
2.4.2 Thermogravimetric Analysis (TGA) ... 14
2.5 MECHANICAL ANALYSIS ... 14
CHAPTER 3: METHODOLOGY ... 17
3.1 PROJECT WORK FLOW ... 17
3.2 CHARACTERISATION OF LDPE ... 17
3.3 CHEMICALS AND MATERIALS ... 17
3.4 SYNTHESIS OF SAMPLE ... 19
3.4.1 Synthesis under Varied Pressure ... 19
3.4.2 Synthesis with Varied Weight Percentage of Glass Fibre ... 20
3.5 MECHANICAL ANALYSIS ... 21
3.6 THERMAL ANALYSIS... 21
2
3.7 CHARACTERISATION ... 22
CHAPTER 4: RESULTS AND DISCUSSION ... 23
4.1 CHARACTERISATION OF RAW MATERIALS ... 23
4.1.1 Scanning Electron Microscope ... 23
4.1.2 Fourier Transform Infrared Spectroscopy (FTIR) ... 26
4.2 MECHANICAL ANALYSIS ... 27
4.2.1 Tensile Test under Varied Pressure ... 27
4.2.2 Tensile Test with Varied Weight Percentage of Glass Fibre ... 28
4.3 THERMAL ANALYSIS... 30
4.3.1 Thermal Gravimetric Analysis (TGA) ... 30
4.3.2 Differential Scanning Calorimeter (DSC) ... 31
4.4 CHARACTERISATION ANALYSIS ... 32
4.4.1 Scanning Electron Microscopy ... 32
CHAPTER 5: CONCLUSION AND RECOMMENDATIONS ... 35
5.1 CONCLUSION ... 35
5.2 RECOMMENDATIONS ... 36
REFERNCES ... 37
APPENDIX... 39
3
LIST OF FIGURES
Figure Page
Figure 1.1 Chemical Structure of Pure Polyethylene
5
Figure 1.2 Simple Process for the Production of Polyethylene
5
Figure 2.1 Graph of Specific Volume against Temperature
12
Figure 2.2: DSC Generic Thermogram
13
Figure 3.1: Process Flow
18
Figure 3.2: Sample dimension according to ASTM D638
19
Figure 4.1: Pure LDPE Magnified 1000x
23
Figure 4.2: Graph of Certainty for Spot 1
24
Figure 4.3: Graph of Certainty for Spot 2
24
Figure 4.4: Graph of Certainty for Spot 3
25
Figure 4.5: Graph of Certainty for Spot 4
25
Figure 4.6: FTIR for Pure LDPE
26
Figure 4.7: Graph of Tensile Strength vs. Pressure
27
Figure 4.8: Graph of Percentage of Elongation at Break vs. Pressure
28
Figure 4.9: Graph of Tensile Strength vs. Varied Glass Fibre Concentration
29
Figure 4.10: Graph of Percentage of Elongation at Break vs. Varied Glass
Fibre Concentration
29
Figure 4.11: Thermogram
30
Figure 4.12: DSC Results
31
Figure 4.13: Surface Morphology at Breaking of Pure LDPE
32
Figure 4.14: Surface Morphology at Breaking of LDPE with 10% GF
33
Figure 4.15: Surface Morphology at Breaking of LDPE with 15% GF
33
Figure 4.16: Surface Morphology at Breaking of LDPE with 20% GF
34
4
LIST OF TABLES
Tables Page
Table 1.1 Type of Fillers and its Functions 6
Table 2.1 Values for Various Samples for Mechanical Analysis 15
Table 3.1: Properties of LDPE Titanlene LDF201FG 17
Table 3.2 Process variables 19
Table 3.3: Mix Formulation 20
Table 3.4 Characterisation Analysis 22
Table 4.1: FTIR Standard Peak Analysis 26
Table 4.2: Tensile Test for Samples under Varied Pressure 27 Table 4.3: Tensile Test for Samples under Varied Glass Fibre Concentration 28
5
CHAPTER 1: INTRODUCTION
1.1 BACKGROUND
Polyethylene molecules consist of a long backbone of even number of covalently linked carbon atoms with a pair of hydrogen atoms attached to each carbon. There are a lot of various types of polyethylene. The variation arise mainly due to the branches which then defines the nature of the materials. Besides that, the alkyl groups, acid group and ester groups in the branch also defines the functionalities of the polymer. Figure 1.1 shows the chemical structure of pure polyethylene at condensed form, where n denotes the degree of polymerisation
Figure 1.1 Chemical Structure of Pure Polyethylene
Generally, the degree of polymerisation is well in excess of 100 and can be as high as 250,000 or more. The degree of polymerisation effects the phase of the material and also the branching as well. Among various type of polyethylene, Low Density- Polyethylene are one of the most common polymer and widely used in a lot of industrial applications.
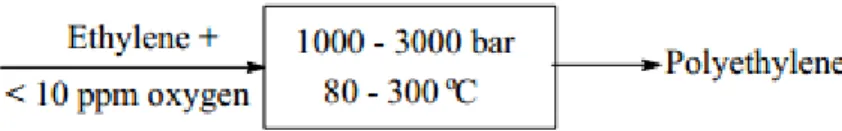
Figure 1.2 Simple Process for the Production of Polyethylene
Low density polyethylene as explained by its name, possess of low density due to the substantial concentration of branches which hinders the crystallisation process. The branches mostly consist of ethyl and butyl groups together with some long chain branches.
Long chain branches occur at random intervals. The numerous branches makes the
6
polymer molecules to inhibit their ability to crystallise. Low density polyethylene has a density range of approximately 0.90-0.94 g/cm3.
Low density polyethylene (LDPE) is the first of the polyolefins, where it was discovered in the year of 1933 in England by Imperial Chemical Industries Ltd. It was first commercially used during the World War II as an insulator for radar cables and submarine cables due to its capability to insulate with high electric and low loss factor. For this very reason the demand for it increased tremendously during that period of time. Initially low density polyethylene was known as Polythene.
Ever since polymer industry started, the addition of additives has been necessary at least to make the polymer process-able. Additives are introduced to improve the properties of the polymer to a more desirable material and at the same instance it also aids to reduce the undesirable properties as well. Table 1 below shows the common type of additives for plastics and their functions.
Table 1.1 Type of Fillers and its Functions
Glass fibres falls under the fibre reinforcement category. Glass fibres are used extensively in commercial composite applications due to its low cost, high tensile strength, good chemical resistance, and high impact resistance. The three most common glass fibres that are currently being used for composites are S-2 glass, E-glass and quartz. Generally glass fibres are used as thermal insulation, electrical insulation, high strength fabrics, corrosion and heat resistant fabrics and sound insulation.
Type Functions
Fillers and mineral
reinforcement Adding bulk to a compound, stiffness and surface hardness Fibre reinforcement Improve mechanical strength
Heat resistance Act to delay or prevent oxidation under heat, during processing or applications.
Flame retardant Prevent ignition of polymer, and promotes extinguishing.
UV resistant Delay or prevent oxidation under prolonged exposure to sunlight
Plasticizers Improvement in process-ability , flexibility Antistatic Prevent electrostatic discharge
7 1.2 PROBLEM STATEMENT
Application for LDPE is wide; however there are certain criteria that makes LDPE not suitable. Factors such as flammable, low strength, low stiffness and low maximum operating temperature makes it incompatible for various other industries. In order to address this problem, this project is done. By introducing glass fibre into LDPE, the reinforced composite material is expected to have higher thermal resistivity, and high tensile strength.
Glass fibre is abundantly used as reinforcing material in various industries. The structure of glass fibre compliments the structure of LDPE. Glass fibre has short branch of carbon, silicon and oxygen. Hence this material can fill the extensive branched carbon chains of LDPE.
1.3 OBJECTIVES AND SCOPE OF STUDY
To synthesise reinforced polymer composite using LDPE and GF with varied weight percentage. The scope of the study is limited up till 20% weight percentage of GF with a succession of 5% increase from 10%.
To investigate the mechanical and thermal properties by varying weight percentage of GF in the reinforced polymer composite
To characterise the pure and the reinforced polymer for surface morphology
8
CHAPTER 2: LITERATURE REVIEW
2.1 LOW DENSITY POLYETHYLENE
In order to increase the mechanical and thermal strength of the LDPE, plant based fibres were used by F.Z Arrakhiz (2013). They have evaluated the thermal and mechanical properties of Doum-fibres reinforcing LDPE composite. Doum fibres are from Doum palm trees. Doum fibres were treated with alkali solution to increase adhesion between LDPE.
The composite produced were subjected to various tests to determine the mechanical strength and also its thermal resistivity.
The results were promising for up to a certain extend. After the addition of Doum fibres, the composite material showed significant increase in the Young Modulus, the torsion modulus and the flexural modulus. However, with the fibre content more than 20 wt% the above tested parameters started to decrease. As for tensile strength, energy stored and enthalpy, neat LDPE is better than the composite material. On the other hand, the thermal resistivity of neat LDPE or pure LDPE is higher when compared to the composite material produced [9].
In 1997, a research involving Henequen Cellulosic Fibre [12]. They introduced Henequen Cellulosic Fibre in LDPE to investigate the effect fibre treatment on the LDPE’s mechanical properties. Henequen was chosen due to its fibrous leaf. The research as before tested the mechanical strength and also thermal resistivity between the two composites.
The concentration of the fibre was increased from 0% to 30% by volume. With the addition of this fibre to the LDPE, the tensile strength of these composite materials increased by 50% when compared to lean LDPE. Besides than that, Young’s modulus also had a noticeable increase. However, the ultimate strain values for the composite material decreased significantly.
As for the thermal resistivity, the LDPE-Henequen Cellulosic fibre material, showed no effect thermally when it is compared to pure LDPE. The thermal resistivity of the composite material was studied using Differential Scanning Calorimetry, DSC. From this study, it showed that the presence of the Henequen fibre does not affect the thermal behaviour of the LDPE matrix [12].
9
After the initial readings obtained, the research was performed once again by pre- impregnation of the cellulosic fibres in a LDPE-xylene solution and silane coupling agent was used as well. With such introduction, the mechanical properties of the composite material showed a slight increment where else the thermal properties did not show any noticeable increment or decrement. It was identified that the fibre surface treatment improved the fibre dispersion in the matrix.
In order to increase LDPE’s thermal resistivity, two types of iron MMTs where added to make a composite material. The iron MMTs were synthesized by hydrothermal method and was used to prepare flame retardant LDPE with an intumescent flame retardant[10]. Different tests were conducted namely combustion test and cone calorimeter test. After subjecting to the test, the composite materials were analysed in Scanning Electron Microscopy. Both the iron materials showed a successful flame retardant characteristics with 2 wt%.
2.2 SHORT FIBRE REINFORCED POLYMER COMPOSITES
In short-fibre reinforced polymers, loads are not directly applied to the fibre matrix.
Instead, they are applied to polymer matrix and transferred to the fibre through the fibre ends; to be precise through the cylindrical surface of the fibre. Such polymers have been consistently proven via experiments that there’s significant increase in the polymer’s strength and stiffness properties. Besides, introducing short fibre effectively addresses another critical limitations of polyolefins which is the heat resistant. By addressing this critical limit, the commodity polymers are now considered as engineering materials which can be used in various other industries. Research performed with polypropylene with 40%
of short glass fibre shows that the Hard Deflection Temperature is radically increased from the lean polypropylene; which is from 60℃ to 140℃.
Despite decades of well-established use for short fibre reinforced polymers, there are several other factors that effects the strengthening of the materials which is still being studied and researched upon to. For strengthening the polymer composite factors such as fibre loading, aspect ratio, length and orientation distribution plays an important role.
Research have indicated that fibre length less than 0.5mm has very low effect on strengthening and quantifiable improvement was measured above 1mm and higher of fibre length.
10
Fibres that are usually used to reinforce polymers have diameters of the order of 10µm; and the most common fibre used is glass fibre. Glass fibres comprises almost 90%
of the fibres used in short fibre reinforced polymers. Properties such as high strength, high stiffness, low specific gravity, good insulating characteristics and superior chemical resistance gives the much needed edge for glass fibre. There are some disadvantages as well like; poor adhesion to polymer matrix resins, relatively low modulus and low fatigue resistance.
In the year 2009, a research to reinforce polyester by compositing it with glass fibre. The commercial reinforcement was investigated with chopped glass fibre and glass woven fabric materials to get a comparison [22]. The two components was treated and coupled with polyester with coupling additives. After the research and experimentation was completed, the tensile strength of the polyester composite was able to increase by 39%
for the chopped glass fibre. They came to a conclusion that various coupling additives could yield different mechanical strength. Alcohol based coupling additives made the mechanical strength weaker than lean polyester while coupling additives with increasing amide and ester-amide group, increased the mechanical strength of the polyester composite.
In a different study, research on the effect of hybrid carbon nanotube with glass fibre reinforcement to study the properties of polypropylene composites. The parameters that was studied in this research paper was on morphology, electrical properties and mechanical properties of polypropylene matrix composites [11].
The composites were prepared using extrusion and injection moulding techniques.
The end result was that, hybrid components gave a higher tensile strength compared to neat polypropylene. This result might be due to better dispersion forces between the carbon nanotubes and glass fibres with the polypropylene. The author proposed that usage of glass fibre and carbon nanotubes at the same time in polypropylene increases the reinforcing ability of the composite due to enhanced polarity of the system.
11
2.3 LOW DENSITY POLYETHYLENE WITH GLASS FIBRE
In the year 2012, a group of researchers from Qatar University did a research titled
“Effect of Chain Structure in the Properties of Glass Fibre/Polyethylene Composites”.
Three types of polyethylene; low-density polyethylene (LDPE), medium-density polyethylene (MDPE) and high density polyethylene (HDPE) was used to investigate the effect of chain branching and adhesion with glass fibre reinforced polymer composites [8]. The research was on the tensile strength, morphology analysis, rheology characterisation, Thermo Gravimetric Analysis (TGA) and Differential Scanning Calorimetry (DSC). The result obtained for tensile strength were as expected when compared to other similar research. The tensile strength of the composite material was higher compared lean LDPE. However the percentage of elongation decreased significantly. This is because, pure LDPE has more amorphous structure than crystalline structure. With the addition of fibre glass, the amorphous structure changes to more crystalline structure [8].
TGA was used to study the thermal stability of the composite. Glass fibre reinforced the composite increasing the degradation temperature of the composite material when compared to the pure material. As the research before, with the introduction of nanotubes and carbon Nano-fibres the polymer matrix had a better thermal stability.
Although there was an increase in thermal degradation temperature, the increase is not significant. According to the data obtained, the temperature increase was merely 3℃ which is from 476℃ to 479℃ [8].
As according to the research paper, the addition of glass fibre to LDPE did increase the tensile strength and the thermal stability, however the study performed did not cover the various range of wt.%. of the composite material. Their research paper was in the ration of every four parts of LDPE is reacted with one part of Glass fibre [8].
12 2.4 THERMAL PROPERTIES
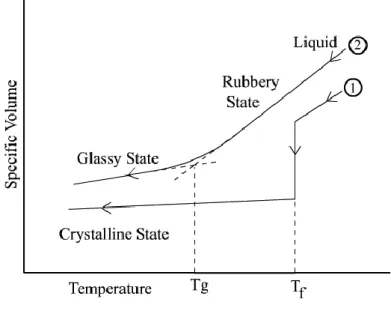
Important study for polymers under thermal properties are the glass transition temperature, Tg. Polymers below the glass transition temperature behaves in an increasingly brittle manner, where else above the this temperature it behaves rubber-like. Generally, glass transition temperature below the room temperature are defined of elastomers while above are defined as rigid, structural polymers. The figure 2.1 depicts the states of the polymer at various temperature with respect to its specific volume. Such behaviour at different temperature can be explained in terms of the structure of glassy materials which are formed via long chains, networks of linked atoms or complex molecular structure. The graph is a comparison between crystalline material (1) and amorphous material (2). Crystalline material experiences sharp drop in volume upon reaching the freezing temperature, Tf. As for the amorphous material, the curve smoothly reduces passing through the liquid, rubbery state and finishing at glassy state with gradual reduce of the specific volume.
Figure 2.1 Graph of Specific Volume against Temperature
Temperature plays a strong role indicating the behaviour of the material. Generally, there are two of force induced behavioural material and they are elastic and plastic. For elastic materials will return to their original state once the force has been removed, where else for plastic materials they will not regain their shape once the force has been removed.
Most materials today exhibit part of the both behaviour. They show plastic behaviour once they elastic limit has been exceeded.
13
Thermal analysis usually refers heating or cooling a sample at a controlled rate while the physical characteristics are monitored. In order to determine the changes in heat capacity, Differential Scanning Calorimetry is used; while, to determine weight changes Thermogravimetric Analysis is performed
2.4.1 Differential Scanning Calorimetry (DSC)
According to the book titled Differential Scanning Calorimetry, DSC means the measurement of the change of the difference in the heat flow rate to the sample and to a reference sample while they are subjected to a controlled temperature program [13]. Differential Scanning Calorimeter is used to obtain the thermal critical points like melting point, enthalpy specific heat or glass transition temperature of the substances. This is achieved by measuring the instantaneous heat capacity of the sample with relative to its temperature during the cooling and heating process. The results are plotted in a graph known as thermogram and they are quantified by heat flow, as according to the Figure 2.2.
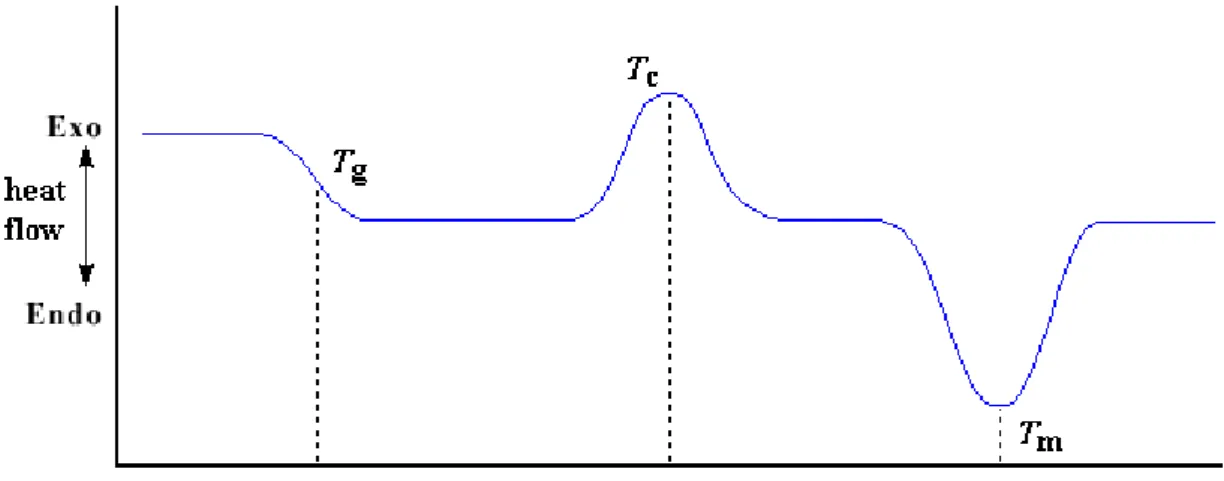
Figure 2.2: DSC Generic Thermogram
Referring to the Figure 2.2, the peak breadth, is generally related to the size and the degreed of perfection of the polymer crystals. Glass transition temperature, Tg represents the increase in the energy supplied in order to maintain it at the same temperature as the reference sample that is being used. Normally, scans in DSC are done in two sets. The first scan is when the polymer is heated from low temperature to its melting point. Any changes in the transition is recorded. The molten sample is quenched using liquid nitrogen, meaning that the molten polymer will be under amorphous state due to the immediate release of the energy. Once this is done, the second scan is done. The
14
temperature will be increased. The molecules will gain energy and the glass transitions is recorded when the crystallisation temperature, Tc is reached.
2.4.2 Thermogravimetric Analysis (TGA)
Changes in physical and chemical properties of the test sample is recorded accordingly with the temperature or time as an increasing function. If the increasing function is temperature, then heating rate will be constant. If it is in function of time, then the temperature will be constant or the mass loss will be constant. Via this analysis a lot of valuable information can be gathered, mainly on the physical phenomena or properties.
Information such as second order phase transitions which includes vaporisation, sublimation, adsorption and absorption can be gathered through this analysis. At the same instance, information on chemical properties also can be gathered through this system such as decomposition, chemisorption, oxidation and reduction and several others.
2.5 MECHANICAL ANALYSIS
Mechanical analysis is performed in order to test the physical properties of the material under variety of testing regimes. Such experiments and analysis are performed on finished items for quality control and quality assurances purposes. Many physical property measurements are involved in deforming specimens under the standardized conditions.
Test specimens are generally molded in “dog-b one” shape. The rate of deformation of a sample is related to the physical properties of the sample. The standard method performed are known as ASTM test methods where the different sample geometries and testing configurations are predefined. The terms that generally related to mechanical testing are force and elongation. This two terms are independent of the sample’s geometry. However, stress and strain are sample dependant. Stress is defined as force experienced over cross sectional area, which is:
𝑆𝑡𝑟𝑒𝑠𝑠 = 𝐹𝑜𝑟𝑐𝑒
𝐴𝑟𝑒𝑎 (Equation 1)
Where else strain is defined as:
15
𝑆𝑡𝑟𝑎𝑖𝑛 = 𝐶𝑢𝑟𝑟𝑒𝑛𝑡 𝑠𝑎𝑚𝑝𝑙𝑒 𝑑𝑖𝑚𝑒𝑛𝑠𝑖𝑜𝑛−𝑂𝑟𝑖𝑔𝑖𝑛𝑎𝑙 𝑑𝑖𝑚𝑒𝑛𝑠𝑖𝑜𝑛
𝑂𝑟𝑖𝑔𝑖𝑛𝑎𝑙 𝑑𝑖𝑚𝑒𝑛𝑠𝑖𝑜𝑛 (Equation 2) 𝑃𝑒𝑟𝑐𝑒𝑛𝑡 𝑠𝑡𝑟𝑎𝑖𝑛 = 𝐶𝑢𝑟𝑟𝑒𝑛𝑡 𝑠𝑎𝑚𝑝𝑙𝑒 𝑑𝑖𝑚𝑒𝑛𝑠𝑖𝑜𝑛−𝑂𝑟𝑖𝑔𝑖𝑛𝑎𝑙 𝑑𝑖𝑚𝑒𝑛𝑠𝑖𝑜𝑛
𝑂𝑟𝑖𝑔𝑖𝑛𝑎𝑙 𝑑𝑖𝑚𝑒𝑛𝑠𝑖𝑜𝑛 × 100 (Equation 3)
𝐷𝑟𝑎𝑤 𝑟𝑎𝑡𝑖𝑜 = 𝐶𝑢𝑟𝑟𝑒𝑛𝑡 𝑙𝑒𝑛𝑔𝑡ℎ
𝑂𝑟𝑖𝑔𝑖𝑛𝑎𝑙 𝑙𝑒𝑛𝑔𝑡ℎ (Equation 4) The ability of the polymer matrix to support the fibre and able to transfer the applied stress to the fibre is equally important in polymer composites. Since glass fibre possess relatively high melting temperature, short fibre reinforced polymer products can be fabricated at elevated temperature. This process can be done easily and quickly through extrusion compounding and injection moulding processes.
Different polymer materials exhibit varied polymer matrices, hence the short fibre reinforcement also changes. Since the fibre material will be principal load-bearing element in such composite, it is best to use high strength and stiffness based on the polymer matrices. However, fibre materials possess low ductility. In order to compensate with each other, the polymer matrices have relatively higher ductility. The polymer matrix serves to connect the fibres and protect the rigid and brittles fibres from abrasion and corrosion.
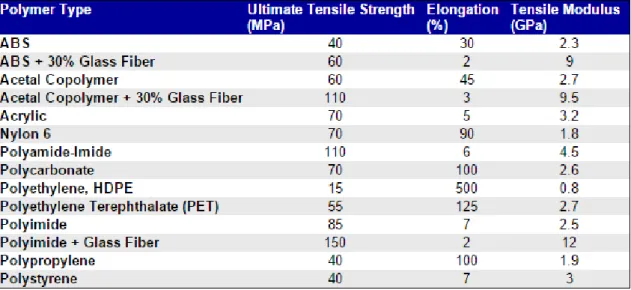
Table 2.1 Values for Various Samples for Mechanical Analysis
Table 2.1 shows list of polymers subjected to tensile testing. Some of the polymers were tested under pure conditions while some where tested after reinforcing with short glass fibre. The testing were done using ASTM D638 method. Ultimate tensile strength (UTS)
16
the maximum force required to break the material. This parameter is widely used in structural application to measure the ability of the material to resist breaking or necking under maximum tensile stress. Tensile elongation or also known as elongation at break is the maximum elongation of an engineering material in percentage until the breaking occurs. Where else, tensile modulus is the ratio of stress to the elastic strain in tension.
Meaning that, material with high tensile modulus is rigid which requires more stress to produce a given amount of strain.
17
CHAPTER 3: METHODOLOGY
3.1 PROJECT WORK FLOW
Figure 3.1 shows the flow of this project. The project was completed in two parts. First part being the synthesis and testing of the pure LDPE whilst the second part was synthesising and testing of LDPE with varied glass fibre.
3.2 CHARACTERISATION OF LDPE
LDPE obtained from Titan Chemicals was characterised using Scanning Electron Microscope (SEM) and Fourier Transform Infrared Spectroscopy (FTIR).
Surface morphology scanning was done with SEM and Electron Diffraction Spectroscopy was used to identify traces of impurities and also to scan the surface morphology of the raw material. FTIR is done to identify the functional groups present in the raw material.
Thermal characterisation was also performed to identify the melting temperature and other various thermal properties. Thermal Gravimetric Analysis (TGA) and Differential Scanning Calorimeter (DSC) are used to identify this criteria.
3.3 CHEMICALS AND MATERIALS
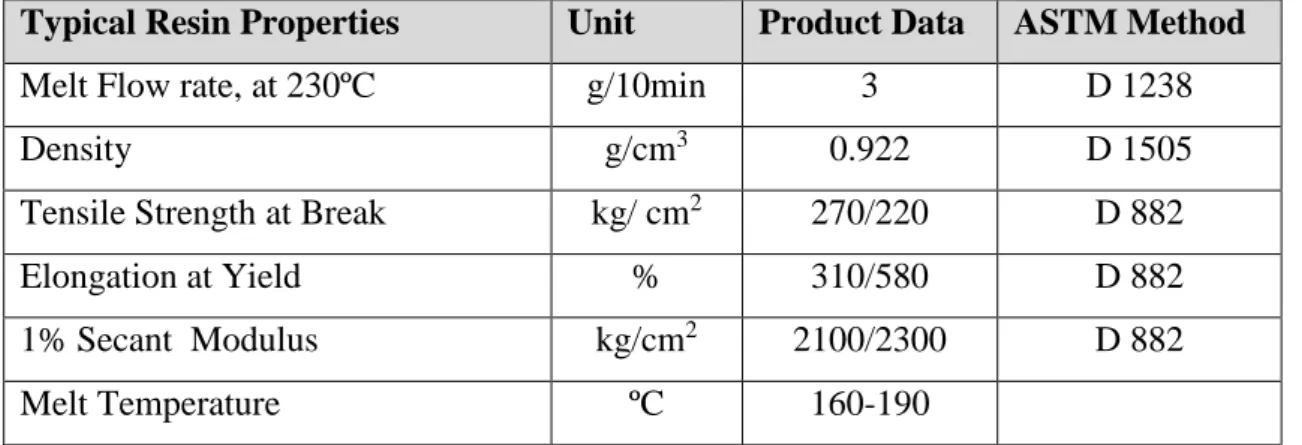
LDPE was obtained for Lotte Chemical Titan (M) Sdn. Bhd whilst, the glass fibre was obtained from local vendor in Jelapang, Malaysia. The glass fibre obtained is 450gm chopped strand mat. As for the LDPE, the grade obtained is “Titanlene LDF201FG” and the properties are listed in the Table 3.1 below. The specific type of grade is used in the production of the film extrusion and plastic bag.
Typical Resin Properties Unit Product Data ASTM Method
Melt Flow rate, at 230ºC g/10min 3 D 1238
Density g/cm3 0.922 D 1505
Tensile Strength at Break kg/ cm2 270/220 D 882
Elongation at Yield % 310/580 D 882
1% Secant Modulus kg/cm2 2100/2300 D 882
Melt Temperature ºC 160-190
Table 3.1: Properties of LDPE Titanlene LDF201FG
18
Figure 3.1: Process Flow Raw Material
Synthesis Pure Low Density Polyethylene
Synthesis Low Density Polyethylene with Glass fibre Characterisation of raw
material
Characterisation Analysis Scanning Electron Microscopy Fourier Transform Electron
Spectroscopy (FTIR)
Mechanical Analysis Tensile Test
Thermal Analysis Thermalgravimetric analysis Differential Scanning Electrometer Characterisation
Analysis Scanning Electron Microscopy Fourier Transform Electron
Spectroscopy (FTIR)
Mechanical Analysis Tensile Test
Thermal Analysis Thermalgravimetric analysis Differential Scanning Electrometer
19 3.4 SYNTHESIS OF SAMPLE
The experiment was divided into two parts. The first part was synthesising pure LDPE with varied pressure. As for the second part, the weight percentage of the glass fibre is manipulated in synthesising the reinforced polymer composite.
The synthesis method involves three steps; pre-heating, moulding and cooling down. The temperature was kept at constant throughout the entire the experiment which was 175 ºC.
Similarly to the temperature, the cooking time was also kept constant. This was to ensure the validity of the parameters tested.
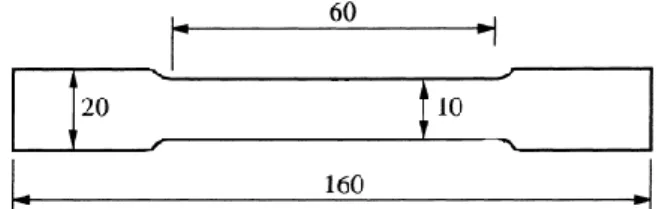
The Figure 3.2 shows the sample dimension and shape. This shape is known as dumb-bell shape or dog-bone shape. The desired size was preferred in order to perform the ASTM D638 standards. ASTM D638 was chosen as the preferred sample standard due to the accreditation given to the university, hence certifying the experiments are done meeting with international standard requirements.
Figure 3.2: Sample dimension according to ASTM D638
3.4.1 Synthesis under Varied Pressure
LDPE was synthesised under various pressure to investigate on the effect of pressure on the sample’s mechanical properties. Besides that, this experiment was also done to determine under which pressure the samples yield highest tensile strength. The samples were prepared under three different pressure.
Table 3.2 Process variables
Sample Pressure (ton/force)
1 6
2 9
3 12
20
Each sample were maintained at constant temperature and the melting time was also kept at constant. The samples were allowed to melt and cook for 20 minutes and left to cool down to room temperature after, which took about an hour and half.
3.4.2 Synthesis with Varied Weight Percentage of Glass Fibre
Composite material was produced by mixing glass fibre to the composite. The weight required for the glass fibre was determined through the lean LDPE sample that was produced in the previous experiment. The pressure was maintained at 12 ton force throughout the experiment. The formula used to determine the required glass fibre weight is as follows:
𝑊𝑒𝑖𝑔ℎ𝑡 𝑜𝑓 𝑔𝑙𝑎𝑠 𝑓𝑖𝑏𝑟𝑒 = ∑𝑛=5𝑖=1𝑥𝑖
𝑛 × 𝑑𝑒𝑠𝑖𝑟𝑒𝑑 𝑝𝑒𝑟𝑐𝑒𝑛𝑡𝑎𝑔𝑒 (Equation 5)
Where 𝑥: Pure LDPE sample weight.
The weight percentage that is used for this experiment are shown in Table 3.3 Weight Percentage of
LDPE (%)
Weight Percentage of Glass Fibre (%)
100 0
90 10
85 15
80 20
Table 3.3: Mix Formulation
21 3.5 MECHANICAL ANALYSIS
ASTM D638 standard mould samples were subjected to tensile test. The test gave the data for elastic modulus, tensile strength, and elongation at break. All the data was tabulated by the software. The results were compared with the standard reference mould which was the pure LDPE sample.
The samples were initially measured for its thickness and width using digital micrometre screw gauge and digital Vernier callipers. The average values were used in the system. As for the elongation time period, the experiment was conducted at 10mm/min.
3.6 THERMAL ANALYSIS
Thermal analysis was performed with the samples to identify the thermal stability.
The equipment used was DSC and TGA. The pure sample’s results were used as standard reference. The changes in melting point and other various thermal elements were tested.
The changes were then co-related to the chemical structure influenced by the glass fibre and how different weight percentage affects the thermal stability. Besides than that, the glass transition temperature for the composite also determined using the equation developed by Fox:
1 𝑇𝑔= 𝑥1
𝑇𝑔,1+1−𝑥1
𝑇𝑔,2 (Equation 6)
Where x1 denotes the mass fraction of the sample.
Since the composite is a binary system, we can employ this method to identify the glass transition temperature of the composite. It is necessary for the system to be binary in order to identify the properties of the composite materials utilising the data of the pure components.
The percentage of crystallinity was also determined after performing Differential Scanning Calorimeter. The formula employed is as below:
𝑃𝑒𝑟𝑐𝑒𝑛𝑡𝑎𝑔𝑒 𝑜𝑓 𝐶𝑟𝑦𝑠𝑡𝑎𝑙𝑙𝑖𝑛𝑖𝑡𝑦 = 𝐻𝑒𝑎𝑡 𝑜𝑓 𝐹𝑢𝑠𝑖𝑜𝑛 𝑜𝑓 𝑠𝑎𝑚𝑝𝑙𝑒,∆𝐻𝑓,𝑥
𝐻𝑒𝑎𝑡 𝐹𝑢𝑠𝑖𝑜𝑛 𝑜𝑓 100% 𝑐𝑟𝑦𝑠𝑡𝑎𝑙,∆𝐻𝑓 (Equation 7)
22
This formula is used to calculate on the crystallinity of the sample. By determining the crystallinity, the percentage of amorphous region also can be figured out. Using this data, the percentage elongation of the sample can be justified.
3.7 CHARACTERISATION
The synthesised moulds were sent to characterisation analysis. The Table 3.4 shows the analysis that was used.
Equipment Functions
Fourier Transform Infrared Spectroscopy (FTIR)
To examine the particles and morphology of the pure and composite materials that
have been synthesised
Scanning Electron Microscopy To characterise the surface morphology and cross section of the prepared samples.
Electron Diffraction Spectroscopy To identify the additives that was used in the production of the raw material Table 3.4 Characterisation Analysis
23
CHAPTER 4: RESULTS AND DISCUSSION
4.1 CHARACTERISATION OF RAW MATERIALS
The LDPE pellets obtained from Titan Chemicals were characterised using Scanning Electron Microscope and Fourier Transform Infrared Spectroscopy.
4.1.1 Scanning Electron Microscope
Figure 4.1 shows the surface morphology of LDPE pallet at 1000x magnification.
Figure 4.1: Pure LDPE Magnified 1000x
The surface shows clear morphology and traces of impurities. The grey areas in the Figure 4.1 are carbon and hydrogen elements with trace impurities of nitrogen and oxygen.
The white spots are composed of carbon, oxygen, silicon and magnesium. This data are obtained through the Electron Diffraction Spectroscopy. It can be said that surface of the LDPE pellets are clean and filled with almost 98% of carbon and hydrogen. Spots marked from 1 to 4 were subjected to EDS analysis as observed from Figure 4.2 to Figure 4.5.
2 1
3 4
24 Spot 1:
Element Number
Element Symbol Element Name Confidence Concentration Error
6 C Carbon 100.0 27.8 0.6
30 Zn Zinc 100.0 42.2 0.8
7 N Nitrogen 100.0 17.6 1.9
8 O Oxygen 100.0 12.5 3.1
Figure 4.2: Graph of Certainty for Spot 1 Spot 2:
Element Number
Element Symbol Element Name Confidence Concentration Error
6 C Carbon 100.0 15.7 0.7
8 O Oxygen 100.0 59.2 0.7
14 Si Silicon 100.0 10.4 0.7
12 Mg Magnesium 100.0 14.6 0.9
Figure 4.3: Graph of Certainty for Spot 2
25 Spot 3:
Element Number
Element Symbol Element Name Confidence Concentration Error
6 C Carbon 100.0 16.0 0.6
8 O Oxygen 100.0 59.6 0.7
14 Si Silicon 100.0 10.1 0.7
12 Mg Magnesium 100.0 14.2 0.9
Figure 4.4: Graph of Certainty for Spot 3 Spot 4:
Element Number
Element Symbol Element Name Confidence Concentration Error
6 C Carbon 100.0 52.7 0.4
7 N Nitrogen 100.0 20.8 3.9
8 O Oxygen 100.0 26.5 3.9
Figure 4.5: Graph of Certainty for Spot 4
26
From the graphs and table, it can be said that the traces of impurities are silicon, magnesium and little bit of zinc; the additives used in manufacturing LDPE.
4.1.2 Fourier Transform Infrared Spectroscopy (FTIR)
The raw material was powdered using the granulators and tested for the identification of the functional groups. Figure 4.6 shows the result obtained from FTIR.
Figure 4.6: FTIR for Pure LDPE
By cross referencing the peaks the results are as follows.
Peak No. Bond Type of bond Adsorption peak Appearances
1 C-H Methylene 2900 – 3600 Strong
2 C-C Acyclic 1400 – 1700 Weak
3 C-X Halo-Alkanes 550-900 Weak – Medium
Table 4.1: FTIR Standard Peak Analysis
The functional group for halo-alkanes are found in trace amounts during the SEM analysis.
1
2
3
27 4.2 MECHANICAL ANALYSIS
ASTM D638 method was used to determine the tensile strength of the samples. The samples were either tested until necking or breaking. The average data was tabulated and graphed accordingly.
4.2.1 Tensile Test under Varied Pressure
Five samples were created for different pressure. The average value from the tensile test for tensile strength and percentage of elongation at break is recorded in the Table 4.2.
Pressure (Ton/Force) Tensile Strength (N/mm2) Elongation at break (%)
6 10.61 206.05
9 10.75 76.25
12 10.98 46.74
Table 4.2: Tensile Test for Samples under Varied Pressure
According to the results shown in Table 4.2, by increasing the pressure, the tensile strength of the sample increased. Although the increase in tensile strength is marginal, the varied pressure has a certain degree of effect towards the tensile strength.
Figure 4.7: Tensile Strength vs. Pressure
When the samples were compressed under higher pressure, the vacant spaces between the carbon hydrogen chains were reduced. When the vacant spaces were reduced, the samples are compacted resulting in higher tensile strength. This can be observed from the Figure 4.7, where the general trend shows increase in the tensile strength.
10.61
10.75
10.98
10.4 10.5 10.6 10.7 10.8 10.9 11
6 9 12
Tensile Strength
Pressure
28
Figure 4.8: Percentage of Elongation at Break vs. Pressure
The Figure 4.8 shows a steady decrease in the percentage of elongation at break. The tensile strength is inversely proportional to the percentage of elongation at break. Meaning that with the increase of the tensile strength, the percentage of elongation at break is certain to decrease.
Since sample under 12 ton/force gave the highest tensile strength, the pressure of 12 ton/force was used for the experiment of varied glass fibre.
4.2.2 Tensile Test with Varied Weight Percentage of Glass Fibre
Five samples with various weight percentage glass fibre according to the mix formulation was prepared using compression moulding at 12 ton/force. The average results are according to Table 4.3.
Sample Reference Tensile Strength (N/mm2) % Elongation at break
Pure LDPE 10.976 46.736
LDPE with 10% GF 11.968 21.117
LDPE with 15% GF 12.944 17.631
LDPE with 20% GF 16.930 6.805
Table 4.3:Tensile Test for Samples under Varied Glass Fibre Concentration
The results shows steady increase in the tensile strength while an asymptotic drop in the percentage of elongation at break. Figure 4.9 and Figure 4.10 are plotted to give a better understanding on the trend of the results.
206.05
76.25
46.74
0 20 40 60 80 100 120 140 160 180 200 220
6 9 12
Elongation at break (%)
Pressure
29
Figure 4.9: Tensile Strength vs. Varied Glass Fibre Concentration
Figure 4.10: Percentage of Elongation at Break vs. Varied Glass Fibre Concentration
With the addition of glass fibre to LDPE, the tensile strength has increased. The increase factor for 10% glass fibre is about 1.10 while for 15% and 20% are 1.18 and 1.54. The increase in strength is due to the modification of the crosslinking between the components.
The glass fibre acts as a binder for LDPE resulting in increase in tensile strength. However, with the increase of tensile strength, the elongation at break reduced.
Similar results are observed from Somnuk et al (2004) and AlMaadeed et al (2013), who have studied the adhesion between the glass fibre and polyethylene composites. Besides that, Ayadi et al (2011) backed a similar trend for a study involving high density
10.976
11.968 12.944
16.93
0 2 4 6 8 10 12 14 16 18
Pure LDPE LDPE + 10%GF LDPE + 15%GF LDPE + 20%GF
Tensile Strength
0 5 10 15 20 25 30 35 40 45 50
Pure LDPE LDPE + 10%GF LDPE + 15%GF LDPE + 20%GF
% Elongation at break
30
polyethylene, where it was found out that the mechanical and thermal properties were improved with the addition of glass fibre.
The chain structure defines the tensile strength and the percentage of elongation at break.
The long carbon hydrogen branched network with are filled with glass fibre, which results in the increase of the tensile strength. The increasing trend for the tensile strength can be explained in terms of the long chain branching. LDPE contains high concentration of long network of carbon branching which has a strong interaction with glass fibre through the formation of a network entanglement.
Due to the increase of tensile strength, the elongation at break shows an opposite trend of tensile strength. Pure LDPE which is less crystalline, was able to extend to higher elongations due to their flexibility of its amorphous phase.
4.3 THERMAL ANALYSIS
4.3.1 Thermal Gravimetric Analysis (TGA)
TGA is performed to identify the thermal degradation of the various samples. Samples were left to run until complete thermal degradation. The graphs were plotted using the software and then integrated into one compound graph for better comparisons. The Figure 4.11 shows the compound graph for the various sample with varied weight percentage of glass fibre.
Figure 4.11: Thermogram 0
10 20 30 40 50 60 70 80 90 100
100 150 200 250 300 350 400 450 500
WEIGHT (%)
TEMPERATURE (OC)
LDPE
LPDE +10% GF LPDE +15% GF LDPE +20%GF
31
According to Figure 4.11, although the trend of the graph is similar to each other, the thermal degradation temperature for each sample is different. For pure LDPE the thermal degradation temperature is at 420℃. Where else for the samples with glass fibre exhibit increase in the thermal degradation temperature. For sample with 10% glass fibre, the temperature is at 433℃ and for sample with 15% glass fibre recorded at 437℃. Sample with 20% glass fibre recorded the highest degradation temperature which is at 440℃.
Similar trend in results were observed by different researches. AlMaadeed et al (2013) observed a similar trend in results, where the degradation temperature for the reinforced polymer composite is higher than that of the pure material.
4.3.2 Differential Scanning Calorimeter (DSC)
DSC was performed after TGA was completed. This is to ensure that the graduation temperature is within the limit of the system. TGA is generally done to find the glass temperature, crystallisation temperature or melting temperature. Figure 4.12 shows the results obtained after running the reinforced samples with DSC.
Figure 4.12: DSC Results
The peaks from the Figure 4.12 indicates the melting temperature for the samples. All the samples exhibit almost the same temperature with a variation of a degree or two between them.
A simple correlation that can be related between LDPE melting temperature and percentage of crystallinity is that, melting temperature is directly proportional to the
32
percentage of crystallinity. Hence with the slight increase in melting temperature, the percentage of crystallinity also increases. The long carbon branching in LDPE prevents the regular packing of the polymer molecules into a highly crystalline form. With the addition of glass fibre, the percentage of crystallinity increases. This is because, the surface of glass fibre act as nucleating agents upon crystallization. Similar results were obtained by Badai et al and Mariam et al, where with the addition of glass fibre, the surface area for nucleation is higher, hence an increased percentage of crystallinity.
4.4 CHARACTERISATION ANALYSIS 4.4.1 Scanning Electron Microscopy
The breaking point for the pure LDPE and the reinforced polymer composite were scanned under SEM to study the surface morphology. Figure 4.13 to Figure 4.16 shows the magnification of the breaking point of the samples at various magnification.
Figure 4.13: Surface Morphology at Breaking of Pure LDPE
33
Figure 4.14: Surface Morphology at Breaking of LDPE with 10% GF
Figure 4.15: Surface Morphology at Breaking of LDPE with 15% GF
34
Figure 4.16: Surface Morphology at Breaking of LDPE with 20% GF
Figure 4.13 shows the breaking of the pure LDPE, where the breaking is clean and the stretch of the elongation can be noticed evidently. However for the Figure 4.14 to Figure 4.16, it can see the breaking occurs mainly at the tip of the glass fibre. Various weight percentage of the samples also can be noticed filling the voids. The fibre pulled out phenomenon is observed when fibre-matrix adhesion is not very good. With increasing glass fibre, the percentage of crystallinity increases which results in stronger bonds between the fibre and polymer matrix. Thus the tensile strength increases. The networks formed between the long carbon chains are destroyed when the load exceeds the ultimate tensile strength which can be observed through the SEM photographs, where the micro fibre is pulled out.
35
CHAPTER 5: CONCLUSION AND RECOMMENDATIONS
5.1 CONCLUSION
The results obtained supports the objectives of the project.
Using LDPE and GF, polymer reinforced composites were synthesised. 12 ton/force is chosen to synthesis the samples for varied weight percentage of glass fibre.
The tensile strength with 20% GF yields composition the highest value whilst comparing with pure, 10% GF and 15% GF. It has an increase factor of 1.54 while the rest records an increase factor of 1.10 and 1.18 when they are compared with pure LDPE. The thermal degradation temperature showed slight increase for the highest weight percentage reinforced polymer composite.
The surface morphology between the four samples were done to study how glass fibres fill the void and how it is related to the tensile strength. FTIR analysis was also done to identify the functional groups present in the sample pellets.
36 5.2 RECOMMENDATIONS
The project can be further improvised by using different fillers or binders. Since this project incorporated the use of chopped glass fibre, the experiment can be modified with the use of woven glass fibre or continuous glass fibre.
Other than that this experiment also can be modified further by introducing various other chemical or organic fillers. Fillers such as anti-static or sugar cane fibre can be used to determine the tensile strength and various other thermal and mechanical properties in order to expand the marketability of composite LDPE.
This project used compression moulding technique to produce the samples. With the use of extruder and vertical injection moulding, there could be significant changes in the thermal properties as well as the chemical properties.
Besides, varying the orientation of the glass fibre could also provide variation in the results. Neatly arranged, cross-cut alignment, or random alignment of the glass fibre could provide some variation in the results obtained.
37
REFERNCES
1. Lab Extrusion. Retrieved 06/27, 2014, from
http://www.leistritz.com/extrusion/en/03_applications/laborextrusion.html
2. Plastic Properties of Low Density Polyethylene (LDPE). Dynalab Corp. Retrieved 06/27, 2014, from http://www.dynalabcorp.com/technical_info_ld_polyethylene.asp 3. Izod Tests - Determination of Impact Energy Using the Izod Test. (2005,
06/11/2013). Retrieved 6/27, 2014, from
http://www.azom.com/article.aspx?ArticleID=2765
4. Low Density Polyethylene. (2008). Plastics Europe. Retrieved 06/27, 2014, from http://www.plasticseurope.org/Documents/Document/20100312112214-
FINAL_LDPE_270409-20081215-018-EN-v1.pdf
5. Polyethylene. (2011). Plastics Historical Society. Retrieved 06/27, 2014, from http://www.plastiquarian.com/index.php?id=86
6. Differential Scanning Calorimetry (DSC) Theory. (2013). Particle Analytical.
Retrieved 06/27, 2014, from http://particle.dk/methods-analytical-laboratory/dsc- differential-scanning-calorimetry/dsc-theory/
7. Extrusion Process Basic. (2014). Retrieved 06/27, 2014, from http://www.aec.org/basics/basics.cfm
8. AlMaadeed, M. A., Ouederni, M., & Noorunnisa Khanam, P. (2013). Effect of chain structure on the properties of Glass fibre/polyethylene composites. Materials &
Design, 47(0), 725-730. doi: http://dx.doi.org/10.1016/j.matdes.2012.11.063 9. Arrakhiz, F. Z., El Achaby, M., Malha, M., Bensalah, M. O., Fassi-Fehri, O.,
Bouhfid, R., Qaiss, A. (2013). Mechanical and thermal properties of natural fibers reinforced polymer composites: Doum/low density polyethylene. Materials &
Design, 43(0), 200-205. doi: http://dx.doi.org/10.1016/j.matdes.2012.06.056 10. Deng, C., Zhao, J., Deng, C.-L., Lv, Q., Chen, L., & Wang, Y.-Z. (2014). Effect of
two types of iron MMTs on the flame retardation of LDPE composite. Polymer Degradation and Stability, 103(0), 1-10. doi:
http://dx.doi.org/10.1016/j.polymdegradstab.2014.03.001
11. Gamze Karsli, N., Yesil, S., & Aytac, A. (2014). Effect of hybrid carbon nanotube/short glass fiber reinforcement on the properties of polypropylene composites. Composites Part B: Engineering, 63(0), 154-160. doi:
http://dx.doi.org/10.1016/j.compositesb.2014.04.006
38
12. Herrera-Franco, P. J., & Aguilar-Vega, M. d. J. (1997). Effect of fiber treatment on the mechanical properties of LDPE-henequen cellulosic fiber composites. Journal of Applied Polymer Science, 65(1), 197-207. doi: 10.1002/(SICI)1097-
4628(19970705)65:1<197::AID-APP24>3.0.CO;2-#
13. Höhne, G., Hemminger, W., & Flammersheim, H. J. (2003). Differential Scanning Calorimetry: Springer.
14. Johnson, T. (2014). Uses of Fibreglass. Composites / Plastics. Retrieved 06/27, 2014, from http://composite.about.com/od/aboutglass/a/Uses-Of-Fiberglass.htm 15. Lepoutre, P. (2018). The Manufacture of Polyethylene. New Zealand Institute of
Chemistry. Retrieved 06/27, 2014, from
http://nzic.org.nz/ChemProcesses/polymers/10J.pdf
16. Lezzi, P. J., Seaman, J. H., & Tomozawa, M. (2014). Strengthening of E-glass fibers by surface stress relaxation. Journal of Non-Crystalline Solids, 402(0), 116-127. doi:
10.1016/j.jnoncrysol.2014.05.029
17. O'Neill, B. (2008, 2014). Hardness Testing. Retrieved 06/27, 2014, from http://www.buehler.com/node/4259
18. O'Neill, B. (2008). Master Hardness Testing. Retrieved 27, 2014, from http://www.qualitymag.com/articles/89175-master-hardness-testing
19. Schweitzer, J. (2014). Scanning Electrom Microscope. Retrieved 06/27, 2014, from http://www.purdue.edu/ehps/rem/rs/sem.htm
20. Shuidong, Z., Lingcao, T., Jizhao, L., Hanxiong, H., & Guo, J. (2014). Relationship between structure and properties of reprocessed glass fiber reinforced flame
retardant poly (butylene terephthalate). Polymer Degradation and Stability, 105(0), 140-149. doi: http://dx.doi.org/10.1016/j.polymdegradstab.2014.04.009
21. University, M. (Producer). (2011, 2014). Thermal Analysis. Retrieved from http://www.chem.mun.ca/courseinfo/c3110/TGA%20lecture%202011.pdf 22. Varga, C., Miskolczi, N., Bartha, L., & Lipóczi, G. (2010). Improving the
mechanical properties of glass-fibre-reinforced polyester composites by modification of fibre surface. Materials & Design, 31(1), 185-193. doi:
http://dx.doi.org/10.1016/j.matdes.2009.06.034
39