Characterization of Solid Biomass Fuel Briquettes By
Md Nasrun Faris bin Mohd Aznan
Dissertation submitted in partial fulfillment of the requirements for the
Bachelor of Engineering (Hons) (Mechanical Engineering)
SEPTEMBER 2012
Universiti Teknologi PETRONAS Bandar Seri Iskandar
31750 Tronoh Perak Darul Ridzuan
i
CERTIFICATION
CERTIFICATION OF APPROVAL
Characterization of Solid Biomass Fuel Briquettes
by
Md Nasrun Faris Bin Mohd Aznan A project dissertation submitted to the
Mechanical Engineering Programme Universiti Teknologi PETRONAS in partial fulfilment of the requirement for the
BACHELOR OF ENGINEERING (Hons) (MECHANICAL ENGINEERING)
Approved by,
(MS CHIN YEE SING) (MS CHIN YEE SING)
UNIVERSITI TEKNOLOGI PETRONAS TRONOH, PERAK
September 2012
ii
CERTIFICATION OF ORIGINALITY
This is to certify that I am responsible for the work submitted in this project, that the original work is my own except as specified in the references and acknowledgements, and that the original work contained herein have not been undertaken or done by unspecified sources or persons.
MD NASRUN FARIS BIN MOHD AZNAN (MD NASRUN FARIS BIN MOHD AZNAN)
iii
ACKNOWLEDGMENT
The authors would like to acknowledge with appreciation the numerous valuable comments, suggestions, constructive criticisms, morale support and monetary support from all people, lecturers, family and friends:
Supervisor, Ms Chin Yee Sing
Mechanical Department UTP staffs and lab technicians Civil Department UTP staffs and lab technicians Chemical Department UTP staffs and lab technicians Friends in nearest circle of life
Kilang Sawit FELCRA Nasaruddin and staffs
Their contribution to the completion of this work is very valuable.
iv ABSTRACT
The objective of this final year project is to characterize solid biomass fuel briquettes. The research involves conducting several analysis; proximate analysis, ultimate analysis, combustion test, calorific value determination, and burning temperature profile investigation. From these analyses and tests, the materials are characterized and discussed.
Energy demand keeps on increasing day by day. Demand of electricity is usually met by power generation plants that use fossil fuel to generate heat. Current consumption of non-renewable energy from fossil fuel is very high, thus alternative source of energy, renewable energy should be considered. Since Malaysia is one of the largest producers of oil palm in the world, the waste of the production should be huge too.
Thus, oil palm mill residue is selected to be material of interest here. This renewable energy source is a good alternative to generate electricity by using it as fuel. Since most biomass materials are in loose form, random shapes, and not really efficient to be used as fuel directly from their raw states, briquetting them is one of the good moves in order for them to be used in controlled manner. Prior to briquetting, materials would be dried to a desired level of moisture content, unmixed or mixed with other materials for better properties, and compressed into regular shapes. This uniform shape would be beneficial in terms combustion characteristics as they would give controlled manner in terms of combustion rate, energy content and precise operation for plants usage.
v
T
ABLE OFC
ONTENTSCERTIFICATION ... i
ACKNOWLEDGMENT ... iii
ABSTRACT ... iv
CHAPTER 1: INTRODUCTION ... 1
Background of Study ... 1
1.1. Problem Statement... 2
1.2. Objective and Scope of Study ... 3
1.3. Relevancy and Feasibility... 5
1.4. CHAPTER 2: LITERATURE REVIEW ... 6
Briquetting ... 6
2.1. Materials for Biomass Fuel Briquette ... 6
2.2. Parameters Affecting Quality of Biomass Fuel Briquette ... 7
2.3. 2.3.1. Binder ... 7
2.3.2. Particle Size ... 7
2.3.3. Briquette Shape ... 8
2.3.4. Compressive Force ... 8
Analysis Method ... 8
2.4. 2.4.1. Proximate Analysis ... 8
2.4.2. Ultimate Analysis ... 10
2.4.3. Calorific Value Determination ... 10
2.4.4. Temperature Profile Investigation ... 10
CHAPTER 3: METHODOLOGY ... 11
Research Methodology ... 11
3.1. Project Activities ... 12
3.2. 3.2.1. Materials Gathering ... 12
3.2.2. Mould Fabrication ... 13
3.2.3. Drying ... 14
3.2.4. Grinding and Sieving ... 15
3.2.5. Weighing and Mixing ... 15
3.2.6. Briquetting ... 17
3.2.7. Materials Analysing ... 18
Gantt Chart and Key Milestones ... 20
3.3. Tools and Software ... 22 3.4.
vi
CHAPTER 4: RESULTS AND DISCUSSION ... 26
Proximate Analysis ... 26
4.1. Ultimate Analysis ... 34
4.2. Calorific Value Determination ... 35
4.3. 4.3.1. Experimental vs Correlation HHV ... 36
4.4. Combustion Test 38 4.5. Temperature Profile Investigation 47 CHAPTER 5: CONCLUSION AND RECOMMENDATION ... 50
Conclusion ... 50
5.1. Recommendations ... 51
5.2. REFERENCES ... 52
APPENDICES ... 55
APPENDIX A: TGA DATA FOR ALL SAMPLES ... 56
APPENDIX B: ULTIMATE ANALYSIS DATA... 60
APPENDIX C: BOMB CALORIMETER DATA... 62
APPENDIX D: AIR FUEL RATIO FOR COMBUSTION TEST 64 APPENDIX E: COMBUSTION TEST DATA ... 66
APPENDIX F: TEMPERATURE PROFILE INVESTIGATION DATA ... 69
vii LIST OF FIGURES
Figure 2.1: Example of TGA graph ... 9
Figure 3.1: Flow chart of study ... 11
Figure 3.2: Oil palm shell ... 12
Figure 3.3: Oil palm fibre... 12
Figure 3.4: Palm frond ... 13
Figure 3.5: Empty fruit bunch ... 13
Figure 3.6: Sugarcane... 13
Figure 3.7: Sawdust ... 13
Figure 3.8: 15 mm doughnut shape mould ... 14
Figure 3.9: Mild steel material ... 36
Figure 3.10: Full disk shape mould ... 14
Figure 3.11: 8 mm doughnut shape mould ... 14
Figure 3.12: Materials during sieving ... 15
Figure 3.13: Group 1 (small particle) materials ... 15
Figure 3.14: Samples after weighted and put in plastic container ... 16
Figure 3.15: Briquettes mad after pressing ... 17
Figure 3.16: Full disk shape ... 17
Figure 3.17: 8 mm doughnut shape ... 17
Figure 3.18: 15 mm doughnut shape ... 17
Figure 4.1: HHV correlation from proximate analysis ... 27
Figure 4.2: PS+PF+SC burning profile ... 29
Figure 4.3: PS+PF+SD burning profile... 30
Figure 4.4: PS+PF+EFB burning profile ... 31
Figure 4.5: PS+PF+PFr burning profile ... 32
Figure 4.6: PS+PF burning profile ... 33
Figure 4.7: Percentage of carbon content of different materials ... 34
Figure 4.8: Experiment HHV obtained from bomb calorimeter ... 35
Figure 4.9: HHV correlation vs HHV experiment ... 36
Figure 4.10: Rate of energy and total energy released by big particle and 100 kN compression briquettes ... 39
viii
Figure 4.11: Rate of energy and total energy released by big particle and 200 kN compression briquettes ... 40 Figure 4.12: Rate of energy and total energy released by small particle and 100 kN compression briquettes ... 41 Figure 4.13: Rate of energy and total energy released by small particle and 200 kN compression briquettes ... 42 Figure 4.14: Average rate of energy released from different compression force for big particle briquettes ... 43 Figure 4.15: Average rate of energy released from different compression force for small particle briquettes ... 44 Figure 4.17: Thermography sequence photo of burning fuel briquettes; (a) initial burning, (b) full disk shape briquette burn at all surface, (c) full disk shape briquette half completed burnt, (d) full disk shape briquette burnt completely ... 47
ix LIST OF TABLES
Table 3.1: Weight percent for materials to be briquetted ... 16
Table 3.2: Gantt chart and key milestone for FYP 1... 20
Table 3.3: Gantt chart and key milestone for FYP 2... 21
Table 3.4: Analysis equipment and its purpose ... 22
Table 3.5: Software and their purpose ... 25
Table 4.1: Proximate analysis data... 26
Table 4.2: Ultimate analysis data ... 34
Table 4.3: Data on total energy and average rate of energy released ... 38
Table 4.4: Positions of solid fuel briquettes ... 47
x LIST OF ABBREVIATIONS
AC Ash content
CHNS Carbon hydrogen nitrogen and sulfur CNC Computer numerical control
EFB Empty fruit bunch
FC Fixed carbon
HHV High heating value MC Moisture content
PF Palm fibre
PFr Palm frond
PS Palm shell
SC Sugar cane
SD Sawdust
TGA Thermogravimetry analysis VM Volatile matter
WT Weight
1
CHAPTER 1: INTRODUCTION
Background of Study 1.1.
Malaysia is one of the world largest producers of oil palm [1][2]. As in March 2012, Malaysia has five million hectares (5024894 ha) of oil palm planted area [3]. This number of plantation area gives huge potential of biomass as the oil palm processing will give lots of waste products; empty fruit bunch (EFB), oil palm shell (PS), oil palm fibre (PF) and palm frond (PFr). These waste products could be utilized as biomass fuel to generate heat for boilers. These wastes could be briquetted for better combustion properties and logistics issues [3].
Fuel briquettes are compressed form of biomass materials into regular shapes. One of the most common shapes of briquettes is a disk shape. Biomass fuel briquettes are commonly made from oil palm mills residue, baggase, wood chips, sludge and many more.
For biomass materials to be made into briquettes there are many issues to be considered so that they are worth to be made and can be used safely. In terms of energy content, several analyses can be done to quantify the energy content of biomass materials, which are proximate analysis, ultimate analysis and using bomb calorimeter. To justify the quality of combustion and rate of combustion, combustor can be used along with infrared camera to capture images of materials being burned.
From the images captured by infrared camera, analysis can be done to show the location of higher temperature and lower temperature.
2 Problem Statement
1.2.
Energy usage keeps on increasing day by day. To generate the energy required in daily life, especially the electricity, fossil fuel is used. The fuel is used to generate heat that be used to produce steam and generate electricity in steam power plant.
Apart from that, fuel is also burnt for other purpose and for that, current consumption of this non-renewable energy from fossil fuel is very high, thus alternative source of energy, renewable energy should be considered.
As Malaysia has abundant source of oil palm mill residues, these materials have high potential to be used as alternative energy, which is a renewable energy source.
However, there are parameters that need to be studied so that these materials could be practically used in daily life. If these materials are to be briquetted, parameters that affect combustion characteristics need to be studied and they include energy content, rate of combustion and elemental composition.
3 Objective and Scope of Study 1.3.
The aim of the research is to characterize solid biomass fuel briquettes. The detailed objectives of this study are as follows:
1. To study the effect of varying binders to the combustion characteristics 2. To study the effect of different particle sizes to the combustion characteristics 3. To analyse the impact of varying briquette shapes to combustion
characteristics
4. To compare the differences of combustion characteristics when different compressive force is used
Since Malaysia is one of the largest producer of oil palm in the world, the waste or by product of the production should be huge also. Thus, oil palm mill waste residue is selected to be material of interest here. There are a few oil palm mill residues that are selected to be used in this research. They are palm shell (PS), palm fibre (PF), empty fruit bunch (EFB), and palm frond (PFr). Apart from that, other waste materials like sawdust (SD) and sugarcane (SC) are also considered to be used as binders in fuel briquettes.
The scope of study in this research is easily presented as follows:
Manipulated variables:
a) Binder b) Particle size c) Briquette shape d) Compressive force
Through analysis of:
a) Proximate analysis
4 b) Ultimate analysis
c) Calorific value determination d) Combustion test
e) Temperature profile investigation
Details of manipulated variables:
a) Binder
Sawdust (SD)
Sugar cane (SC)
Empty fruit bunch (EFB)
Palm frond (PFr)
b) Particle size
Group 1 (small particle)
Main material (palm shell and palm fibre) less than 600 μm
Binders less than 425 μm
Group 2 (big particle)
Main material (palm shell and palm fibre) greater than 600 μm
Binders greater than 425 μm
c) Briquette shape
Full disk / solid shape
Doughnut / concentric hole of 8mm inner diameter
Doughnut / concentric hole of 15 mm inner diameter
d) Compressive force
100 kN
200 kN
5 Relevancy and Feasibility
1.4.
This project is relevant and feasible in Malaysia. The waste materials to be used in fuel briquette are available in huge amount and readily available throughout Malaysia. The availability of the materials help the research in finding the materials and the success of the research could be implemented in the industry in Malaysia directly.
6
CHAPTER 2: LITERATURE REVIEW
Briquetting 2.1.
Biomass briquetting is the work of compacting loose raw materials of biomass into a regular shape by application of pressure [4]. It increases the density and durability of biomass thus make it more appealing in handling and storage [5].
Materials for Biomass Fuel Briquette 2.2.
From previous researches, there have been many types of biomass materials used in biomass fuel briquette. Raw materials from rice husk, sawdust, waste paper, oil palm shell, oil palm fiber, oil palm fronds, sugar cane, and poultry sludge have been researched and from the research, many conclusions were drawn. From one of the research, a conclusion is made that combination of materials would yield better briquettes with better characteristics [7]. Research on dewatered poultry sludge has shown that the material has promising potential to be used as alternative solid fuel as the higher heating value (HHV) of the material was found to be higher than HHV of low-grade coal [6].
7
Parameters Affecting Quality of Biomass Fuel Briquette 2.3.
There are a few factors that affect the quality of biomass fuel briquette:
Binder
Particle size
Briquette shape
Compressive force 2.3.1. Binder
Different types of binder do affect the quality of biomass fuel briquette such as carbon content and calorific value. This is shown in a research using oil palm shell and fibre as main ingredients with binders from paper and starch, in which using paper, has higher value of HHV compared to using starch [8][9]. Even in research done by Sotannde et al., they concluded that the type of binder and blending ratio used will affect the physical and combustion properties of the briquettes [10].
From one research on oil palm mill residues, a finding that shows a mixture of 60%
palm kernel shell and 40% palm fibre with paper as binder is optimum ratio for viable solid fuel [8].
2.3.2. Particle Size
From previous research works, coarse particle size will give shorter duration of burning but less unburned carbon, compared to small particle size that allow longer duration of burning, but leave more unburned carbon at combustion termination [11].
8 2.3.3. Briquette Shape
Shapes of fuel briquette also affect quality of biomass fuel briquette, as conducted in a research using solid shape and concentric hole, in which the burn rate of briquette with concentric hole is higher compared to solid shape fuel briquette [6].
2.3.4. Compressive Force
In the same research also, different pressure of compression leads to different burn rate in which pressure at 5 MPa gives higher burn rate than 13 MPa [6].
Analysis Method 2.4.
There are several analysis methods that are common in biomass study and they are discussed as following subsections.
2.4.1. Proximate Analysis
Proximate analysis is an attempt to quantify certain key physical characteristics of biomass that could affect combustion characteristics and they include moisture content, volatile matter, fixed carbon and ash content [4]. Moisture content shows amount of water in samples. High moisture content can cause difficulty in ignition.
Volatile matter is components that turn into vapor when heated such as carbon, hydrogen and oxygen. Fixed carbon is a percentage of carbon that is available for char combustion. Ash content is the component that cannot be burnt and this could affect char combustion as it hinders oxygen diffusion to fuel surface.
For proximate analysis, thermogravimetry analyser (TGA) will be used. From proximate analysis, percentage of moisture content, volatile matter, fixed carbon and ash content can be obtained. These values can be used in correlation derived by
9
Parikh et al. to find high heating value (HHV) [12]. The correlation is given in equation 1 below.
HHV = 0.3536FC + 0.1559VM – 0.0078ASH (MJ/kg) (1)
In the correlation, three data obtained from proximate analysis are used which are fixed carbon (FC), volatile matter (VM) and ash content (ASH). This correlation has an average absolute error of 3.74% with respect to measured values of HHV, as derived by Parikh et al. [12].
From the correlation also, comparison of value can be done with experimental value obtained in calorific value test using bomb calorimeter.
Figure 2.1: Example of TGA graph [15].
10 2.4.2. Ultimate Analysis
Ultimate analysis is used to identify chemical elements in sample; carbon, hydrogen, nitrogen and sulfur. Using special equipment such as LECO CHNS-932, these elements are identified automatically and take least amount of time.
2.4.3. Calorific Value Determination
Calorific value is the energy content of a fuel and it is related to amount of oxygen that is required for complete combustion [5]. It can be done using bomb calorimeter.
2.4.4. Temperature Profile Investigation
Previous research was done on qualitative study of burning rates of different briquettes designs using infrared thermography. In the work, photos were taken using the infrared camera equipment, and the photos showed solid fuels with temperature profile. Based on the temperature profile, it can be seen the location of higher temperature and lower temperature qualitatively on the photos.
11
CHAPTER 3: METHODOLOGY
Research Methodology 3.1.
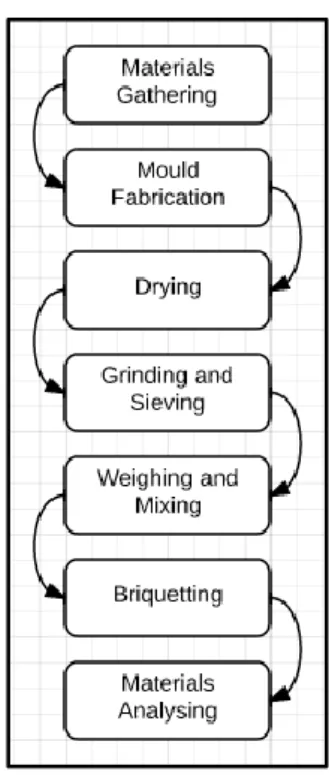
To conduct this project, simple methodology is drawn out. The project is initiated by knowing the problem statement first. After that, information is gathered further to know the background of the project or anything related to the problem statement. By understanding the information about the problem statement leads to material gathering and materials preparation. After all materials are prepared, experimenting can be done. From results obtained, data are then analysed and compared with previous works done by other researchers. After that, a conclusion is obtained in which meeting the objective of this research or not. The process flow chart of this research is simplified as in figure follows:
Figure 3.1: Flow chart of study
12 Project Activities
3.2.
In doing this research, there are many activities to be done. After understanding problem statement, literature review was done first to get more information on the project. In conducting this project, it was found that many analyses should be done to assess the materials to be used as fuel briquette. They included proximate analysis, ultimate analysis, calorific value determination, combustion test and temperature profile investigation. Prior to testing, material preparation was also discussed in detail.
3.2.1. Materials Gathering
Raw materials to be used in this research are palm shell, palm fibre, palm frond and empty fruit bunch (EFB), in which these were obtained from Kilang Sawit Felcra Nasaruddin in Bota, Perak. Other materials collected were sawdust from a sawmill in Ipoh, Perak and sugarcane from stalls selling drinks. Figure 3.2, Figure 3.3, Figure 3.5 show picture of oil palm shell, oil palm fibre and EFB obtained from Kilang Sawit Felcra Nasaruddin, Figure 3.4 shows palm frond obtained nearby Kilang Sawit Felcra Nasaruddin, Figure 3.6 and Figure 3.7 show picture of sugarcane obtained from stall that sells sugarcane drinks in Taman Maju, Perak while sawdust was obtained in a sawmill in Ipoh, Perak.
Figure 3.2: Oil palm shell Figure 3.3: Oil palm fibre
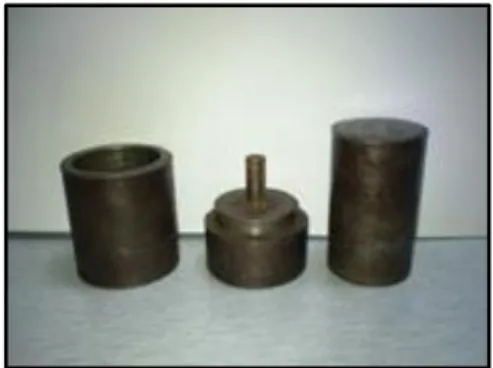
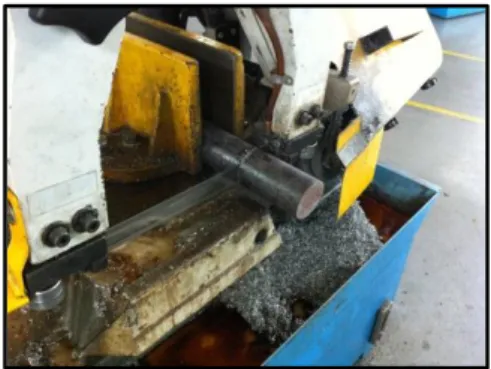
13 3.2.2. Mould Fabrication
To do briquetting, mould for full disk shape and doughnut shape of 8 mm inner diameter were already available, and obtained from previous work in Universiti Teknologi PETRONAS, shown in Figure 3.10 and Figure 3.11. Only doughnut shape of 15 mm inner diameter mould needed to be fabricated. The mould used was from mild steel. To fabricate this mould, a block of mild steel cylinder was cut into two and by using Computer Numerical Control (CNC) turning center, the mould was machined into desired shapes with high precision. Figure 3.8 was photo captured during the mould preparation. Figure 3.9 shows the mould manufactured.
Figure 3.4: Palm frond Figure 3.5: Empty fruit bunch
Figure 3.7: Sawdust Figure 3.6: Sugarcane
14
3.2.3. Drying
To prepare the materials, palm shell, palm fibre, palm frond, EFB, sugar cane and sawdust were dried in oven at 105 °C until a constant mass was obtained, and they were also subjected to sun drying before oven was used. Sun drying was done by exposing the materials under direct sunlight so that they could be dried. However, care was to be taken as they could be wet if they were not protected or moved away when rain falls.
Figure 3.9: 15 mm doughnut shape mould
Figure 3.8: Mold preparation
Figure 3.10: Full disk shape mould Figure 3.11: 8 mm doughnut shape mould
15 3.2.4. Grinding and Sieving
After drying the materials, they were ground into fine particles using granulator, mortar grinder and analytical mill grinder. After that, they were sieved into two groups which were group 1 and group 2. Group 1 (small particle) comprised of palm shell and palm fibre with less than 600 μm and binders less than 425 μm. Group 2 (big particle) comprised of palm shell and palm fibre with greater than 600 μm and greater than 425 μm for the binders. Figure 3.12 shows materials sieved using sieving equipment and Figure 3.13 shows group 1 (small particle) materials.
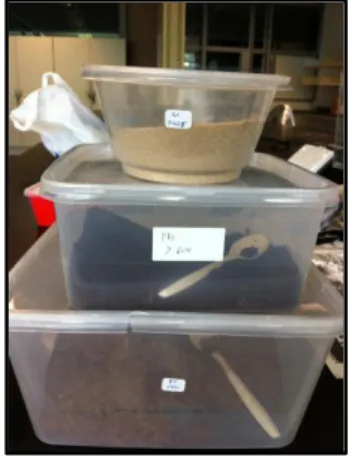
3.2.5. Weighing and Mixing
Fuel briquettes to be made were from different combination of materials and percentage. Main ingredients were palm shell and palm fibre, with binders from EFB, palm frond, sugar cane and sawdust. Main ingredients were in combination of 60 % palm shell and 40 % palm fibre. Each briquette was made from a total mass of 10 grams, with 90 % of main ingredients and 10 % binder. Samples are weighed as shown in Table 3.1 as follows:
Figure 3.13: Group 1 (small particle) materials Figure 3.12: Materials during sieving
16
Table 3.1: Weight percent for materials to be briquetted Weight %
Materials PS+PF+SC PS+PF+SD PS+PF+
EFB
PS+PF+
PFr
PS+PF
Palm Shell 54 54 54 54 60
Palm
Fibre 36 36 36 36 40
Sugar cane 10 0 0 0 0
Sawdust 0 10 0 0 0
EFB 0 0 10 0 0
Palm
Frond 0 0 0 10 0
The samples were weighed using mass balance to ensure precise mass fraction or composition. Figure 3.14 shows a photo after each type of samples were weighted and put into a plastic container.
Figure 3.14: Samples after weighted and put in plastic container
17 3.2.6. Briquetting
From here, briquetting could be done using Auto Pellet Machine. Briquetting process used different level of force, which were 100 kN (10200 kg) and 200 kN (20400 kg).
Figure 3.15 shows briquettes made after pressing.
Each type of combination of fuel briquette was shaped into 3 different shapes; full disk shape as in Figure 3.16, doughnut shape of 8 mm inner diameter as in Figure 3.17, and 15 mm inner diameter as in Figure 3.18. All shapes had outside diameter of 40 mm.
Figure 3.16: Full disk shape
Figure 3.17: 8 mm doughnut shape
Figure 3.18: 15 mm doughnut shape Figure 3.15: Briquettes made after pressing
18 3.2.7. Materials Analysing
3.2.7.1. Proximate Analysis
To study the combustion characteristics of the materials, several analysis were done.
Proximate analysis was done by using thermo gravimetric analyser (TGA). From this analysis, data of moisture content, volatile matter, fixed carbon and ash contents of the materials were obtained. These data could be used to estimate HHV value based on correlation by Parikh et al. The actual data obtained from TGA was data of weight change against time and temperature. From these, further analysis could be done and proximate analysis is one of them. In Universiti Teknologi PETRONAS, the TGA machine used was from Perkin Elmer, Pyris 1 TGA. Each powdered samples of about five (5) mg or less were required to conduct this analysis.
3.2.7.2. Ultimate Analysis
Ultimate analysis was done to obtain data on carbon, hydrogen, nitrogen and sulfur content. Equipment used in this study was from LECO CHNS-932 where the standard chemical for CHNS for carbon was 51.78%, hydrogen 5.07%, nitrogen 20.13% and sulfur 11.52%. This known reference material was called sulfamethazime.
3.2.7.3. Calorific Value Determination
To determine calorific value, a device called bomb calorimeter was used. From this experiment, higher heating values (HHV) for different materials were obtained.
These experimental values obtained would be used to compare those values obtained theoretically using a correlation by Parikh et al.
19
To conduct this test, a small amount of powdered samples were put into a pan and weighed using mass balance. This pan was then assembled in the component to be inserted inside the bomb calorimeter. Prior to start the bomb calorimeter, input of mass of sample was required as to give result of HHV.
3.2.7.4. Combustion Test
Combustion test was done using small combustor. From this experiment, rate of combustion and total of useful energy were obtained. Different shapes of briquette, particle size and compression force showed different rate of combustion.
In conducting the experiment, personal protective equipment (PPE) such as glove and shoes are necessary as this test involves combustion and high temperature.
3.2.7.5. Temperature Profile Investigation
To get temperature profile, an infrared camera was used to capture the image of burning fuel briquettes during the combustion. From the image captured, qualitative analysis was done to see the location of combustion and the rate of combustion of the fuel briquettes.
20 Gantt Chart and Key Milestones
3.3.
Table 3.2: Gantt chart and key milestone for FYP 1
Weeks
Tasks 1 2 3 4 5 6 7 8 9 10 11 12 13 14
Topic selection & allocation
Preliminary Research Work / Literatures Review
Submission of Extended Proposal Proposal Defence
Material Gathering Material Preparation
Submission of Interim Report
21
Table 3.3: Gantt chart and key milestone for FYP 2
Weeks
Tasks 1 2 3 4 5 6 7 8 9 10 11 12 13 14 15
Material Preparation Proximate Analysis Ultimate Analysis
Calorific Value Determination Combustion Test
Temperature profile investigation Prepare the Progress Report Submission of Progress Report Submission of FYP poster Submission of Draft Report
Submission of Dissertation (softbound) Submission of Technical Paper Oral Presentation
Submission of Project Dissertation (hardbound)
22 Tools and Software
3.4.
Many tools and equipment are required to conduct this research. They are listed in Table 3.4.
Table 3.4: Analysis equipment and its purpose
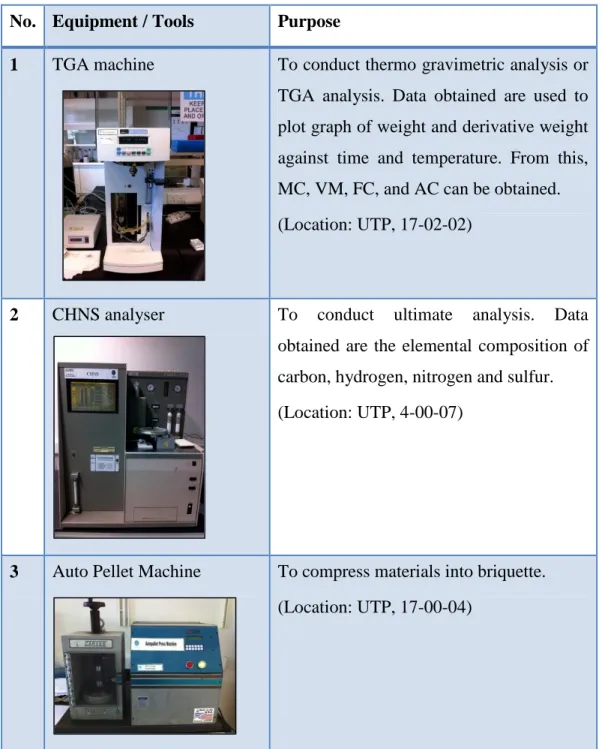
No. Equipment / Tools Purpose 1 TGA machine
To conduct thermo gravimetric analysis or TGA analysis. Data obtained are used to plot graph of weight and derivative weight against time and temperature. From this, MC, VM, FC, and AC can be obtained.
(Location: UTP, 17-02-02)
2 CHNS analyser To conduct ultimate analysis. Data obtained are the elemental composition of carbon, hydrogen, nitrogen and sulfur.
(Location: UTP, 4-00-07)
3 Auto Pellet Machine To compress materials into briquette.
(Location: UTP, 17-00-04)
23
4 CNC turning centre To fabricate mould.
(Location: UTP, 16-00-04)
5 Combustor To burn briquetted samples.
(Location: UTP, BLOCK H)
6 Infrared camera To capture images of burning samples inside small combustor.
(With: Ir. Dr. Mohd Shiraz Aris)
7 Oven To remove and reduce moisture content
from materials.
(Location: UTP, 17-02-06)
24
8 Granulator To grind raw materials into smaller pieces, but not in powder form.
(Location: UTP, 17-00-04)
9 Sieve To sieve powdered form materials into
desired groups of particle sizes. Used sieve sizes are 1.18 mm, 600 μm, 425 μm, 300 μm, and 212 μm.
(Location: UTP, 13-00-06)
10 Mass balance To weigh powdered form materials
precisely to make accurate combination of materials for analysis and briquetting.
(Location: UTP, 17-02-08)
11 Mortar grinder To grind small pieces of raw materials into fine and powdered.
(Location: UTP, 17-02-08)
25
12 Bomb calorimeter To find calorific value or actual high heating value (HHV) of samples.
(Location: UTP, 4-02-04)
13 Analytical mill grinder To grind materials and sieve or filter automatically to desired particle size.
(Location: UTP, 13-00-06)
There are softwares that have been used in this study. They are listed in Table 3.5 as follows:
Table 3.5: Software and their purpose
NO Software Purpose
1 Microsoft Word 2010 For documentation of project
2 Microsoft Excel 2010 For result tabulation and graph plotting
3 Prism 6 Trial For graph plotting
26
CHAPTER 4: RESULTS AND DISCUSSION
Proximate Analysis 4.1.
Table 4.1: Proximate analysis data (dry basis) Components
(wt %)
PS+PF+
SC
PS+PF+
EFB
PS+PF+
SD
PS+PF+
PFr PS+PF Volatile
Matter 72.04 70.17 71.38 69.10 68.34 Fixed
Carbon 23.28 23.97 23.39 25.04 23.42 Ash Content 4.68 5.86 5.23 5.86 8.24
Table 4.1 shown above is a dry basis weight percent. From data obtained in proximate analysis, combination of palm shell and palm fibre with palm frond as binder gave the highest amount of fixed carbon content (25.04 %) compared with other combinations. Second highest fixed carbon here is the sample with EFB as binder, having value of 23.97 %, followed by sample reference which has only palm shell and palm fibre without any binder, having value of 23.42 % , then sample with sawdust as binder, having value of 23.39 %, then and lastly by sample with sugarcane as binder which has value of 23.28 % of fixed carbon.
In view of ash content, sample with sugar cane showed the lowest which is 4.68 % and sawdust as binder showed 5.23 %, followed by samples with palm frond and EFB as binders, both having value of 5.86 %. The reference value shown by sample of palm shell and palm fibre only is 8.24 %. Thus, samples with sugarcane as binder gave the least amount of ash content, even lower than the reference value. This low content of ash is very important in boiler operation as high amount of ash will affect the boiler efficiency as ash stick to boiler tube surface. However, the values of ash content shown from samples with binders from EFB, palm frond and sawdust are not
27
too high compared to 4.68 %. These three samples are also acceptable in terms of ash content.
From correlation given by Parikh et al., value of HHV can be estimated from data obtained in proximate analysis. The value is shown in Figure 4.1 as follows:
Figure 4.1: HHV correlation from proximate analysis
From this Figure 4.1, it can be seen that sample with palm frond as binder has highest value for HHV, which is 19.58 kJ/g and other samples with binders of sugar cane, EFB and sawdust, have lower values which are 19.43 kJ/g, 19.37 kJ/g and 19.36 kJ/g respectively. Reference HHV value of sample having no binder is 18.87 kJ/g.
19.43 19.36 19.37 19.58
18.87
10 11 12 13 14 15 16 17 18 19 20
PS+PF+SC PS+PF+SD PS+PF+EFB PS+PF+PFR PS+PF
Higher Heating Value (HHV), kJ/g
Raw Materials
HHV Correlation from Proximate
Analysis
28
From TGA data also, burning profile could be drawn, which could represent the burning rate of actual briquettes. For all burning profiles of these samples, there were three regions that could be observed, which were moisture release, rapid burning and slow burning region. Between these three regions, there would be two temperatures that separate the three regions.
In the first region, the moisture release could be recognized with the first fluctuating graph or line. Within this region, volatile matters were released and partial ignition occurred. As for these, the rate of change in mass was slightly high.
In the second region, the rapid burning could be recognized easily as there would be peak or peaks that were the highest during the burning. This region started after the first region or moisture release and rapidly losing mass toward the maximum mass loss rate and after that, quickly slowed down. This rapid mass loss rate was due to the combination of the release and then ignition of volatile matter. As reported in previous work, the oily components of palm shell and palm fibre within the sample could lead to the increase of burning rate [8].
The third region, the slow burning could be recognized after the maximum mass loss rate and relatively showed stable or moving towards zero mass loss rate. In this region, there would be coverage of ash over the surface of samples and this made oxygen harder to diffuse in through the ash layer. This resulted in the remaining combustible sections difficult to be burned.
Thus, there are 5 figures (Figure 4.2, Figure 4.3, Figure 4.4, Figure 4.5 and Figure 4.6) obtained from proximate analysis to show the burning profile for each type of samples burnt. These figures will show the three regions discussed earlier which are moisture release, rapid burning and slow burning.
29
Figure 4.2: PS+PF+SC burning profile
As in Figure 4.2, this sample of palm shell, palm fibre and sugarcane as binder, had three regions separated at around 120 °C and 434 °C. Maximum mass loss rate was found to be at 10 mg/min at 382 °C and then quickly slowed down to about 2.27 mg/min at 434 °C. As in proximate analysis, this sample has 72.04 % of volatile matter in dry basis, which was high enough to explain the rapid burning region (release and then ignition of volatile matter).
This sample was analysed in proximate analysis using Procedure A, mentioned in Appendix A.
30
Figure 4.3: PS+PF+SD burning profile
As in Figure 4.3, this sample of palm shell, palm fibre and sawdust as binder, had three regions separated at around 127 °C and 432 °C. Maximum mass loss rate was found to be at 58 mg/min around 330 °C and then quickly slowed down to about 10.7 mg/min at 432 °C. Towards the end, at around temperature 849 °C, the mass loss rate was found to be only 0.07 mg/min. As in proximate analysis, this sample has 71.38
% of volatile matter in dry basis, which was high enough to explain the rapid burning region (release and then ignition of volatile matter).
This sample was analysed in proximate analysis using Procedure B, mentioned in Appendix A.
31
Figure 4.4: PS+PF+EFB burning profile
As in Figure 4.4, this sample of palm shell, palm fibre and EFB as binder, had three regions separated at around 110 °C and 415 °C. Maximum mass loss rate was found to be at 60.35 mg/min around 327 °C and then quickly slowed down to about 11.85 mg/min at 415 °C. Towards the end, at around temperature 847 °C, the mass loss rate was found to be only 0.02 mg/min. As in proximate analysis, this sample has 70.17
% of volatile matter in dry basis, which was high enough to explain the rapid burning region (release and then ignition of volatile matter).
This sample was analysed in proximate analysis using Procedure B, mentioned in Appendix A.
32
Figure 4.5: PS+PF+PFr burning profile
As in Figure 4.5, this sample of palm shell, palm fibre and palm frond as binder, had three regions separated at around 115 °C and 446 °C. Maximum mass loss rate was found to be at 52.7 mg/min around 390 °C and then quickly slowed down to about 6.81 mg/min at 446°C. Towards the end, at around temperature 847 °C, the mass loss rate was found to be only 0.03 mg/min. As in proximate analysis, this sample has 69.10% of volatile matter in dry basis, which was high enough to explain the rapid burning region (release and then ignition of volatile matter).
This sample was analysed in proximate analysis using Procedure B, mentioned in Appendix A.
33
Figure 4.6: PS+PF burning profile
As in Figure 4.6, this reference sample of palm shell and palm fibre, had three regions separated at around 110 °C and 435 °C. Maximum mass loss rate was found to be at 9.45 mg/min around 323 °C and then quickly slowed down to about 2.04 mg/min at 435°C. Towards the end, at around temperature 817 °C, the mass loss rate was found to be only 0.565 mg/min. As in proximate analysis, this sample has 68.34
% of volatile matter in dry basis, which was high enough to explain the rapid burning region (release and then ignition of volatile matter).
This sample was analysed in proximate analysis using Procedure A, mentioned in Appendix A.
34 Ultimate Analysis
4.2.
Table 4.2: Ultimate analysis data Components
(wt %)
PS+PF + SC
PS+PF + EFB
PS+PF +SD
PS+PF+
PFr
PS+PF Carbon 46.47 46.33 46.27 46.27 45.99 Hydrogen 6.43 4.72 5.40 5.27 5.52
Nitrogen 0.80 0.79 0.78 0.80 0.80 Sulfur 0.32 0.23 0.26 0.24 0.27
Figure 4.7: Percentage of carbon content of different samples
From data shown in Table 4.2 and Figure 4.7, it can be seen that the carbon content for all samples are relatively the same, around 46 %. According to this data, sample with sugarcane as binder has the highest carbon content, which is 46.47%, followed by sample with EFB, sawdust and palm frond as binders, with carbon content of 46.33%, 46.27% and 46.27% respectively. The reference sample which has no binder is found to have 46.06 % of carbon content.
46.47
46.33
46.27 46.27
46.06
45.80 45.90 46.00 46.10 46.20 46.30 46.40 46.50 46.60
PS+PF + SC
PS+PF + EFB
PS+PF +SD
PS+PF+
PFr
PS+PF
Percent, (%)
Samples
Percentage of Carbon Content
Carbon Content
35
From this ultimate analysis, sample with sugar cane has the highest potential for char burning, followed by the decreasing amount of carbon content; EFB, sawdust and palm frond.
Calorific Value Determination 4.3.
Figure 4.8: Experimental HHV obtained from bomb calorimeter
Calorific value has been obtained from bomb calorimeter. All values obtained were taken from three repetitions. From these three repetitions, average values obtained were expected to be more reliable and accurate. Based on Figure 4.8, the highest value of HHV is shown by sample of palm shell and palm fibre with sawdust as binder, in which the value is 18.79 kJ/g, followed by sample with binder of EFB, sugarcane and palm frond, in which the values are 18.73 kJ/g, 18.71 kJ/g and 18.55
18.71 18.73 18.79
18.55 18.56
16.26
15 15.5 16 16.5 17 17.5 18 18.5 19
PS+PF+SC PS+PF+EFB PS+PF+SD PS+PF+PFr PS+PF Lignite*
HHV, kJ/g
Samples
HHV
experimentfor Different Materials Mixture
Experimental HHV
36
kJ/g respectively. Reference value from sample of palm shell and palm fibre was obtained to be 18.56 kJ/g. All these values are much higher than the calorific value for lignite, a low rank coal which has value of 16.26 kJ/g [13].
4.3.1. Experimental vs Correlation HHV
Figure 4.9: HHV correlation vs HHV experimental
Based on Figure 4.9, a bar chart has been constructed to compare values of HHV obtained in bomb calorimeter and correlation values from TGA data. From this bar chart, samples with sugar cane, EFB, sawdust as binders have data that matched between HHV correlation and HHV experiment. Sample with sugarcane as binder has 19.43 kJ/g of HHV correlation and 18.71 kJ/g of HHV experiment, while sample of EFB as binder has 19.37 kJ/g of HHV correlation and18.73 kJ/g of HHV
19.43 19.37
19.36 19.58
18.87
18.71 18.73 18.79
18.55 18.56
12 13 14 15 16 17 18 19 20 21
PS+PF+SC PS+PF+EFB PS+PF+SD PS+PF+PFr PS+PF
HHV, kJ/g
Samples
HHV
correlationvs HHV
experimentHHV correlation
HHV experiment
37
experiment and sample with sawdust as binder has 19.36 kJ/g of HHV correlation and 18.79 kJ/g of HHV experiment. These three samples have HHV experiment values which are within the 3.74% absolute error. Reference sample, the palm shell and palm fibre only, has data within the 3.74% error also, in which the HHV correlation is 18.87 kJ/g and HHV experiment is 18.56 kJ/g. Other data of palm shell and palm fibre with binder of palm frond was not within the 3.74 % absolute error.
38 Combustion Test
4.4.
Prior to combustion test, there was a chemical equation involved. Using 40 % excess air, the chemical equation is shown as follow in equation 2.
( ) (2)
From equation 2, air-fuel ratio can be calculated and equals to 19.39 kg air per kg fuel. Further details can be referred in Appendix D in section Appendices.
Combustion test was done and Table 4.3 shows the data obtained on total energy recorded and the average rate of energy released. Based on the data obtained, it can be seen that the average rate of energy released increases as the surface area of reaction increases (from full disk shape, to 8 mm inner diameter and 15 mm inner diameter doughnut shape briquettes).
Table 4.3: Data on total energy and average rate of energy released Briquettes
Particle size
Compression force (kN)
Shape of Briquette
Total Energy (kJ)
Average Rate of Energy Released (kW)
Big 100 Full 890.37 0.39
Big 100 8mm 960.81 0.40
Big 100 15mm 919.79 0.46
Big 200 Full 774.59 0.22
Big 200 8mm 613.18 0.25
Big 200 15mm 1052.38 0.59
Small 100 Full 1058.81 0.39
Small 100 8mm 965.74 0.62
Small 100 15mm 1008.39 0.56
Small 200 Full 382.60 0.09
Small 200 8mm 731.73 0.33
Small 200 15mm 915.27 0.39
39
Figure 4.10: Rate of energy and total energy released by big particle and 100 kN compression briquettes
From Figure 4.10, it can be seen that as shape of briquettes is changed from full disk to 8 mm and 15 mm inner diameter doughnut shape, the rate of energy released increases. From full disk shape having 0.39 kW, to 0.4 kW from 8 mm inner diameter doughnut shape and 0.46 kW inner diameter doughnut shape. This result agreed with the theory that by increasing the surface area of reaction (from full disk to 15 mm inner diameter doughnut shape) the rate of energy released [11].
0.39
0.4
0.46
840 860 880 900 920 940 960 980
0.34 0.36 0.38 0.4 0.42 0.44 0.46 0.48
Full 8mm 15mm
100 100 100
Big Big Big
Total Energy Released (kJ)
Rate of Energy Released (kW)
Briquettes Design
Rate of Energy and Total Energy Released vs Briquettes Design
Average Rate of Energy Released (kW) Total Energy (kJ)
40
Figure 4.11: Rate of energy and total energy released by big particle and 200 kN compression briquettes
From Figure 4.11, it can be seen that as shape of briquettes is changed from full disk to 8 mm and 15 mm inner diameter doughnut shape, the rate of energy released increases. From full disk shape having 0.22 kW, to 0.25 kW from 8 mm inner diameter doughnut shape and 0.59 kW inner diameter doughnut shape. This result agreed with the theory that by increasing the surface area of reaction (from full disk to 15 mm inner diameter doughnut shape) the rate of energy released.
0.22
0.25
0.59
0 200 400 600 800 1000 1200
0 0.1 0.2 0.3 0.4 0.5 0.6 0.7
Full 8mm 15mm
200 200 200
Big Big Big
Total Energy Released (kJ)
Rate of Energy Released (kW)
Briquettes Design
Rate of Energy and Total Energy Released vs Briquettes Design
Average Rate of Energy Released (kW) Total Energy (kJ)
41
Figure 4.12: Rate of energy and total energy released by small particle and 100 kN compression briquettes
From Figure 4.12, it can be seen that as shape of briquettes is changed from full disk to 15 mm inner diameter doughnut shape, the rate of energy released increases. From full disk shape having 0.39 kW, to 0.62 kW from 8 mm inner diameter doughnut shape and 0.56 kW inner diameter doughnut shape. This result agreed with the theory that by increasing the surface area of reaction (from full disk to 15 mm inner diameter doughnut shape) the rate of energy released. However, it seems that the value of rate of energy released in 15 mm inner diameter briquette is lower than the 8 mm inner diameter briquette. It could be error in the experiment done that led this way. Nonetheless, both are higher than full disk shape briquette and this is expected as the surface area of reaction increases.
0.39
0.62
0.56
900 920 940 960 980 1000 1020 1040 1060 1080
0 0.1 0.2 0.3 0.4 0.5 0.6 0.7
Full 8mm 15mm
100 100 100
Small Small Small
Total Energy Released (kJ)
Rate of Energy Released (kW)
Briquettes Design
Rate of Energy and Total Energy Released vs Briquettes Design
Average Rate of Energy Released (kW) Total Energy (kJ)
42
Figure 4.13: Rate of energy and total energy released by small particle and 200 kN compression briquettes
From Figure 4.13, it can be seen that as shape of briquettes is changed from full disk to 8 mm and 15 mm inner diameter doughnut shape, the rate of energy released increases. From full disk shape having 0.09 kW, to 0.33 kW from 8 mm inner diameter doughnut shape and 039 kW inner diameter doughnut shape. This result agreed with the theory that by increasing the surface area of reaction (from full disk to 15 mm inner diameter doughnut shape) the rate of energy released.
0.09
0.33
0.39
0 100 200 300 400 500 600 700 800 900 1000
0 0.05 0.1 0.15 0.2 0.25 0.3 0.35 0.4 0.45
Full 8mm 15mm
200 200 200
Small Small Small
Total Energy Released (kJ)
Rate of Energy Released (kW)
Briquettes Design
Rate of Energy and Total Energy Released vs Briquettes Design
Average Rate of Energy Released (kW)
Total Energy (kJ)
43
Figure 4.14: Average rate of energy released from different compression force for big particle briquettes
From Figure 4.14, there is a pattern shown from the data which shows that the increase in compression force will decrease the average rate of energy released. This is based on big particles briquettes. For a full disk shape briquette, a compression force of 100 kN has value of 0.39 kW while a compression force of 200 kN has 0.22 kW, and the same for 8 mm inner diameter doughnut shape for 100 kN having value of 0.4 kW and for 200 kN compression force having value of 0.25 kN. However, data obtained in 15 mm inner diameter doughnut shape briquettes were not as expected.
100 kN compression force shows value of 0.46 kW while 200 kN compression force has value 0.59 kW. There could be error during the experiment that led to this different pattern compared with the previous shapes of briquettes (full disk shape and 8 mm inner diameter shape briquettes).
0.39
0.22
0.4
0.25
0.46
0.59
0 0.1 0.2 0.3 0.4 0.5 0.6 0.7
Full Full 8mm 8mm 15mm 15mm
100 kN 200 kN 100 kN 200 kN 100 kN 200 kN
Rate of Energy Released (kW)
Briquettes
Effects of Compression Force to Rate of Energy Released for Small Particle
Briquettes
Big Particle
44
Figure 4.15: Average rate of energy released from different compression force for small particle briquettes
From Figure 4.15, there is a pattern shown from the data which shows that the increase in compression force will decrease the average rate of energy released. This is based on small particles briquettes. For a full disk shape briquette, a compression force of 100 kN has value of 0.39 kW while a compression force of 200 kN has 0.09 kW, and the same for 8 mm inner diameter doughnut shape for 100 kN having value of 0.62 kW and for 200 kN compression force having value of 0.33 kN. For the 15 mm inner diameter doughnut shape briquettes also, the average rate of energy released decreases as compression force increases, in which for 100 kN compression force, the value is 0.56 kW while for 200 kN compression force the value is 0.39 kW.
0.39
0.09
0.62
0.33
0.56
0.39
0 0.1 0.2 0.3 0.4 0.5 0.6 0.7
Full Full 8mm 8mm 15mm 15mm
100 kN 200 kN 100 kN 200 kN 100 kN 200 kN
Rate of Energy Released (kW)
Briquettes
Effects of Compression Force to Rate of Energy Released for Small Particle
Briquettes
Small Particle
45
Figure 4.16: Effects of particle size to average rate of energy released
Figure 4.16 shows the effects of particle size to average rate of energy released. For full disk shape briquettes compressed at 100 kN, both big particle and small particle briquettes show same value at 0.39 kW. Full disk shape briquettes compressed at 200 kN, show that big particle briquettes has higher average rate of energy released (0.22 kW) compared to small particle briquettes (0.09 kW). For 8 mm inner diameter doughnut shape briquette compressed at 100 kN, big particle briquettes has value of 0.4 kW and small particle briquettes has value of 0.62 kW. For 8 mm inner diameter doughnut shape briquettes compressed at 200 kN, big particle briquettes has value of 0.25 kW and small particle briquettes has 0.33 kW. For 15 mm inner diameter doughnut shape briquettes compressed at 100 kN, big particle briquettes has value of 0.46 kW and small particle briquettes has 0.56 kW. For 15 mm inner diameter
0.39
0.22
0.4
0.25
0.46
0.59
0.39
0.09
0.62
0.33
0.56
0.39
0 0.1 0.2 0.3 0.4 0.5 0.6 0.7
Full Full 8mm 8mm 15mm 15mm
100 kN 200 kN 100 kN 200 kN 100 kN 200 kN
Rate of Energy Released (kW)
Briquettes
Effects of Particle Size to Rate of Energy Released
Big Particle
Small Particle
46
doughnut shape briquettes compressed at 200 kN, big particle briquettes has value of 0.59 kW and small particle briquettes has 0.39 kW.
Two sets of briquettes which are full disk shape briquettes compressed at 200 kN and 15 mm inner diameter doughnut shape briquettes compressed at 200 kN show data that agree with the previous study stating that big particle briquettes will burn at higher burning rate compared to smaller particle size. Other data do not match well with this. This could be due to experiment conducted only once for each type of briquette design, thus error could present and lead to these kind of data.
In small particle briquettes, porosity of the briquettes will be low. Low porosity will affect combustion rate as the mass transfer will be affected. Low porosity means low mass transfer during drying, devolatisation and also char burning process, thus slow rate of combustion. In contrary, big particle briquettes allow higher porosity, thus better mass transfer and directly increase rate of burning.
![Figure 2.1: Example of TGA graph [15].](https://thumb-ap.123doks.com/thumbv2/azpdforg/11059496.0/20.893.248.710.600.885/figure-2-1-example-of-tga-graph-15.webp)