This study project will show how appropriate leadership styles contribute to beneficial performance changes in the food and beverage business. The main purpose of this study is to understand how different leadership styles affect employee performance in the Malaysian food and beverage industry.
RESEARCH OVERVIEW
- Introduction
- Research Background
- Problem Statement
- Research Objectives
- General Objectives
- Specific Objectives
- Research Questions
- Hypothesis of the Study
- Significance of the Study
- Chapter layout
- Chapter summary
However, there is a lack of studies on the impact of leadership style on employee performance in the food and beverage industry. To examine the effect of leadership styles on employee performance in the food and beverage industry in Malaysia.
LITERATURE REVIEW
- Introduction
- Underlying theories
- Leadership theory
- Path-Goal Theory
- Review of Literature
- Leadership
- Dependent variable - Employee Performance
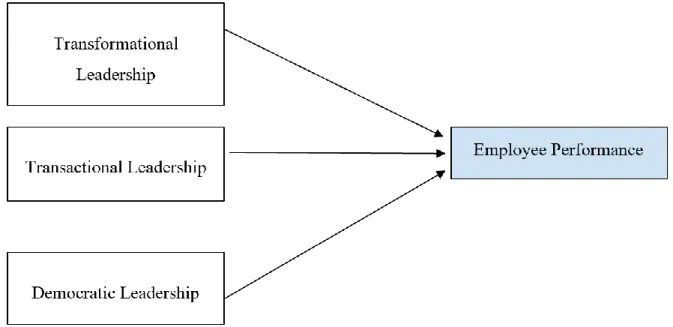
- Proposed Theoretical/ Conceptual framework
- Hypothesis Development
- The effect of Transformational Leadership on employee performance
- The effect of Transactional Leadership on employee performance
- The effect of Democratic Leadership on employee performance
- Chapter summary
The hypothesis is to test the effect of leadership (transformational leadership, transactional leadership and democratic leadership) on employee performance in the F&B industry. Currently, we are undertaking the final year project (Research Project UBMZ3016) which is titled "The Effect of Leadership Styles on Employee Performance in the Food and Beverage Industry".

RESEARCH METHOLOGY
Introduction
The aim of the research methodology is to justify and explain how to interpret the data in a more effective way. In addition, the research instrument, construct measurement, data processing and data analysis will be discussed below.
Research Design
The research process is explained in Chapter 3 to help determine the results of the research and make it more understandable. After reviewing relevant literature and journal articles, we hypothesized that different leadership styles would influence employee performance.
Data Collection Methods
- Primary Data
- Secondary Data
Before it is used by third-party users, this data is primary data, and once it is used by third-party users, it becomes secondary data. Secondary data collection time is short and can be obtained from websites, publications, books and journal articles (Johnston, 2017).
Sampling Design
- Target Population
- Sampling Frame and Sampling Location
- Sampling elements
- Sampling Technique
- Sampling Size
The respondents to the questionnaire will be those working in the F&B industry in Malaysia. The sample comes from popular social media to collect the sample data so that leaders in the F&B industry can conveniently and easily participate in this research.
Research Instrument
- Questionnaire design
- Origins of Construct (Questionnaire)
- Pilot study
- Reliability Test
After we received all the returned questionnaires, we entered all the respondents' data using the Social Sciences (SPSS) Statistics to test the reliability of the results. The reliability of the data received from the questionnaire respondent can be examined using a reliability test.
Construct Measurement
- Nominal Scale
- Ordinal Scale
- Interval Scale
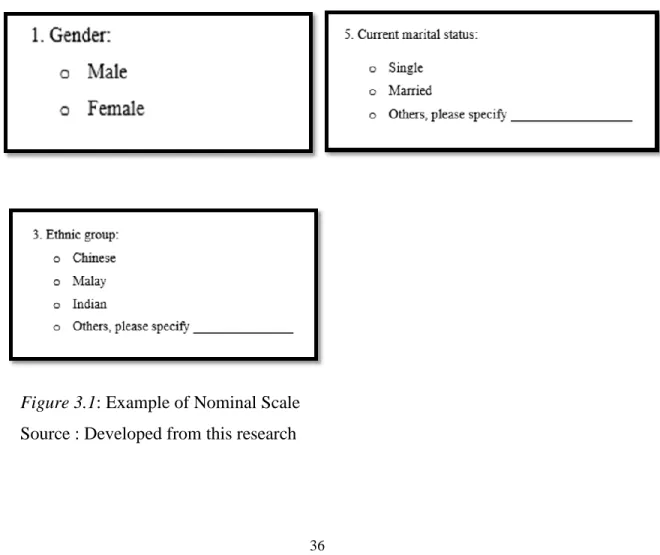
Only nominal, ordinal and interval scales were used to assess the variables in our study. A nominal scale acts as a qualitative measurement used to categorize events or things into different groups. For example, in our questionnaire in section A, there are 3 nominal scale questions, namely question 1 (gender), question 3 (ethnic group) and question 5 (marital status).
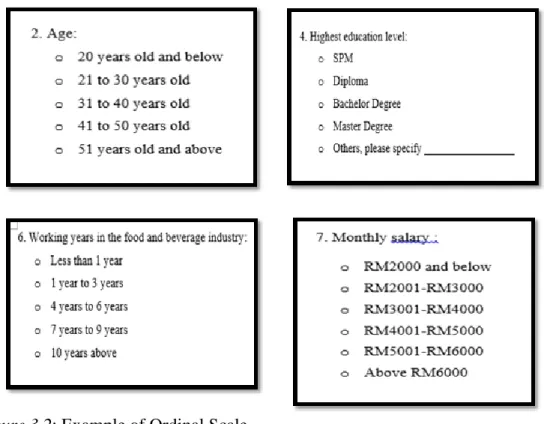
It shows the rank or sequence of such variables depending on the notion, but it is not the value of the intervals within them (Salkind, 2010). For example, there are 4 ordinal scale questions in our questionnaire in Section A, which are Question 2 (Age), Question 4 (Highest Education), Question 6 (Years of Work) and Question 6 (Monthly Salary). An interval scale refers to a quantitative measurement scale that uses the range between observations to detect changes in quantity.
An interval scale has both a nominal and an ordinal scale, but only stores data on changes in quantities of a single concept.
Data Processing
- Data Checking
- Data Editing
- Data Coding
- Data Transcribing
Data coding is the process of translating the answer obtained by assigning numerical values from alphabets so that the answer can be easily categorized into respective groups for the label (Allen, 2017). Using Statistical Product and Service Solutions (SPSS) software, the answers for each question in each Section in the questionnaires were coded as follows. Data transcription is a process in which the researchers enter the data obtained into a software or machine by typing the data (Moore & Llompart, 2017).
In our research, we have transcribed the data after checking, editing and coding the data using SPSS software for future analysis.
Data Analysis
- Descriptive Analysis
- Inferential Analysis
- Multiple Regression Analysis
Descriptive analysis objectively describes the nature and extent of sensory features (Kemp et al., 2017). This analysis will provide how the data is distributed, help in detecting outliers and typos, it can distinguish the relationships between the variables (Navneet, 2015). The researchers will categorize the respondents in a table, including gender, age, ethnic group, highest level of education, current marital status, years of work and their salary using percentage calculation. In this section, the researchers will make generalizations from the population and conduct a sample test using the population information.
The researchers can take the statistics from sample data and use them to present the population parameter. Then, based on the findings, we can decide whether or not it is necessary to reject the null hypothesis. In this study, we will use the Multiple Regression to analyze the significant effect of transformational, transactional and democratic leadership styles (independent variables) on employee job performance (dependent variable).
It is used as a statistical tool to describe how different independent and dependent variables relate to each other.
Conclusion
RESEARCH RESULTS
Introduction
Descriptive Analysis
- Respondent Demographic Profile
- Gender
- Age
- Ethnic Group
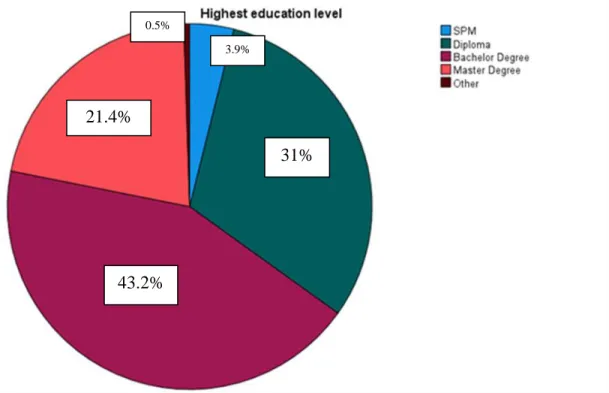
- Highest Education Level
- Current Marital Status
- Number of working years in the food and beverage industry
- Monthly salary
- Central Tendencies Measurement of Constructs
- Transactional Leadership
- Democratic Leadership
- Employee Job Performance
The result shows that respondents aged 21 to 30 had the highest rate at 40.6% and respondents aged 21 and under had the lowest rate at 2.3%. As Table 4.3 and Graph 4.3 show, the group ethics analysis consists of 3 categories. About 166 respondents with 43.2% were of undergraduate level, followed by diploma level consisting of 119 respondents with 31.0%, master's level consisting of 82 respondents with 21.4%, SPM level consisting of 15 respondents with 3.9 % and about 2 respondents with 0.5% were of other education levels.
It indicates that the bachelor level of education has the highest percentage and only 2 respondents have completed another level of education. The married status category consists of 197 respondents at 51.3% and the single marital status category consists of 187 respondents at 48.7%. Subsequently, 76 respondents with 19.8% have worked in the food and beverage industry for less than 1 year.
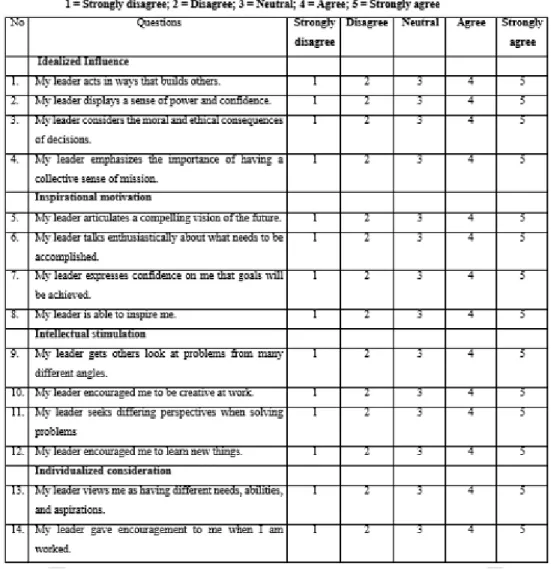
Based on Table 4.8, TFL1 achieves the highest central tendency and is ranked number 1 with an average of 3.8516.
Scale Measurement
- Reliability
Thus, items used to measure TFL have been proven to have good internal consistency and reliability. Therefore, the items used to measure all of these items were found to have good internal consistency and reliability.
Inferential Analyses
- Multiple Linear Regression
Therefore, these three leadership styles have a significant effect on employee performance in the F&B industry. Based on the results of Table 4.15, the researchers proved that transformational leadership style (independent variable) has a significant effect on the employee's performance (dependent variable). Since the p-value for transformational leadership style is below 0.001, it is less than the alpha value (0.05).
Based on the results of Table 4.15, the researchers proved that transactional leadership style (independent variable) has a significant effect on the employee's performance (dependent variable). Based on the results of Table 4.15, the researchers proved that democratic leadership style (independent variable) has a significant effect on the employee's performance (dependent variable). Since the p-value for democratic leadership style is below 0.001, it is less than the alpha value (0.05).
With a standardized coefficient of Beta value of 0.445, transformational leadership style involves the most effect of employee's performance, because its coefficient of Beta value is the highest among three leadership styles.
Conclusion
RESEARCH CONCLUSIONS
Introduction
Summary of Statistical Analysis
- Summary of Descriptive Analysis
- Summary of Central Tendencies Measurement of Constructs
- Summary of Inferential Analysis
- Summary of Reliability Test
- Summary of Multiple Regression Analysis
First, the transformational leadership style resulted in a very good level of reliability, with Cronbach's Alpha value of 0.974. The highest value is 0.909 for passive administration by exception, while the lowest value is 0.898 for active administration by exception. The democratic leadership style achieved 0.919 of Cronbach's Alpha value, which is in the very good reliability range.
Apart from that, the dependent variable employee performance also achieved a Cronbach's Alpha value of 0.951, which is within a very good reliability range. This is because the p-value for the three types of leadership styles is less than the alpha value (0.05). Next, the transformational leadership style involves the most effect on employee performance, because it has the highest standardized coefficient of Beta value, 0.445.
The lowest leadership style effect on employee performance is transactional leadership, the average standardized coefficient of the beta value of three dimensions of transactional leadership is -0.016.
Discussions of Major Findings
- The Effect of Transformational Leadership on Employee Performance
- The Effect of Transactional Leadership on Employee Performance
- The Effect of Democratic Leadership on Employee Performance
According to Kalsoom et al. 2018), transactional leadership style is influencing employee performance in a positive way. Based on the findings, the FMCG sector in Pakistan can benefit from this study by understanding that transactional leadership can improve employee performance. 2019) also support that transactional leadership style is positive and significant for employee performance. This group's research shows that democratic leadership on employee performance has a p-value below 0.001, which means it is lower than the alpha value of 0.05.
All team members are involved in the final decision-making and goal-setting processes under democratic leadership. People are often involved in initiatives that increase productivity, happiness at work and performance because this leadership encourages creativity, innovation and collaboration. Democratic leaders invite and encourage team members to actively participate in choosing the final course of action.
The results of this study suggest that democratic leadership will improve employee performance (Basit et al., 2018).
Implications of the Study
- Managerial Implications
19 pandemic is the need to reconstruct and restructure the supply chain network (Chowdhury et al., 2020). Effective leadership extends beyond the hospitality industry and is the cornerstone of the most successful businesses. The researchers noted that an effective leadership style encourages employees to give their best effort, ensuring projects are completed in a timely manner, including food and drink.
Limitations of the Study
Recommendation for Future Research
Conclusion
The impact of malah transactional leadership styles on employee performance; the Malaysian pharmacy industry perspective. Transactional leadership style and employee performance in food and beverage manufacturing enterprises of OSUN state. Influence of transactional leadership style on employee performance at selected commercial banks in Nairobi City County.
The effect of leadership style on employee performance in the case of Ministry of Education and Higher Studies of Somaliland. The Impact of Transactional Leadership and Transformational Leadership on Employee Performance: A Case of Pakistan's FMCG Industry. The Impact of Leadership Styles on Employee Performance in Selected Nigerian Organizations: A Study of Naze Industrial Clusters, Owerri.
The influence of transformational leadership and work motivation on employee performance, mediated by job satisfaction. Job satisfaction as a mediator of transformational leadership style on employee performance in the food and beverage industry in Malang city. Our final year project aims to investigate the effect of leadership styles on employee performance in the food and beverage industry in Malaysia.