Universiti Malaysia Kelantan Library has the right to make copies for research purposes only. Finally, we appreciate Universiti Malaysia Kelantan (UMK) for allowing us to study here.
INTRODUCTION
- Introduction
- Background of The Study
- Problem Statement
- Research Question
- Research Objective
- Scope of The Study
- Significance of The Study
- Definition of Term
- Satisfaction
- Quality
- Organization of Proposal
The main purpose of the study was to assess the characteristics that have an impact on customer satisfaction levels with the public transport sector among bus consumers in Malaysia, namely in the states of Kuala Lumpur, Kelantan and Terengganu. Furthermore, the purpose of the research is to focus on a particular area which is factor affecting customer satisfaction in public transport in Malaysia, especially in Kuala Lumpur, Kelantan, Terengganu.
LITERATURE REVIEW
- Introduction
- Underpinning Theory
- Previous Study
- Relationship between the reliability and public transport towards customer’s
- Relationship between the tangibility and public transport towards customer’s
- Relationship between the responsiveness and public transport towards
- Relationship between the assurance and public transport towards customer’s
- Relationship between the empathy and public transport towards customer’s
- Hypothesis Statement
- Theoretical Framework
- Summary
The travel time (Li et al., 2010), the frequency of the services provided (Phoebe, 2017), the punctuality of the services (Murambi and Bwisa, 2014), and also the provision of information regarding delayed services are all ways on which reliability can be determined (Friman, 2004). Finally, the analysis reports on the relationship between the dimensions of the SERVQUAL model and customer satisfaction.
RESEARCH METHODS
- Introduction
- Research Design
- Data Collection Methods
- Study Population
- Sample Size
- Sampling Technique
- Research Instrument Development
- Measurement of Variable Research Instruments
- Research Procedure
- Preliminary Data Analysis
- Procedure for Data Analysis
- Reliability Test
- Descriptive Statistics
- Normality Test
- Pearson Correlation
- Multiple Regression
- Summary
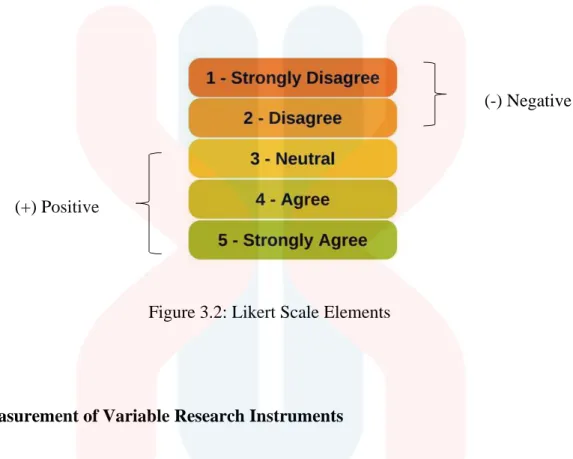
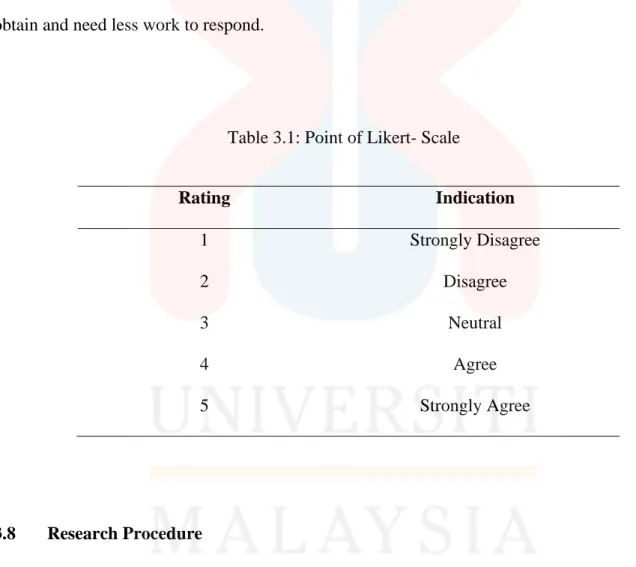
The orderly arrangement of the scale is based on the lowest to the highest level Borges (2017). The questionnaire will be given to respondents as part of the data collection process, and respondents will provide their answers to the questionnaire in person. Descriptive statistics, as the name suggests, give us a quick visual representation of the data we are working with.
There is not much influence that can be seen on the mean value from the outlying values of the data set. It is necessary to make the assumption of linearity and the structure of the model must be linear.

DATA ANALYSIS AND FINDINGS
Introduction
Preliminary analysis
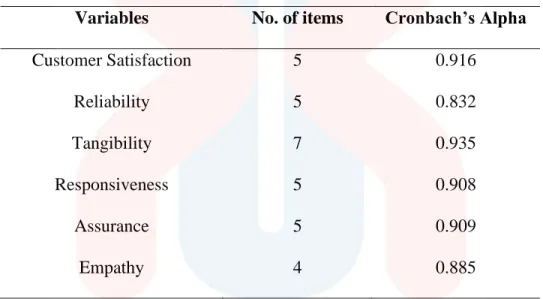
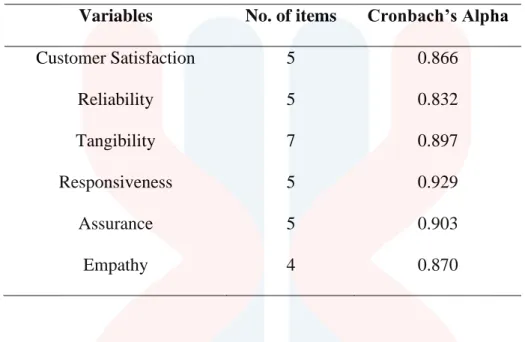
The table above shows that the overall reliability of the independent and dependent variables reached 0.9 and above Cronbach's Alpha. It can be concluded that Cronbach's Alpha for the overall reliability is accepted for this study because the reliability is higher than 0.8 and above. The reliability of the independent and dependent variables for the pilot test for the 30 collected questionnaires is shown in Table 4.2.
All the independents which are Customer Satisfaction, Reliability, Tangibility, Responsiveness, Security and Empathy show respectively good acceptable Cronbach's Alpha for this research. Because all variables scored 0.8 or more, this questionnaire can be trusted to be used in this study.
Validity and Reliability Test
Demographic Profile of Respondents
- Gender
- Age
- Race
- Marital Status
- Occupation
- State
- How often you use public bus transportation?
For race, Chinese ethnic with 36 respondents participating (9.4%), and Indian ethnic with 30 respondents participating (7.8%). The table also shows the number of respondents based on married status with 67 respondents, which is 17.4%. In contrast, there are 30 respondents who are self-employed (7.8%) and 248 respondents who are students (64.6%), making up the largest group of respondents.
Therefore, the result is that the highest number of respondents who use public bus transport is monthly.

Descriptive Analysis
- Overall Mean Score for Dependent Variable and Independent Variable
- Customer Satisfaction
- Reliability
- Tangibility
- Responsiveness
- Assurance
- Empathy
Meanwhile, the lowest average score is 3.91, which means that public transport bus services are provided in an efficient manner and I always give positive comments about bus services. Meanwhile, the lowest average score is 3.67, which means the bus never breaks down on the road. Meanwhile, the lowest average score is 3.85, which means the buses have plenty of legroom and legroom.
Meanwhile, the lowest average score is 3.82, which means that the bus staff always inform people about the availability of services and changes in prices in advance.
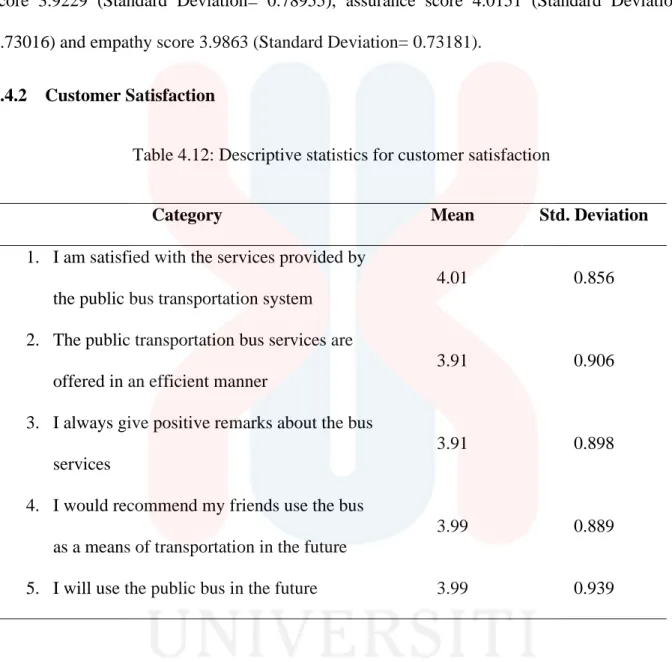
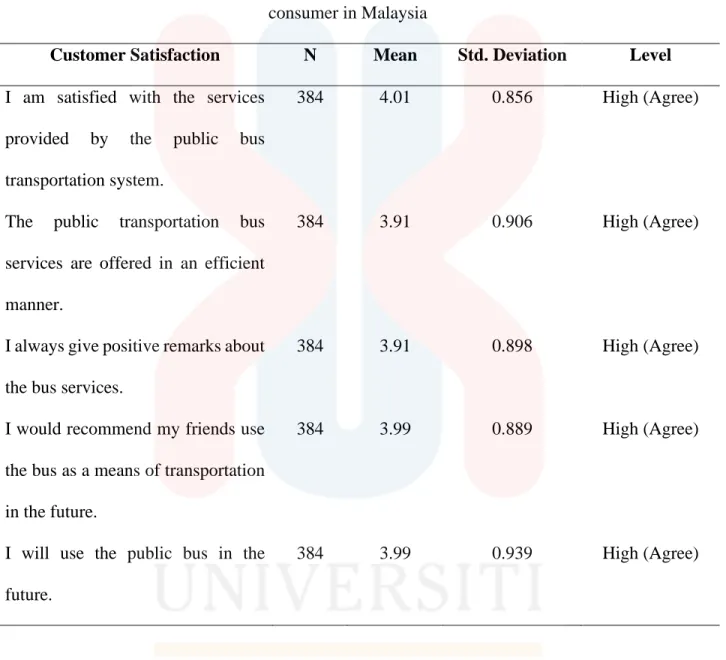
Descriptive statistic result for the level of customer satisfaction
For I am satisfied with the services provided by the public bus transport system, it has a mean = 4.01, Std. For public transport, bus services are provided in an efficient manner, it has a mean value = 3.91, Std. Next, because I always give positive comments about the bus services, it has a mean value = 3.91, Std.
Then, because I would recommend my friends to use the bus as a means of transport in the future, it has a mean value = 3.99, Std.
Normality Test
In conclusion, the values of Skewness and Kurtosis are shown as a reasonable normal distribution because all variables are in the range of -1.96 and +1.96.
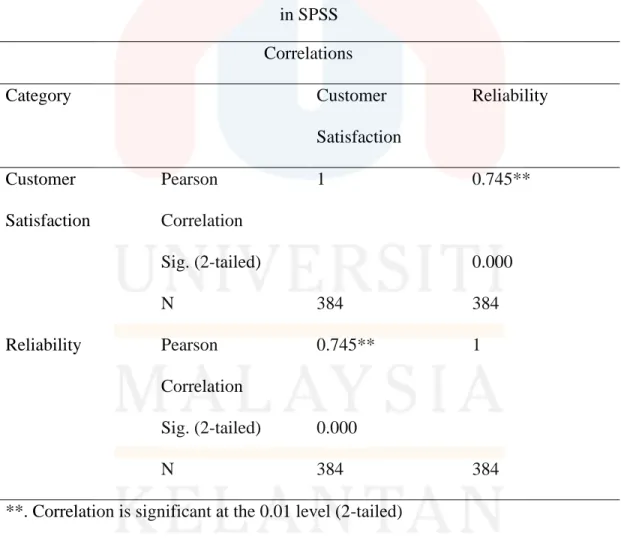
Hypothesis Testing
H0: There is no significant and negative relationship between the reliability and public transport in terms of customer satisfaction among the bus consumer in Malaysia. There is a strong relationship between the reliability and public transport in terms of customer satisfaction among the bus consumer in Malaysia. H0: There is no significant and negative relationship between the tangibility and public transport in terms of customer satisfaction among the bus consumer in Malaysia.
There is a strong relationship between the responsiveness and public transport in terms of customer satisfaction among the bus consumer in Malaysia. There is a strong relationship between the empathy and public transport customer satisfaction among the bus consumer in Malaysia.
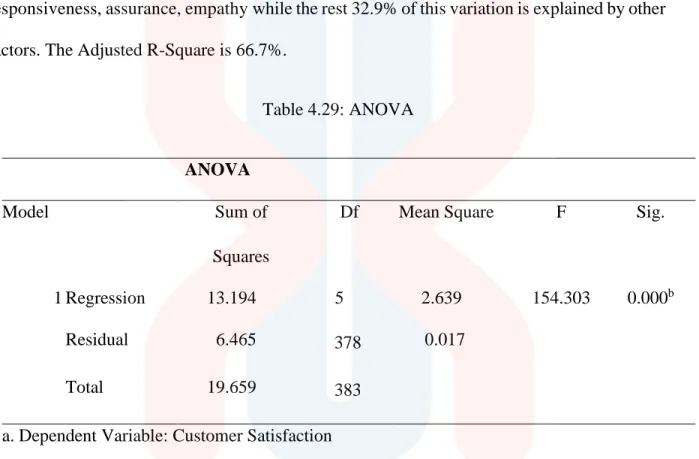
Multiple Linear Regression
The result of the significant value p-value is <0.01; this shows that there is a relationship between empathy and public transport customer satisfaction among the bus consumer in Malaysia. At least one of the five variables which are reliability, tangibility, responsiveness, safety, empathy can be used to model customer satisfaction among the bus consumer in Malaysia. Thus, safety was not significant in estimating customer satisfaction in the public transport sector among bus consumers in Malaysia.
The above model illustrates that empathy had the greatest impact on customer satisfaction among bus consumers in Malaysia because every unit increase in empathy would result in 0.296 units increase in customer satisfaction and at the same time, as the sensitivity remains constant. Then, the model also showed that reliability was the second largest influence on customer satisfaction among bus consumers in Malaysia.
Summary
This can be explained by if the unit increase in reliability will result in an increase of 0.273 units in the customer satisfaction as the reliability remains constant.
DISCUSSION AND CONCLUSION
Introduction
Key Findings
There is a significant and positive relationship between the tangibility and public transport towards customer satisfaction among the bus consumer in Malaysia. To identify the relationship between responsiveness and customer satisfaction in the public transport sector among bus consumers in Malaysia. There is a significant and positive relationship between responsiveness and public transport in relation to customer satisfaction among the bus consumer in Malaysia.
To identify the relationship between insurance and customer satisfaction in the public transport sector among bus consumers in Malaysia. There is a significant and positive relationship between insurance and public transport towards customer satisfaction among bus consumer in Malaysia.
Discussion
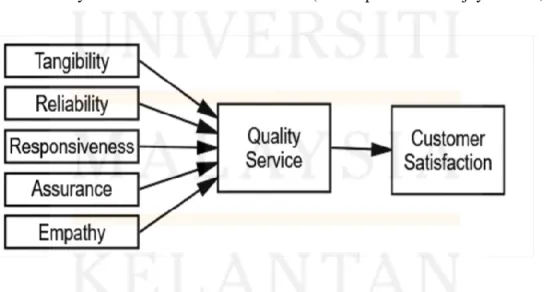
The other objective of this research is to identify the relationships between the SERVQUAL model which are reliability, tangibility, responsiveness, safety and sensitivity and customer satisfaction in the public transport sector among bus consumers in Malaysia. The next objective is to determine the most influencing factors on the SERVQUAL model and customer satisfaction in the public transport sector among bus consumers in Malaysia. The result from multiple regression analysis (refer to table 5.3) showed that all dimensions have positive effects on customer satisfaction.
Maintaining a clean record is the paradigm of reliability in terms of service quality, and it has a significant impact on customer satisfaction (Ennew et al., 2013). In a nutshell, the findings of this study show that there is a relationship SERVQUAL model (reliability, tangibility, responsiveness, assurance, empathy) and customer satisfaction on public transport sector among bus consumer in Malaysia.
Implications of Study
Therefore, based on the above argument, this leads to the development of the following hypothesis. For the responsiveness metric, it is possible to set service standards for customer complaints and inquiries. Service standards for monitoring the safety of bus drivers, service standards for training bus drivers and service standards for having the necessary license or authority can all be derived from the safety dimension and created accordingly.
The sensitivity factor also allows the formulation of standards for consumer inquiries and complaints. Service standards can be developed based on physical dimensions, including service standards for the condition of bus stops, cleaning, servicing, maintenance and repair of buses and bus condition standards.
Limitations of Study
Customers will have more confidence in a firm because of the performance of its employees, especially if those employees respect customers and consistently demonstrate an ability to answer critical issues raised by customers. The operator of the bus service is obliged to ensure that the consumer can feel safe while using their products and services. These respondents have increased expectations due to the availability of alternatives to satisfy their need for travel.
In addition, researchers have difficulty finding some of the information and data they need because some data are restricted to official use only. Many respondents showed reluctance to fill in the questionnaire that was presented to them.
Recommendation for Future Research
These are all things that should be considered to improve the public bus transport system. For example, one of the aspects of service quality that contributes to satisfied customers using Indonesia's public bus transport is the presence of safety measures. Customers are more likely to choose public bus transport as their mode of transport if the journey takes less time to complete.
In a nutshell, the results suggest that the quality of the service has an effect on the overall level of happiness that customers have while using public bus transport. The overarching goal is to make public bus travel an attractive, enjoyable and marketable means of transport.
Overall Conclusion of the Study
Most importantly, this study discovered that bus consumer are currently extremely satisfied with the bus public transport and its service quality in Malaysia. Passenger rail service quality”, International Journal of Quality and Reliability Management, Vol. 2010) 'The service quality analysis of public transport systems using PZB model – dynamic bus information system', The Institute of Electrical and Electronics Engineers. 2004), “Implementing quality improvements in public transportation”, Journal of Public Transportation, Vol. 2016) 'Service Quality on Behavioral Purchase In-tentions in the Public Land Transportations Service in Kuala Lum-pur, Malaysia', Universiti Tunku Abdul Rahman Friman, M. 2003), "A Content Analysis of Complaints and Compliments". A proposal of the structural equation model. 2005), “Quality and customer relationship management (CRM) as competitive strategy in the Swedish banking industry”, The TQM Magazine, Vol. 2007), “Summary of the Application Effect of Bus Rapid Transit at Beijing South Center Corridor of China”, Journal of Transportation Systems Engineering and Information Technology, Vol.
BACHELOR OF LOGISTICS AND DISTRIBUTION TRADE WITH A PARTICULAR FACTORS AFFECTING CUSTOMER SATISFACTION IN PUBLIC TRANSPORT. We are conducting a study entitled “FACTORS AFFECTING CUSTOMER SATISFACTION IN THE PUBLIC TRANSPORT SECTOR AMONG BUS CONSUMERS IN MALAYSIA”. The following question explores the factor influencing customer satisfaction in the public transport sector among bus users in Malaysia.
Research Topic: FACTORS AFFECTING CUSTOMER SATISFACTION ABOUT PUBLIC TRANSPORT SECTOR AMONG BUS CONSUMERS IN MALAYSIA.