Heavy Metal Loadings in Residential Yards in Tronoh, Perak.
by
Nik Mohd lrfan Nik Adnan
Dissertation submitted in partial fulfillment of the requirements for the
Bachelor of Engineering (Hons) (Chemical Engineering)
JUNE 2010
Universiti Teknologi PETRONAS Bandar Seri Iskandar
31750 Tronoh Perak Darul Ridzuan
CERTIFICATION OF APPROVAL
Heavy Metal Loadings in Residential Yards in Tronoh, Perak
Approved by,
(Dr Nurlidia Mansor)
by
Nik Mohd lrfan Nik Adnan
A project dissertation submitted to the Chemical Engineering Programme Universiti Teknologi PETRONAS in partial fulfillment of the requirement for the
Bachelor of Engineering (Hons) (Chemical Engineering)
UNIVERSITI TEKNOLOGI PETRONAS
CERTIFICATION OF ORIGINALITY
This is to certify that I am responsible for the work submitted in this project, that the original work is my own except as specified in the references and acknowledgements, and that the original work contained herein have not been undertaken or done by unspecified sources or persons.
NIK MOHO IRFAN NIK ADNAN
ABSTRACT
Heavy metals occur naturally in earth and they are essential to the human body in trace amount. In high doses, they exert the toxic effect and will be harmful to human health.
The excess concentration of heavy metals can eventually lead to poisoning and can be fatal. There are various sources of heavy metals and they can be transported to residential yards in many ways. One of them is through the atmosphere. Heavy metal will deposit eventually be into the soil and may accumulate. Soil pollution can sometimes enriched trace metal contents in airborne particles originate from soils and the polluted air will be inhaled by human. Most people do not realize that air contains lots of heavy metals due to human activities, vehicle emissions and other sources. These heavy metals can harm human being by entering human body via inhalation, ingestion and skin absorption. However, the level of awareness among the general public regarding soil pollution with heavy metal is still low. This report reflects the research done and also the basic understanding of the topic which is: Heavy Metal Loadings in Residential Yards in Tronob, Perak. The main objective of this research is to measure the concentration of Pb, Zn and Cd in residential estates within Tronoh and to compare the level of heavy metal in the residential estates with the rural area. The rural area with low volume of traffic and negligible industry that has been chosen for this project is Bota which is located next to Tronoh. In this study, three residential yards were chosen as the sampling locations. Two sampling locations are within Tronoh and one is in Bota.
For each sampling location, two random points been chosen and two samples from each point were taken at different depth; the top soil (0-8cm) and the bottom soil (9-16cm).
The samples were sent to the laboratory for the analysis using Atomic Absorption Spectroscopy (AAS). From the findings, heavy metal concentration is consider low and is still in acceptable range. The highest metal concentration is Pb in Taman Universiti with the concentration of 512.0 I mg/kg and the lowest is Cd in Bota with the concentration of 5.2 mglkg. Cd concentration is very low for all sampling locations since the locations are away from any industry activities.
ACKNOWLEDGEMENT
Firstly, I would like to praise Allah the Almighty, who has been helping and guiding me in completing my final year project. I would like to express my genuine gratitude to my mother, Nik Sabariah Nik Jaafar for her endless love, prayers and tolerance. To my beloved father, Nik Adnan Nik Daud, thank you for your persevering support and encouragement.
My utmost gratitude also goes to my supervisor, Dr Nurlidia Mansor who has been very supportive in providing the necessary guidance and assistance during my period of studies for this research. Thank you very much for the unending help throughout the course of my research.
I would also like to express my full appreciation towards my colleagues for their motivation, encouragement and moral support during my research work. To all people who have been helping me throughout my research, directly or indirectly, your contribution shall not be forgotten. Thank you.
iii
TABLE OF CONTENT
CERTIFICATION ... .
ABSTRACT ... ... ... ... ... ... ... ... ... ... ... ... ... ... ... ... ... ... ... ... ... ii
ACKNOWLEDGEMENT ... ... ... ... ... ... ... ... ... ... ... ... ... ... ... ... ... ... ... iii
CHAPTER 1: INTRODUCTION ... ... ... ... ... ... ... ... ... ... ... ... ... ... 1-3 !.!.Background of Study ... . 1.2.Problem Statement... 2
1.3.Research Significant... 2
1.4.0bjectives and Scope of Study . . . 3
CHAPTER 2: LITERATURE REVIEW ... ... ... ... ... ... 4-11 2.1. Definition of Heavy Metals... 4
2.2. Soil Pollution in Residential Yards... 5
2.3. Heavy Metal Sources and Dispersal . . .. . . .. . ... . . ... . . ... .. . .. . . .. 6
2.4. Effects of Heavy Metals to Humans . . . 8
2.5.Comparisons of Heavy Metal Concentration in Different Locations... I 0 CHAPTER 3: METHODOLOGY ... ... ... ... ... ... ... ... 12-18 3.1. Sampling Site... 12
3.2. Soil Sampling ... ... .. .. .. . .. .. . ... . . ... .. ... ... . . ... . . . .. .. . .. . . .... 12
3.3. Soil Analysis... 14
3.4.Atomic Absorption Spectroscopy .. . . .. . . .. ... .. . . .. . ... . . .. . ... . . .. 17
CHAPTER 4: RESULTS AND DISCUSSION... 19-29
4.1. Moisture Content in Soil Samples... 19
4.2. Heavy Metal Content in Residential Soil . . . .. 21
4.3.0verall Heavy Metal Content in Residential Soil . . . ... ... .. . .. . .. . . ... 28
CHAPTER 5: CONCLUSION AND RECOMMENDATION ... ... .... 30
5.1. Conclusion .. ... . ... .. . .. . .. . . .. . .. .. ... .. . . . .. . .. . . .. . .. . . ... .. ... .. . 30
5.2.Recommendation ... ... ... ... ... 30
REFERENCES... 31-33
APPENDICES ... ... ... ... ... ... ... ... ... ... ... ... ... ... ... .. . ... ... ... ... ... ... ... 34-36
LIST OF FIGURES
Figure 3.1: Two sampling locations for each residential yard chosen . .. ... . ... 12
Figure 3.2: (a) 0-8cm (b) 9-16cm ... 13
Figure 3.3: Soil Sampling . ... .. ... . . ... ... .. . . . ... . . .. . . ... ... .. . . ... .. ... .. . 13
Figure 3.4: Oven-Drying .. . . ... .. .. . .. . . .. .. . .. . . ... . . . .. .. . ... .. . . . ... . . ... ... 15
Figure 3.5: Soil Crushing Process... 15
Figure 3.6: The Sample Covered with a Watch Glass... 15
Figure 3.7: Heating the Sample on a Hot Plate... 15
Figure 3.8: Filter the Sample... 16
Figure 3.9: Atomic Absorption Spectroscopy ... . . .. . .. .. . . .. . . .. . .. . .. .. . .. .. 17
Figure 3.10: Simplified Diagram of AAS Equipment... 18
Figure 4.1: Moisture Content in Soil Sample . . . .. .. . . ... .. . . .. . .. .. . . . .. . .... 20
Figure 4.2: Pb Content in Residential Soil . . . 23
Figure 4.3: Zn Content in Residential Soil . . . 25
Figure 4.4: Cd Content in Residential Soil .. .... .. .. . .... ... . .. ... ... . . ... . . .. . .. . .. . . . 27
Figure 4.5: Overall Heavy Metal Content in Residential Soil . . . 28
LIST OFT ABLES
Table 2.1: Heavy metals uses and health effects to human . . . .. 9
Table 2.2: Heavy metals content and soil parameter in different locations... 10
Table 3.1: Soil sampling details... 14
Table 4.1: Moisture Content in Soil Sample . . . 20
Table 4.2: Pb Content in Residential Soil .. . . .. . . .. ... . .. . . . .. . .. . . .... .. ... .. .. 22
Table 4.3: Zn Content in Residential Soil . . . .. 24
Table 4.4: Cd Content in Residential Soil . .. .. ... . . .. . . . .. . . ... .. . . . .. .. . .. .. . .. .. 26
Table 4.5: Comparison with Other Study . . . .. 29
Table 4.6: Summary of Dutch Standard . .. .. ... . . . .. . . ... . .. . . . .. . .. . . ... .. ... .. . .. . 29
ABBREVIATION AND NOMENCLATURES
AAS Atomic Absorption Spectroscopy
Pb Lead
Zn Zinc
Cd Cadmium
Cu Copper
Cr Chromium
Hg Mercury
Ni Nickel
As Arsenic
Mn Manganese
AI Aluminium
Fe Iron
HN01 Nitric Acid
HCI Hydrochloric Acid
uv
Ultravioletppm Part per Million
CHAPTER 1 INTRODUCTION
1.1. Background of Study
Heavy metals represent special members of metals that are hazardous to the environment and health even when discharged in small quantities. They are one of the harmful elements that originate from various sources.
Anthropogenic activities such as mining and other industrial activities emit dusts and small particles that contain heavy metals. These metals are transported to the nearby area mainly through the atmosphere. The contaminants will then enter the soil through atmospheric deposition. Vehicle emission containing heavy metal such as Pb is also one of the factors that contribute to pollution in soil. The concentration of the heavy metals in the soil can be accumulated and increase in concentration after a long period of deposition time.
There are three main factors that influence the levels of heavy metals in soils which are traffic, industry and weathered materials, particularly house and street dust. Surface soil in urban areas is the indicator of heavy metal contamination from atmospheric deposition.
It is often assumed that urban areas are more contaminated than rural areas due to the high number of these potential sources. However, rural soils may also contain high concentration of metals due to the natural geologic sources, high amount usage of pesticide, localized industrial facilities and atmospheric deposition.
1.2. Problem Statement
Some heavy metals are naturally found in earth. They normally occur at low concentrations and are known as trace metals. These heavy metals are essential to human health in trace concentration. In high doses, they may be toxic to the body and tend to accumulate or increase in concentration in a biological organism over time.
Most people do not realize that air contains lots of heavy metals due to human activities, vehicle emissions and other sources. These heavy metals can harm human being by entering human body via inhalation, ingestion and skin absorption.
1.3. Research Significant
The awareness level of the heavy metal hazards among the general public is still low.
This research is very essential in order to raise the level of awareness among people living in residential areas which are close to anthropogenic sources that may emit lots of hazardous heavy metals. These heavy metals may disperse through the atmosphere to the nearby area and they will be deposited into the soil thus will be contaminated.
The deposited heavy metal may be harmful to the residents as they can enter the food chain through leaching into groundwater or plant absorption. Therefore, the residents who continuously consume the crops planted in their garden which the soil is contaminated will have a probability to get poisoned due to the accumulation of heavy metals in body.
Soil pollution may threaten human health not only through its effect on the hygiene quality of food and drinking water, but also through its effect on air quality. Soil pollution can sometimes enriched trace metal contents in airborne particles originate from soils (Chen et al., 1996).
Furthermore, there is a need to study heavy metal contamination within populated areas as such studies are limited in Malaysia.
1.4. Objectives and Scope of Study
The objectives of the research are:
• To study heavy metal loadings in residential yards around Tronoh, Perak
• To investigate the concentration ofPb, Zn and Cd in the soil of residential yards
• To compare levels of heavy metal in yards of housing estates and rural residential areas
The scope of study forthe research is residential yards within Tronoh. The research is to include the study on the heavy metals loadings in the selected residential yards by measuring their concentration in the soil. It is a need to know the concentration of the heavy metals in the residential yards since the effects it has to human are very significant.
3
CHAPTER2
LITERATURE REVIEW 2.1. Definition of Heavy Metals
Heavy metals represent special members of metals even when discharged in small quantities are hazardous to the environment and human health (Nagwan et al., 2006).
According to B.J Alloway (1995), the term 'heavy metal' is known as a large group of elements with an atomic density greater than 6 g/cm3•
Environmental contamination is one of the most important factors destroying the biosphere. Heavy metals play the main part in this destruction (Darunas et al., 2004 ).
Some of the metals are essential for many biological systems including humans at certain concentrations. However, they can exert toxic effects at high concentration (Hussain et al., 2005).
Heavy metal poisoning could result from drinking-water contamination, high ambient air concentrations near emission sources or intake via the food chain. The examples of heavy metals are Pb, Zn, Cu, Cd, Cr, Hg and Ni. These heavy metals occur as natural constituents of the earth crust and are determined as environmental contaminants since they cannot be degraded or destroyed (Duruibe et al., 2007).
More importantly, heavy metals can enter the food chain through leaching into groundwater or plant absorption. Therefore, they can threaten human health and sometimes cause chronic health conditions (X. Hang et al., 2008).
2.2. Soil Pollution in Residential Yards
Soil is an essential non-renewable resource and not only a part of ecosystem, but also occupies a basic role for humans (Loredana & Angela, 2008). It is a complex heterogeneous medium comprising mineral and organic solids, aqueous and gaseous components. Soils nonnally contain low natural levels of heavy metals and they are necessary for agriculture production but become hazardous when they occur in excess in soil (Sangi & Sasi, 2001 ).
Soil is not only a medium for plants to grow or a pool to dispose of undesirable materials, but also a transmitter of many pollutants to surface water, groundwater, atmosphere and food (Chen et al., 1996). Surface soil is a relevant exposure route for a variety of metals (Davis et al., 2009). Therefore, accumulated pollutants in surface soils can be transported to different environmental components such as deep soil, water, plant, and dust particles (Chen et al., 1996).
Dietary intake of heavy metals also poses risk to human health. Heavy metals such as Pb and Cd have been shown to have carcinogenic effects (Shanna et al., 2008). These heavy metals can enter human body by the food chain. Some of the residents might plant vegetables in their residential yards and then consume them without knowing the heavy metals level in the soil of the yards.
Soil pollution may threaten human health not only through its effect on the hygiene quality of food and drinking water, but also through its effect on air quality. For example, soil pollution can sometimes enriched trace metal contents in airborne particles originate from soils. Although not much attention has been paid to soil compared with food, water and atmospheric pollution, soil pollution has been emphasized increasingly by many environmental protection agencies and communities (Chen et al., 1996).
The high concentration of heavy metals in soils has posed adverse effect on human health because it can be easily transferred into human bodies from suspended dust or by direct contact (Sun et al., 2009).
5
2.3. Heavy Metals Source and Dispersal
Heavy metals may come from many different sources. Main anthropogenic sources of heavy metals are from various industrial such as current and former mining activities, foundries, smelters and diffuse sources, traffic, industrial and human activities (Omar, 2004). The usage of insect sprays, pesticides and fertilizers also contribute to the emission of heavy metals to the environment. These heavy metals that are being emitted can be transported through several mediums such as water and atmosphere.
Three main fuctors known to influence the levels of heavy metals in soils which have been reported are traffic, industry and weathered materials, particularly house and street dust. The increasing anthropogenic activities intensity the emission of various pollutants into the environment and introduce different types of harmful substances into the atmosphere. (AI-Khlaifat, 2007).
One of the important heavy metals source is the vehicle emission (Omar, 2004). High Pb concentration in air and soil in urban areas has been attributed due to the increasing number of automobiles, especially leaded petrol (Heinze et al., 1998). It has been noted that the location close to the roads are severally polluted by heavy metals such as Pb, Zn, Cu, Cd, etc. from traffic (Omar, 2004 ).
Many of the studies concerning Pb availability from soil have been carried out on soils polluted by mining activities or by Pb smelters (Mercier. 2001). However, there are other sources of Pb pollution such as the spreading of sewage sludge and gas emissions from cars (Mercier et al., 200 I).
Pb is a common heavy metal whose dispersion into the environment from various sources has led to its widespread occurrence in soil, water and air. Anthropogenic dispersion of this metal is derived from mining activities. its use as a fuel additive for nearly 70 years, its use as a paint additive for nearly 50 years and its use in pesticides and other industrial chemicals (EIIess, 2007).
Worldwide, the Pb concentration of soils receiving atmospheric deposition ranges from I 0 to 84 mg/kg (Elless, 2007). Due to the severe health effects, particularly in children, the Secretary of Health and Human Services in 1991 called Pb "the number one environmental threat to the health of children in the United States"
(http://www .epa.gov/iaq/lead.html, verified on 28-1 0-09).
Another most important factor of heavy metals pollutions IS mining activities. The activities cause a great destruction to the environment. Mining sites emit large quantities of waste which must be deposited on land or in aquatic systems (Edeltrauda, 1999).
They can affect relatively small areas but can have large local impact on the environment. Release of metals from mining sites occurs primarily through erosion of waste dumps, air emission and deposition (Salomon, 1994 ).
Active mining sites as well as abandoned mining sites can contaminate the surrounding and ecosystem by the release of heavy metals and dust into the air through wind blow dust particles (Alia et al., 2006). According to the Abandon Mine Site Characterization and Cleanup Handbook, (2000), during mining and mineral processing, dusts that contain gaseous and particle are emitted. The impacts caused by gaseous and particle emission usually focused on the contaminated soils associated with the downwind deposition.
The heavy metals emitted into the atmosphere as dusts will be unequally dispersed around the point sources (Mariana et al., 2006). The dispersal depends on the wind direction, geographical area and local meteorological factors such as fog, rains and thermal inversions. A low speed of the wind of2.2 m/s will lead to a weak ventilation of the area and the dusts from the air will deposit into the soil on the short distances from the point source (Mariana et al., 2006).
7
In the northeastern United States, regional studies of heavy metal contamination in forest soils showed a significant relationship between Pb concentrations and proximity to major urban areas, whereas variations in the amounts of Zn, Cu, Ni, and Cd did not appear to be related to atmospheric patterns of deposition except near the point sources of pollution (Yesilonis, 2008).
2.4. Effects of Heavy Metals to Humans
Heavy metals commonly found in the modern environment in air, soil, food and drinking water. Heavy metals accumulation in soil and plant is the increasing concern because of the potential human health risks. They affect human health because the body cannot break it down upon ingestion or inhalation. Thus, they can lead to poisoning (Khan et at., 2007).
A common poisonous metal is Pb. At high levels of human exposure, there is damage to almost all organs and organ systems. The most important to be damaged is the central nervous system, kidneys and blood, culminating in death at excessive levels. Pb exposure can come from many sources including soil, air, drinking water, food, paint and house dust. Pb remains in the body and disturbs the enzyme system and the formation of hemoglobin. Hemoglobin carries oxygen through bloodstream to organs and tissues. When high levels ofPb are present, the entire body is affected especially the nervous system and kidneys. It is particularly dangerous for children because of their immature neurological system (Tong et at., 2000).
Direct oral ingestion of contaminated soils and dust by children is the principal cause of Pb absorption. Pb present in soils and dust at concentrations of 500-1000 mg/kg can affect children's health (Mercier, 200 I).
Developing fetuses will be affected the most by heavy metals because their brains are growing much faster than an older child or adult. In addition, the brain stores the toxins because of the body's survival instinct. The heavy metals stored in the brain cells might
Most heavy metals in high concentrations have an adverse effect on human health, especially on the health of young children, who have a higher rate of absotption of heavy metals because of their active digestion systems and sensitivity to hemoglobin (Li et al., 2004 ).
Table 2.1 listed the uses of several heavy metals and its health effect on human (Azila, 2008). The characteristics of heavy metals are described as:
I. Toxicity that can last for a long time in nature.
2. Transformation of low toxic heavy metals to more toxic form m a certain environment, such as Hg.
3. Bioaccumulation of heavy metals by food chain that could damage normal physiological activity and endanger human life.
4. Heavy metals cannot be degraded including biotreatment.
5. Heavy metals are very toxic even at low concentration ( 1.0-10 mg/L ). Metal ions such as Cd and Hg have been reported very toxic even in lower concentration range from 0.001 to 0.1 mg/L (Azila, 2008).
Table 2.1: Heavy memls uses and health effects to human (Azila, 2008)
Heavy Metals Uses/Sources Health Effects
Metal processing plants, burning of
Internal cancer, skin lesions and Arsenic (As) fossil fuels, mining of arsenic containing
death ores and use of arsenical pesticides
Electroplating, fertilizers. mineral Cancer, lung insufficiency, Cadmium (Cd)
processing and battery manufucturing disturbances in cardiovascular system, liver and kidney damage Copper and brass plating, mining, metal Normocytic, hypochromic, anemia, Copper (Cu) industries and copper-ammonium rayon leucopenia and osteoporosis; copper
industries deficiency
Chromium (Cr) Metal plating, leather, mining, Ulcer, skin irritation, liver and galvanometry, dye production kidney damage
Metal plating, textile, battery Spontaneous abortion, damage Lead (Pb) manufucturer, automotive and petroleum nervous system, kidney and brain
industries damage
Pesticides, fertilizers, chemical Loss of appetite, decreased sense of Zinc (Zn)
manufacturing and metal finishing taste and smell, slow wounding healing and skin sores
9
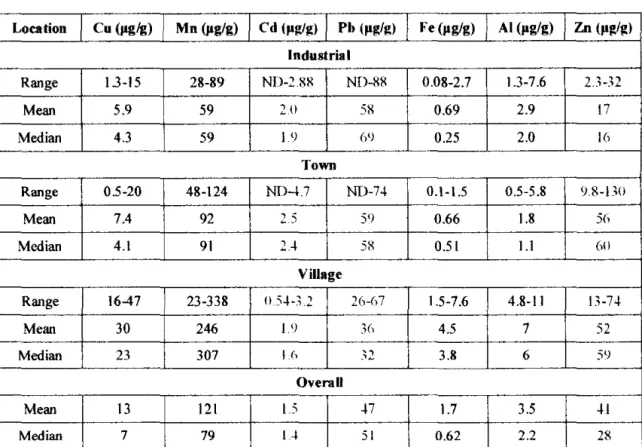
2.5. Comparisons of Heavy Metal Concentration between Different Locations Table 2.2 shows the results from a study to detennine the heavy metals contents in the soils from nurseries. The study has been conducted in Dungun, Terengganu. Soil samples from different general land usage backgrounds were chosen.
The first group of sampling location is the industrial area with a high density of petroleum chemical industry, power plant and main road with heavy traffic load. The second group of sampling site is the town with the heavily frequented urban traffic routes. The third group of sampling is a village at the edge of urban with low traffic and negligible industries.
Table 2.2: Heavy metals content and soil parameters in town, industrial and village soil samples (Norbayati et at~ 2007)
Location Cu (pg!g) Mn (J1glg) Cd (fig/g) Ph (fig/g) Fe (pglg) AI (pg/g) Zn (pg/g) Industrial
Range 13-15 28-89 ND-2.8~ ND-88 0.08-2.7 1.3-7.6 2J-32
Mean 5.9 59 2.0 5X 0.69 2.9 17
Median 4.3 59 I 9 69 0.25 2.0 16
Town
Range 0.5-20 48-124 ND-4.7 ND-74 0.1-1.5 0.5-5.8 9.8-BO
Mean 7.4 92 2.5 59 0.66 1.8 56
Median 4.1 91 2A 5X 0.51 l.l 60
Village
Range 16-47 23-338 0.54-:1.2 26-67 1.5-7.6 4.8-11 13-N
Mean 30 246 1.9 3() 4.5 7 52
-
Median 23 307 I_()
.,
-·~ 3.8 6 59
OventU
Mean 13 121 l.5
n
1.7 3.5 ~IMedian 7 79 lA 51 0.62 2.2 28
Basically, most of the metals contents except Pb, Zn and Cd in town and industrial areas are lower compared to soils on the village areas. Pb and Cd are anthropogenic metals and they are normally not abundant in upper layer soils. The level of these metals in the soils of three areas with the exception ofZn from industrial area are within similar range suggesting they might be derived from common input since all the sampling areas were near busy roadside (Norhayati et al., 2007).
The variation of heavy metals concentration between the study areas could generally be attributed to differences in population densities and the degree of the industrial activities in the respective area.
II
CBAPTER3
METHODOLOGY
3.1. Sampling Site
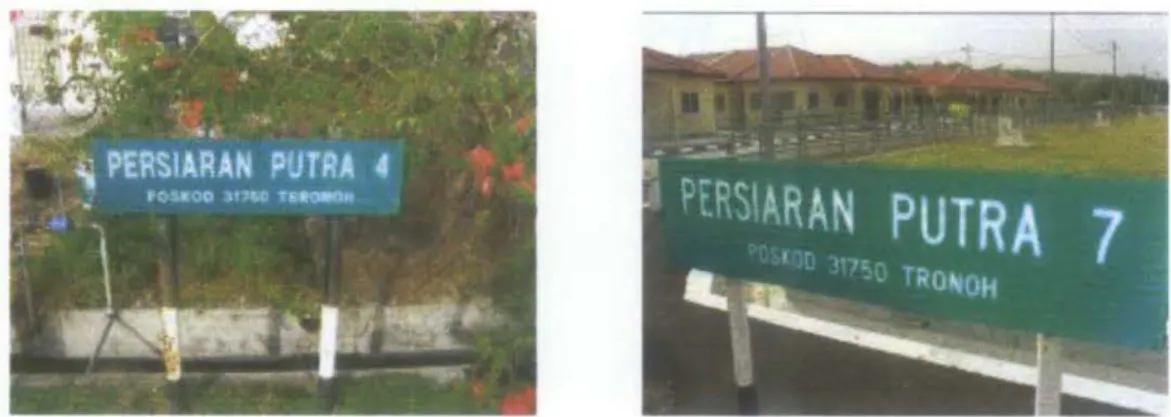
The study was conducted in the district of Tronoh, a town located in Perak, Malaysia. In this study, three residential yards were chosen as the sampling locations. The first sampling site is Taman Tasek Putra which is located near a mining area and also next to a medium frequented traffic route. The second sampling site is Taman Universiti, located approximately 5km from the first sampling site. The third sampling site is Bota which is a rural area next to Tronoh with a low volume of traffic and has no significant industry activity or negligible industrial area
3.2. Soil Sampling
1. For each sampling site, soils from two random points were chosen.
Figure 3.1: Two sampling locations for eacb residential yard chosen
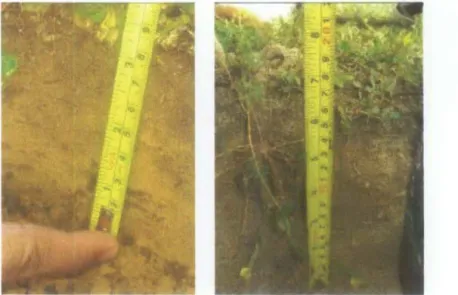
2. Two soil samples for each point were taken at different depth; the upper part (0-8cm) and the lower part (9-16cm).
Figure 3.2: (a) 0-Scm (b) 9-16cm
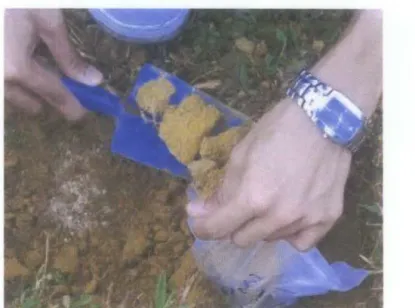
3. The samples placed into sampling bags and sent to the laboratory for the analysis.
Figure 3.3: Soil Sampling
13
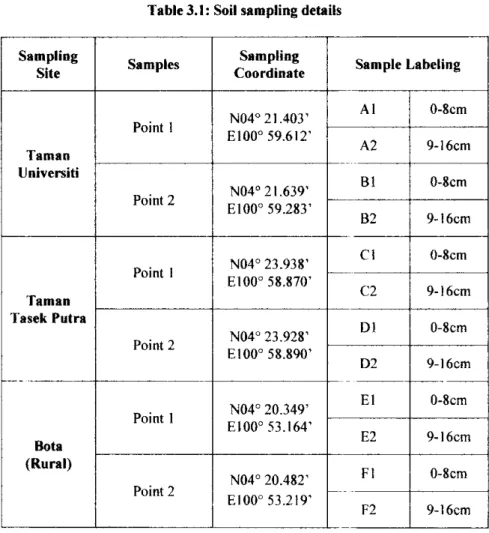
Table 3.1: Soil sampling details Sampling
Samples Sampling
Sample Labeling
Site Coordinate
N04° 21.403' AI 0-8cm
Point I
El00° 59.612'
A2 9-16cm
Taman Universiti
Bl 0-8cm
Point 2 N04' 21.639' EIOO' 59.283' f -
B2 9-16cm
N04' 23.938' Cl 0-8cm
Point I 1--
ElOO' 58.870'
C2 9-16cm
Taman Tasek Putra
Dl 0-8cm
N04° 23.928' Point 2
E I 00' 58.890'
D2 9-16cm
--·- -
N04' 20.349' El 0-8cm
Point I
EIOO' 53.164'
E2 9-16cm
Bola (Rural)
Fl 0-8cm
N04' 20.482' Point 2
EIOO' 53.219' f--
F2 9-16cm
3.3. Soil Analysis
I. The weight of the soil sample was recorded. The sample was then air-dried for five days and the weight was measured once again to find the moisture content of the soil.
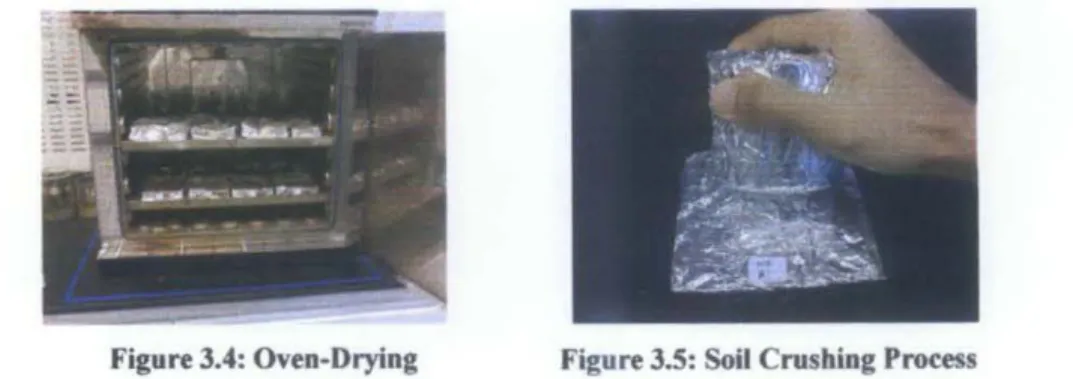
2. The soil sample was heated in an oven at 120°C for 24 hours to remove the organic matter such as dry leaves, humus and decaying plants and other living organisms from the soil. Besides, it was also done to completely remove the moisture content.
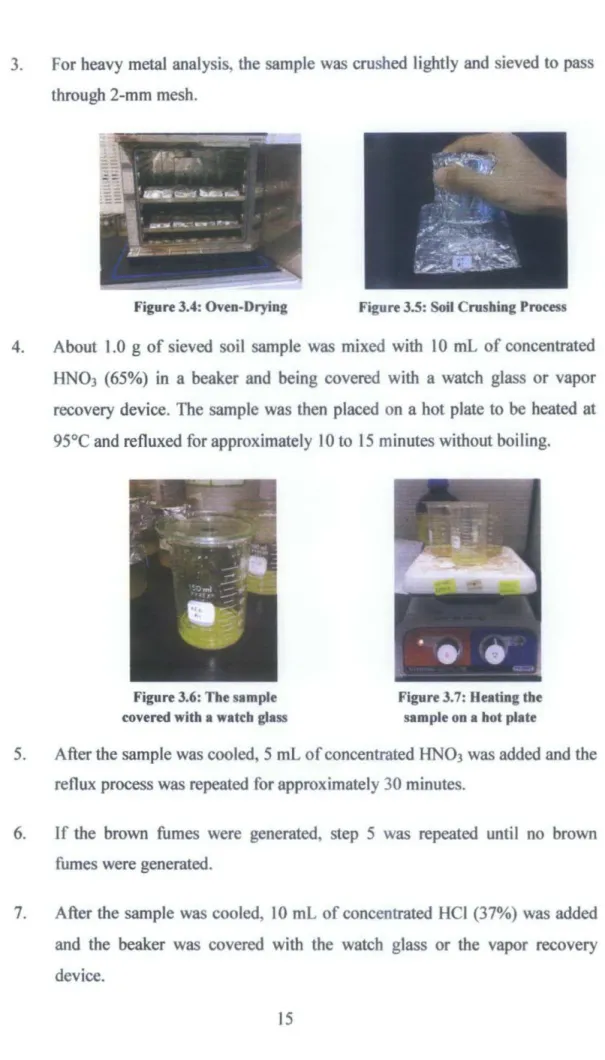
3. For heavy metal analysis, the sample was crushed lightly and sieved to pass through 2-mm mesh.
Figure 3.4: Oven-Drying Figure 3.5: Soil Crushing Process
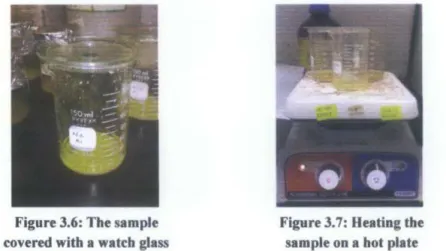
4. About 1.0 g of sieved soil sample was mixed with 10 mL of concentrated HN03 (65%) in a beaker and being covered with a watch glass or vapor recovery device. The sample was then placed on a hot plate to be heated at 95°C and refluxed for approximately I 0 to 15 minutes without boiling.
Figure 3.6: Tbe sample covered witb a watcb glass
Figure 3.7: Heating tbe sample on a bot plate
5. After the sample was cooled, 5 mL of concentrated HN03 was added and the reflux process was repeated for approximately 30 minutes.
6. If the brown fumes were generated, step 5 was repeated until no brown fumes were generated.
7. After the sample was cooled, 10 mL of concentrated HCl (37%) was added and the beaker was covered with the watch glass or the vapor recovery device.
15
8. The sample was then heated at 95°C and retluxed for 15 minutes.
9. The watch glass or the vapor recovery device was then removed and the heating process continued until the volume of the content was reduced to approximately 5 mL.
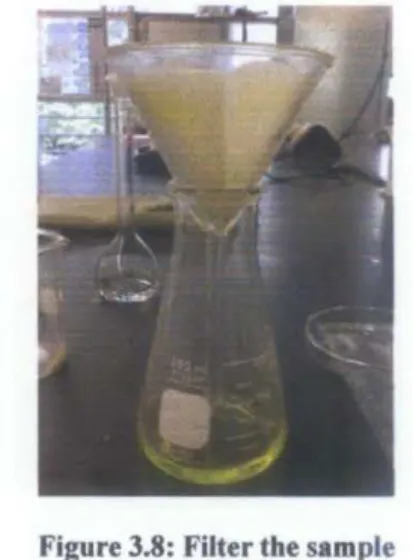
10. The content was cooled to the room temperature, filtered through filter paper and diluted with distilled water into a I 00 mL volumetric flask.
Figure 3.8: Filter the sample
11. The content of the flask was brought to the required volume with distilled water.
12. The samples were ready to be analyzed by the AAS for Pb, Zn and Cd.
3.4. Atomic Absorption Spectroscopy (AAS) 3.4.1. Introduction
AAS is a device that is being used to detennine the existence and the concentrations of heavy metals such as Pb, Zn, Cu, Fe, AI, Ca, Cd and others in a sample.
It uses the absorption of light to measure the concentration of a gas-phase atom. UV light will be absorbed by the metals when they are heated and being in the excited state.
Each metal has its own characteristic wavelength that will be absorbed. The AAS instrument looks for a particular metal by focusing a beam of UV light at a specific wavelength through a flame and into a detector. The sample of interest is aspirated into the flame. If that metal is present in the sample, it will absorb some of the light thus its intensity is reduced. The instrument measures the change in intensity. A computer data system converts the change in the intensity into an absorbance.
As the concentration goes up, absorbance goes up. The researcher can construct a calibration curve by running standards of various concentrations on the AAS and observing the absorbance. In the lab, the computer data system will draw the curve for the researchers. Then, samples can be tested and measured against this curve.
Figure 3.9: Atomic Absorption Spectroscopy
17
3.4.2. Theory
The atomic absorption spectroscopy uses the principles of Beer-Lambert law. The Beer- Lambert law is a linear relationship between absorbance and concentration of an absorber of electromagnetic radiation. The general Beer-Lambert law is usually written as:
A=a;. xbxc
where A is the measured absorbance, a).. is a wavelength-dependent absorptivity coefficient, b is the path length of the sample, and c is the concentration of compound in the solution.
Experimental measurements are usually made in terms of transmittance (T), which is defined as:
where I is the intensity of light after it passes through the sample and 10 is the initial light intensity. The relation between A and Tis:
A= -log(T)= -to{~ J
lens lens detector
[ ~ 0 0 I
monochromatorI
hoi
ION
atomized cathode lai'J1) samplereadout
01996B.M. TisstJe, ~ediel.com
CHAPTER4
RESULTS AND DISCUSSION 4.1. Moisture Content in Soil Samples
Soil moisture content indicates the amount of water present in the soil. It is not constant with time and may vary. The amount of moisture found in soil varies greatly with the type of soil, climate and the amount of humus in the soil. It is commonly expressed as the amount of water (in mm of water depth) present in a depth of one meter of soil.
In this research, the moisture content is reported as the percentage on a weight basis.
Soil samples were dried in an oven and the weight of the soil after drying is compared to the weight before drying.
Below is the formula that is used to calculate the percentage of moisture in the soil sample. The example of the moisture content for sample A I is calculated.
u . (o/) Wet Weight- Dry Weight I O
mOISture /0
=
X 0Wet Weight
l l . (0/) 676.95-623.83 100 7850/
mOisture /O
=
x = . /o676.95
19
Sampling Location
Taman Universiti I
Taman Universiti 2
Taman Tasek Putra I
Taman Tasek Putra2
Bota I
Bota2
t..
..
:!OOo!
= 0 1 ~0ov
.
~ ;::
0
-
IOOo~
~00
OOo
Table 4.1: Moisture Content in Soil Samples
Depth Sample Weigbt(g) Moisture
Content(£)
0-8cm AI Wet 616.95
53.12 Dry 623.83
9-16cm A2 Wet 607.89
18.90 Dry 588.99
0-8cm Bl Wet 487.34
82.44 Dry 404.90
9-16cm 82 Wet 572.80
68.86 Dry 503.94
0-8cm Cl Wet 384.17
18.54 Dry 365.63
9-16cm C2 Wet 830.69
36.49 Dry 794.20
0-8cm Dl Wet 947.39
32.17 Dry 915.22
9-16cm D2 Wet 746.48
16.20 Dry 730.28
0-8cm El Wet 296.31
77.23 Dry 219.08
Wet 290.68 9-16cm E2
Dry 221.82 68.86
0-8cm Fl Wet 170.31
42.00 Dry 128.31
Wet 206.74 9-16cm F2
Dry 156.91 49.83
Moisture Content in Residential Soil
Tam.'lll TaJil<'lll T01111o111 Ta.llo'lll Bola 1 Bola :!
lllll\'efSih l'lll\eiSih TOI;;d. TOI;;d:
1 :! PI lira 1 Pl•tra:!
Moisture Content(%)
7.85%
3.11%
16.92%
12.02%
4.83%
4.390/o 3.40%
2.17%
26.06%
23.690/o 24.66%
24.10%
•O·&au 9·Hu:m
Based on the results above, the top soil contains more moisture compared to the bottom soil because the top soils are normally fine and less porous. Hence, they can contain more water.
Besides that, the moisture content varies based on the location. There are several factors that influence the moisture content in soil which are the type of soil and the sampling time. For example, if the samples are taken during the rainy season, the moisture content will be higher.
4.2. Heavy Metal Content in Residential Soil
The readings that are retrieved from the AAS are in the unit of ppm (mg/L ). The unit needs to be converted into mg/kg. Therefore, the conversion formula as follows is used:
Concentration(
m?:~)
Concenlrolion( mg L) x Vol of Extraction(L) x Dilution Factor Weight of .\'ump!e(kg)For example, the average concentration of the top soil from Taman Universiti I IS 2.7186 mg/L.
r{ ){, )
2.7186mg x O.lL xI ){,Concentratio mg
=
L=
271.86111g .kg O.OOlkg kg
After the conversion, the concentration of the heavy metal is 271.86 mg/kg. It indicates that every kilogram of soil contains 271.86 mg ofPb.
21
Table 4.2: Pb Content in Residential Soil
Sampling Sample Concentration
Concentration
Depth Reading from AAS
Location Label
(mg/L) (mg/kg)
Reading I 2.5753 257.53
0-8cm AI Reading 2 2.8262 282.62
Taman Average 2.7186 271.86
U niversiti l Reading I 5.2634 526.34
9-16cm A2 Reading 2 4.9767 497.67
Average 5.1201 512.01
Reading I 2.1093 210.93
0-8cm Bl Reading 2 2.0376 203.76
Taman Average 2.0735 207.35
U niversiti 2 Reading I 2.7545 275.45
9-16cm B2 Reading2 2.6828 268.28
Average 2.7186 271.86
Reading I 2.5753 257.53
0-8cm Cl Reading 2 2.5394 253.94
Taman Tasek Average 2.5753 257.53
Putra I Reading I 1.8226 182.26
9-16cm C2 Reading 2 1.7867 178.67
Average 1.7867 178.67
- - · - · - - · · - · · ···~--
Reading I 1.6222 162.22
O-S em Dl Reading 2 1.5801 158.01
Taman Tasek Average 1.6012 160.12
Putra 2 Reading I 1.4115 141.15
9-16cm D2 Reading 2 1.3904 139.04
Average 1.3904 139.04
Reading I 1.6222 162.22
0-8cm El ~eading2 1.4326 143.26
---··· --~--
Bola I Average 1.5169 151.69
Reading I 1.7065 170.65
9-16cm E2 Reading 2 1.6855 168.55
Average 1.6855 168.55
Reading I 1.6222 162.22
0-8cm Fl Reading 2 1.7065 170.65
Bota2 Average 1.6644 166.44
Reading I 1.5801 158.QI
9-16cm F2 Reading 2 1.4958 149.58
Average 1.5379 153.79
600
-
Clot:,/.
!
-400~
-
300~
- -
i .. 00~
-
u 0 100
0
Pb ('on tent in Re~ideotial SoU
• 0-Scm
• Q-16cm
Taman Taman Tam<lll T<l!nan Bota 1 Bola ~
lTmnrs1h llnl\et:;lti Tasek Ta~ek
1 -. .Puhnl Pull a~
S:unplint Lorntion
Figure 4.2: Pb Content in Residential Soil
For the top soil, the highest Pb concentration is 276.86 mglkg which is Taman Universiti I. The lowest value is in Bota 1 with the value of 151.69 mglkg.
For the bottom soil, Taman Universiti l give highest reading of 512.01 mglkg and the lowest reading is 139.04 mglkg which is the soil from Taman Tasek Putra 2.
Basically, the Pb content in the top soil ofTaman Universiti and Taman Tasek Putra is higher compared to the Bota residential area. It is proven that the location of the sampling site is the main factor that contributes to the concentration ofPb.
Taman Universiti and Taman Tasek Putra are located near to the main road with heavy traffic compared to the Bota residential which can be considered as rural area with low traffic.
23
Table 4.3: Zn Content in Residential Soil
Sampling Sample Concentration
Concentration
Deptb Reading from AAS
Location Label
(mg!L) (mglkg)
Reading I 0.2977 29.77
0-8cm AI Reading 2 0.2873 28.73
Taman Average 0.2918 29.18
Universiti
I Reading I 0.2560 25.60
9-16cm A2 Reading 2 0.2322 23.22
Average 0.2441 24.41
Reading I 0.5910 59.10
0-8cm Bl Reading 2 0.6088 60.88
Taman Average 0.5999 59.99
Universiti
Reading I
2 0.3126 31.26
9-16cm B2 Reading 2 0.320 I 32.01
Average 0.3156 31.56
Reading I 0.4778 47.78
0-8cm C1 Reading 2 0.4972 49.72
Taman Average 0.4883 48.83
Tasek
Putra I Reading I 0.4615 46.15
9-16cm C2 Reading 2 0.4734 47.34
Average 0.4674 46.74
1--- -~--- - - · · · · - - -I - . - - - ..
Reading I 0.6192 61.92
0-8cm 01 Reading 2 0.647 64.70
Taman
Average 0.6331 63.31
Tasek
Putra 2 Reading 1 0.4845 48.45
9-16cm D2 Reading 2 0.5013 50.13
Average 0.4924 49.24
Reading 1 1.9301 193.01
0-8cm El Reading 2 1.9906 199.06
- ·----· - . - - - -f - - - - ·--·-·
Bota 1 Average 1.9608 196.08
Reading 1 1.0701 107.01
9-16cm E2 Reading 2 1.073 107.30
Average 1.0711 107.11
Reading 1 0.9492 94.92
0-8cm F1 Reading 2 0.9779 97.79
Bota2 Average 0.9641 96.41
Reading I 0.9432 94.32
9-16cm F2 Reading 2 0.9779 97.79
Average 0.9601 96.01
=
E 100!:::
v
0 "\00
Zn Content in Residential Soil
Tll!llall Taman Tlllnasl Tll!nrul Bota 1 Bota 2 Utllnrstll Untnri:th Tasek Ta..;ek
J ~ Putt a J Putra 2 Samplinl Lor:lUon
Figure 4.3: Zn Content in Residential Soil
• 0-Scm 9·16cm
The highest Zn concentration is in Bota 1 residential soil with the concentration of 196.08 mglkg for the top soil. While the lowest Zn concentration is 29.18 mglkg which is from the top soil of Taman Universiti I.
For the bottom soil, the highest concentration is 107.11 mg/kg, also from Bota 1 and the lowest is from Taman Universiti I with the concentration of24.41 mglkg.
Zn concentration in Bota residential area is higher than Taman Tasek Putra and Taman Universiti. It is assumed that main causes are not from the atmosphere deposition, but from other activities that may have occurred in Bota such as dumping activities or past activities. Besides that, it can also be assumed that the usage of the pesticides or fertilizers may contribute to the high Zn levels.
25
Table 4.4: Cd Content in Residential Soil
i Concentration
Sampling
Depth Sample I
Reading from AAS Concentration
Location Label
(mg/L) (mglkg)
Reading I 0.0613 6.13
0·8cm AI Reading 2 0.0590 5.90
Taman Average 0.0598 5.98
Universiti I Reading I 0.0605 6.05
9-16cm A2 Reading 2 0.0652 6.52
Average 0.0629 6.29
Reading I 0.0675 6.75
0-8cm Bl i Reading 2 0.0621 6.21
Taman Average 0.0644 6.44
U niversiti 2 Reading I 0.0590 5.90
9-16cm B2 Reading 2 0.0559 5.59
Average 0.0574 5.74
Reading I 0.0776 7.76
0-8cm Cl Reading 2 0.0768 7.68
Taman Tasek Average 0.0768 7.68
Putra I Reading I 0.0590 5.90
9-16cm C2 ' Reading 2 I 0.0582 5.82
'
Average 0.0582 5.82
·----- · - - - - -f-·-- ···-· .. · - · · · - · - · · - - - -
Reading I 0.0699 6.99
O-S em Dl Reading 2 0.0660 6.60
Taman Tasek Average 0.0675 6.75
Putra 2 Reading I 0.0691 6.91
9-16cm 02 Reading2 0.0636 6.36
' Average 0.0660 6.60
Reading I 0.0761 7.61
0-8cm E1 ~Reading 2 0.0714 7.14
----~---- -- . - · - · · · · - - - -
! Average 0.0737 7:37
Bota I
Reading 1 0.0706 7.06
9-16cm E2 Reading2 0.0629 6.29
Average 0.0668 6.68
Reading 1 0.0551 5.51
0-8cm Fl Reading 2 0.0497 4.97
Bota2 Average 0.0520 5.20
Reading 1 0.0551 5.51
9-16cm F2 Reading 2 0.0551 5.51
Average 0.0551 5.51
9
-
~ lloli.,
8-
c: 6 .::..2
- =
e: 4 ~=
t(J 3
=
0"
\.I
-
1 0
Cd Content in Residential Soil
Taman T.-na~t Taman Tam.-1 Bota 1 Bota :!
Una\'ersllt Unn·erstlt Tasek Tasek 1 :! Pttlta 1 Pttlta:!
S:unpUnj[ Lorntlon
Figure 4.4: Cd Content in Residential Soil
• 0-8cm 9-16cm
For the top soil, the highest Cd concentration is 7.68 mglkg which is Taman Tasek Putra 1. The lowest value is in Bota 2 with the value of 5.2 mg/kg.
For the bottom soil, Bota I give highest reading of 6.68 mglkg and the lowest reading is 5.51 mglkg which is the soil from Bota 2.
Cd concentration is very low for all sampling sites. This could be due to the sampling locations are away from any industry activities. Cd is normally found in soil close to industrial area and it is a common indicator of industrial influence.
27
4.3. Overall Heavy Metal Content in Residential Soil
Bea,)·l\Ietal Content in Residential Soil
600 00
~00 00
~
-400 00ct
=
...
=
Q300 00
=
f- =
4-:: 0 :?.00 00
v
100 00
0 00
Trumm Trunru1 Trumm Trunrut Bota 1 Bola :?.
UJU\'erstll Umnrs11t T~ek Tasek 1 :?. Pnrral Pllrra:?.
Figure 4.5: Oven II Heavy Mebtl Content in Residential Soil
•Pb(O-Scm)
•Pb(9-16cm)
• Zn ( 0-Scm)
•Zn(9-16cm)
• Cd(O-Scm) Cd (9-J6cm)
Based on the results above, the concentration of heavy metal in the top soil (0-8cm) seems to be higher compared to the concentration of the bottom soil (9-l6cm). This is due to the deposition of heavy metal from the atmosphere. The top soil indicates recent deposition and the bottom soil has older concentration.
For the case where the bottom soil is higher than the top soil, it is possible that the soil originates from other places where the content ofPb is high. Some of the soil may have been brought in by the developer from other sources to the location for the purpose of building the foundation for the residential area. Furthermore, it may also indicate deposition from past activities.
From the overall results, Pb was found to be the highest heavy metal found in residential
Table 4.5 gives the comparison between heavy metal contents obtained in Tronoh and Bota soil with those reported in literature. It shows the average of the heavy metal concentration for every location.
Table 4.5: Comparison with Other Study
Average Heavy Residential Estate Rural Norha~·ati et aL, 2007 Metals Content Taman Taman Tasik
(mglkg) Universiti Putra Rota Town Village Industrial
- .. - ·f---~---· -~~--
Pb 316 184 160 59 3(} 58
~---~-~ '---- -· -- ---~--- -· ---.
Zn 36 52 124 56 52 17
-- ---- . . - - - - - ---
Cd 6 7 6 1 2 15
.. --~~---
_ _ _ _ L _ ___ ··---~-~---- --~---"""
From the comparison with the study that has been done by Norhayati, the trend is quite similar for Pb and Cd. Pb found in town is higher compared to the concentration in village. The same trend can be observed in this study where the concentration of Pb in residential estate seems to be higher than the rural area. As for Cd, the concentration in industrial area is higher compared to the concentration in town and village.
Heavy Metal Pb Zn Cd
Table 4.6: Summary of Dutch Standards
(http://www.economicexpert.com/a/Dutch:standards.htm) Soil (mglkg dry matter)
Reference Inten·ention Taman Taman Tasik
Value Value UniYersiti Putra
85.0 5~0 316 184
1~0 720 36 52
0.8 12 6 7
Rota 160 124 6
The comparison has also been done with the Dutch Standards to clarify either the concentration of heavy metal in soil is still within the allowable limit. From the comparison, the concentration that has been measured is not exceeding the intervention value. Therefore, the heavy metal concentration in Tronoh is considered as within the acceptable range.
29
CHAPTERS
CONCLUSION AND RECOMMENDATION 5.1. Conclusion
As the conclusion, the heavy metal especially Pb is higher in residential estates compared to the rural residential areas. It is also can be concluded that the heavy metal concentration is affected by the distance from the point sources. The concentrations decrease as the distance from these point sources increase.
Top soil or surface soil is the best indicator of heavy metal contamination from recent atmospheric deposition.
From the study, the level of heavy metal in residential yards m Tronoh, Perak 1s acceptable and within the allowed range of concentration.
5.2. Recommendation
The followings are the recommendations that could be made to control or reduce heavy metal loadings in residential yards:
• Environmental planning is considered not to be luxury. Therefore, before starting any project, a study to evaluate the environmental impacts has to be conducted as part of other feasibility studies.
• Monitoring heavy metals build up in the environment 1s a need as it IS a recommended practice all over the world.
REFERENCES
Alia D., Dominik J. W., Reimar S., Peter D., 2006, Dust dispersal and Pb enrichment at the rare-metal Orlovka-Spokoinoe mining and ore processing site: Insights from REE patterns and elemental ratios, Imperial College London
Chen T. B., J. W. C. Wong, H. Y. Zhou and M. H. Wong, 1996, Assessment of Trace Metal Distribution and Contamination in Surface Soils of Hong Kong, Chinese Academy of Sciences
Darunas A., Antanas A., 2004, Migration of Heavy Metals in Soil and Their Concentration in Sewage and Sewage Sludge, Lithuanian Institute of Agriculture
Duruibe J. 0., Ogwuegbu M. 0. C., Egwurugru J. N., 2007. Heavy Metal Pollution and Human Biotoxic Effects, Federal Polytechnic Nekede. P.M., Nigeria
Edeltrauda H. R., 1999, Impact of Mining and Metallurgical Industries on the Environment in Poland, University of Mining and Metallurgy
Harley T. Davis, C. Marjorie Aelion, Suzanne McDermott, Andrew B. Lawson, 2009, IdentifYing Natural and Anthropogenic Sources of Metals in Urban and Rural Soils using GIS-based data, PCA and Spatial Interpolation, University of South Carolina
Hussain 1., Marwat G. A., Khan 1., Ali J., Khan S. A., Ali L., Shah T., 2005, Heavy Metals Investigation in Selected Agricultural Soils of NWFP, Pakistan, University of Peshawar
Loredana P., Angela S., 2008, Monitoring of Heavy Metals Soil Contents in the Area of Thermal Power Plants in Romania, World Academy of Science, Engineering and Technology
M. P. Elless, C. A. Bray, M. J. Blaylock, 2007, Chemical Behavior of Residential Lead in Urban Yards in the United States, Edenspace Systems Corporation, USA
31
Mariana D., Vasile V., Gheorghe V., 2006, Contribution to the Study of Heavy Metals Concentration Variation in Sedimentab/e Dusts According to the Distance from the Pollution Source, North University of Baia Mare
Mercier G., Jose'e Duchesneb, Andre' Carles-Giberguesc, 2001, A simple and fast screening test to detect soils polluted by lead, Que 'bee, Canada
Nagwan G. Zaki, I. A. Khattab, N. M. Abd El-Monem, 2006, Removal of Some Heavy Metal by CKD Leachate, National Research Centre, Egypt
Norhayati M. T., Poh S.C., Maisarah J.,