I would like to express my deepest gratitude to Dr. Yeong Wai Mun, who is the supervisor of this research project. The researcher would like to dedicate the thesis work to Dr. Yeong Wai Mun, the supervisor of this research project.
RESEARCH OVERVIEW
- Introduction
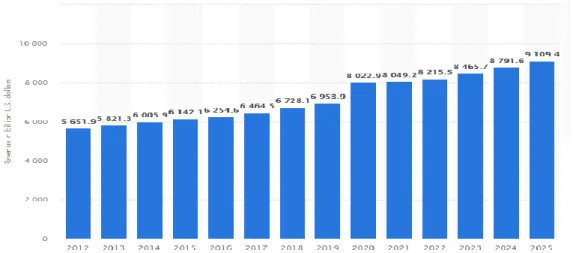
- Research Background
- Problem Statements
- Research Objectives
- Specific Objectives
- Research Questions
- Hypotheses of the Research
- Significance of Study
- Conclusion
To investigate the relationship between trust and consumers' intention to use self-order kiosks in restaurants. H1: There is a correlation between perceived usefulness and intention to use a self-order kiosk in a restaurant.
LITERATURE REVIEW
- Introduction
- Underlying Theory
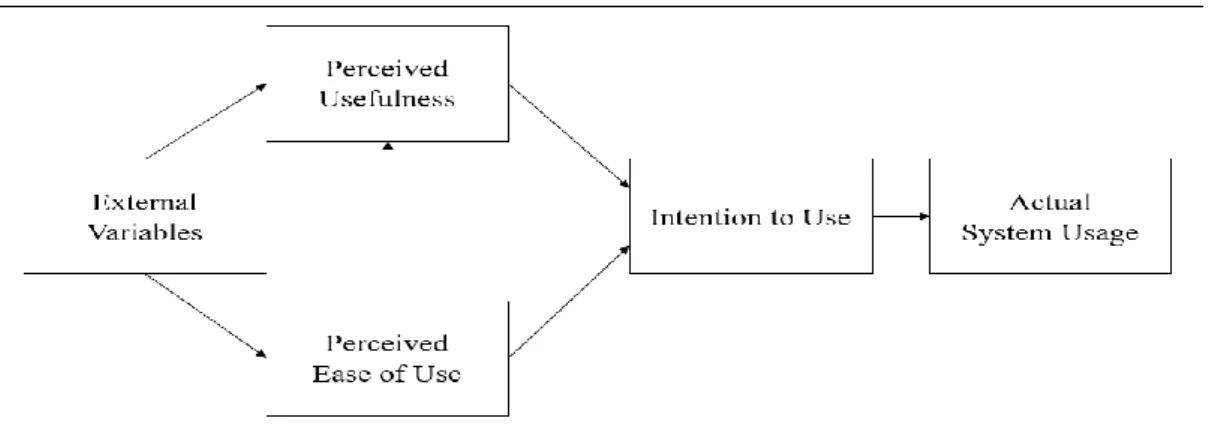
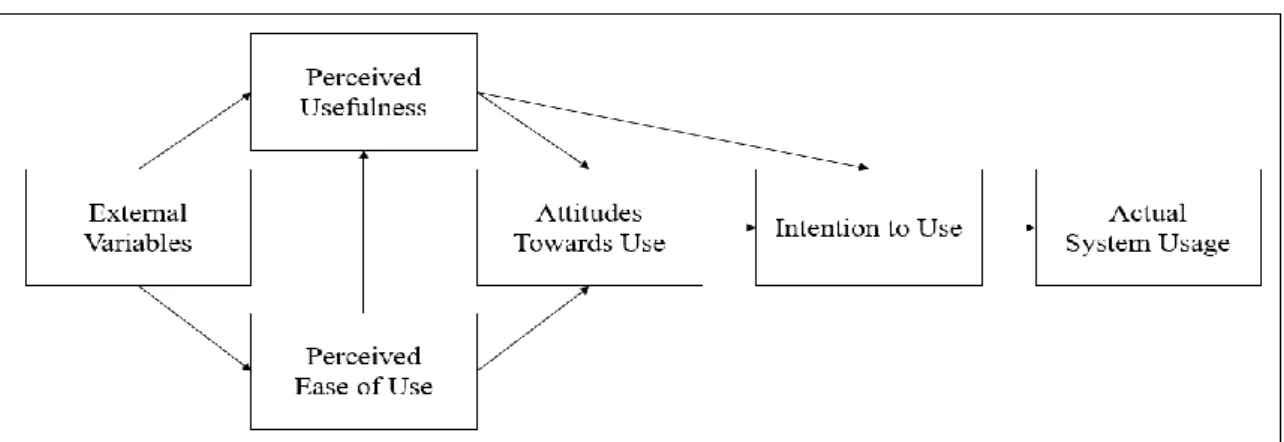
- Technology Acceptance Model (TAM)
- Updated Technology Acceptance Model (TAM)
- Reviews of Variables
- Dependent Variables
- Independent Variables
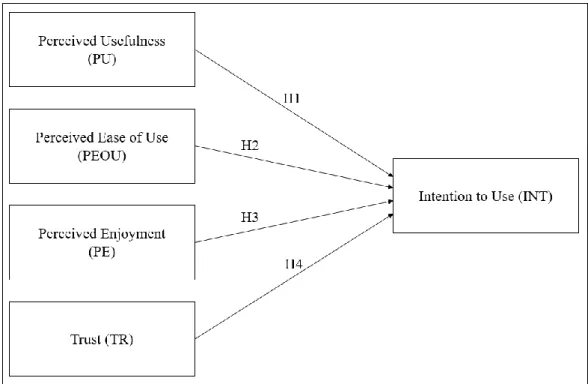
- Proposed Conceptual Framework
- Hypothesis Development
- Relationship between perceived usefulness and intention to use self-
- Relationship between perceived ease of use and intention to use self-
- Relationship between perceived enjoyment (PE) and intention to use
- Relationship between trust and intention to use self-ordering kiosk in
- Conclusion
H2: There is a correlation between perceived ease of use and intention to use a self-order kiosk in a restaurant. H3: There is a correlation between perceived enjoyment and intention to use a self-order kiosk in a restaurant.
METHODOLOGY
- Introduction
- Research Design
- Descriptive Study
- Causal Research
- Quantitative Research
- Data Collection Methods
- Primary Data
- Secondary Data
- Sampling Design
- Target Population
- Sampling Frame and Sampling Location
- Sampling Elements
- Sampling Technique
- Sampling Size
- Research Instrument
- Questionnaire Design
- Pilot Testing
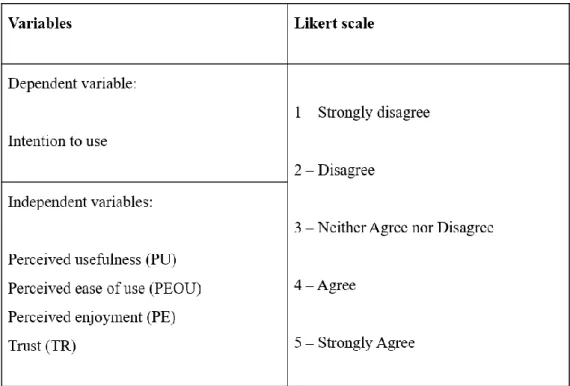
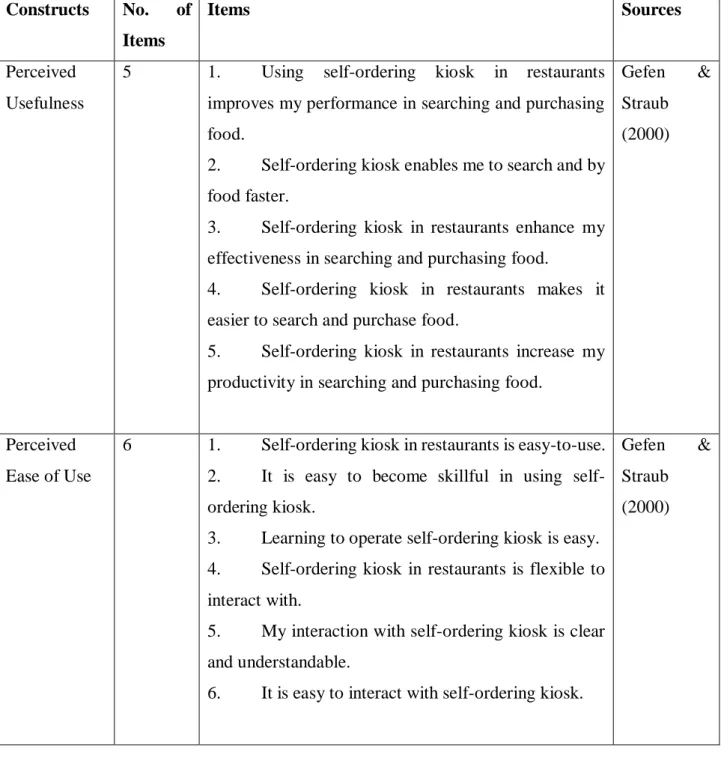
- Construct Measurement
- Scale of Measurement
- Origin of Constructs
- Data Processing
- Questionnaire Checking
- Data Editing
- Data Coding
- Data Transcribing
- Data Cleaning
- Data Analysis
- Statistical Package for the Social Science (SPSS)
- Descriptive Analysis
- Reliability Test
- Inferential Analysis
- Multiple Regression Analysis
- Conclusion
In this study, researcher wants to learn how and why the dependent variable, intention to use self-order kiosk in restaurant, is influenced by various factors. In this research, the samples are Malaysians who have knowledge of self-order kiosk in restaurant. In this research study, the sample size is 320 respondents who have knowledge and ability to order kiosk in restaurant themselves.
In this study, each possible response was assigned a code and all data. In this study, out-of-range or unacceptable data were eliminated. In this study, the Statistical Package for the Social Sciences (SPSS) version 26.0 was used to analyze the quantitative data obtained from the survey.
In this study, the researcher examined factors that influenced the intention to use self-order kiosks in restaurants. Subsequently, the obtained data were described, summarized and presented by applying a descriptive analysis, where the distribution of the values was presented by means of central tendency measurement, dispersion measurement and distribution measurements. forms. In this study, variables such as PU, PEOU, PE and TR were measured to identify which contribute to the intention to use self-order kiosks in restaurants. In this study, the researcher studied the factors influencing the intention to use self-order kiosks in restaurants on a sample of Malaysians and used the obtained statistic to represent the population.
DATA ANALYSIS
Introduction
Survey Distribution and Return Rate
Descriptive Analysis
- Respondents’ Demographic Profile
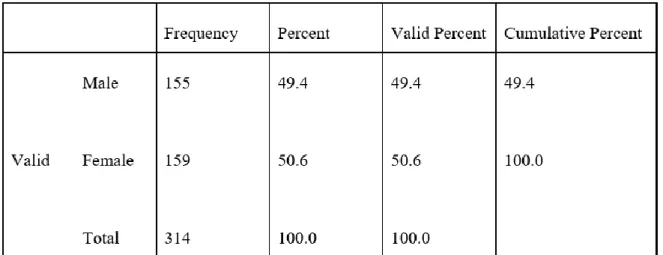
- Gender
- Age
- Education Level
- Working Experience
- Individual Monthly Income
- Frequency of Visiting Restaurant
- Central Tendencies of Constructs
- Intention to Use (INT)
- Perceived Usefulness (PU)
- Perceived Enjoyment (PE)
- Trust (TR)
Based on Table 4.7, “I plan to use the self-order kiosk in restaurants in the future” scores a score of 4.34 for average, which is the highest average. The statement “I plan to make more use of self-order kiosks in restaurants in the future.” The statement 'I plan to regularly use a self-order kiosk in restaurants' scores the lowest average, namely 4.26.
Based on Table 4.8 above, the statement “Self-order kiosks in restaurants make it easier to find and buy food” ranks #1 with an average of 4.28, and the statement “Self-order kiosks in restaurants increase my productivity when searching and buying food.” food' ' ranks lowest among the . In Table 4.9, “Learning to operate a self-order kiosk is easy” is the statement that scored 4.32 for the average and took first place, with 48.7% of selected respondents strongly agreeing. The statement 'Self-ordering kiosk in restaurants is flexible to communicate with' scored the lowest with the lowest average score, 4.17.
Based on Table 4.10, “Using a self-order kiosk is fun” scored the highest average, 4.21, in 1st place, with 43.3% of respondents strongly agreeing with this statement. According to Table 4.11, the statement “I trust the self-ordering kiosk and the transaction performed by the self-ordering kiosk” ranks #1 with the highest average score of 4.31, followed by the statement “I trust the self-ordering kiosk is secure and has reliable characteristics' is second with an average value of 4.29. The statement “I trust a self-ordering kiosk to keep my and my customers' financial information safe” has the lowest average score of 4.05.
Scale Measurement
- Reliability Test
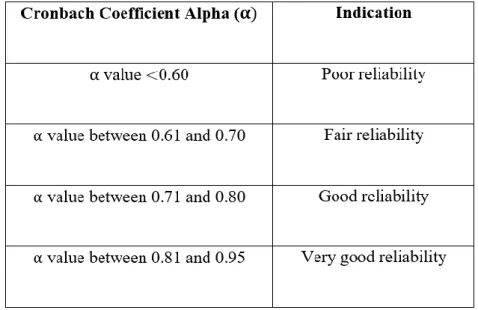
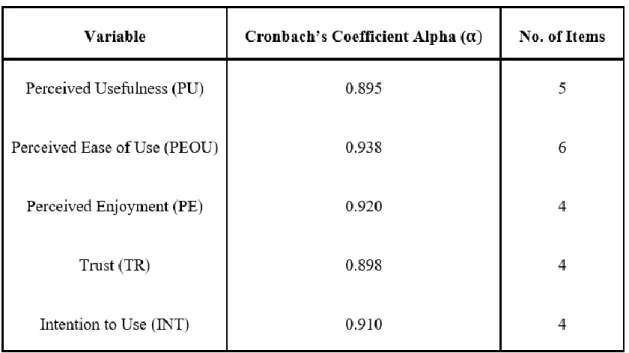
If the Cronbach Alpha value is between 0.61 and 0.70, it can be described as fair reliability, and between 0.71 and 0.80 as good reliability. Based on the table 4.12 above, the reliability statistics presented the reliability of all variables, in which the dependent variable INT reached 0.918, followed by four independent variables including PU, PEOU, PE and TR, respectively 0.874; therefore, all variables are categorized as very good reliability.
Inferential Analysis
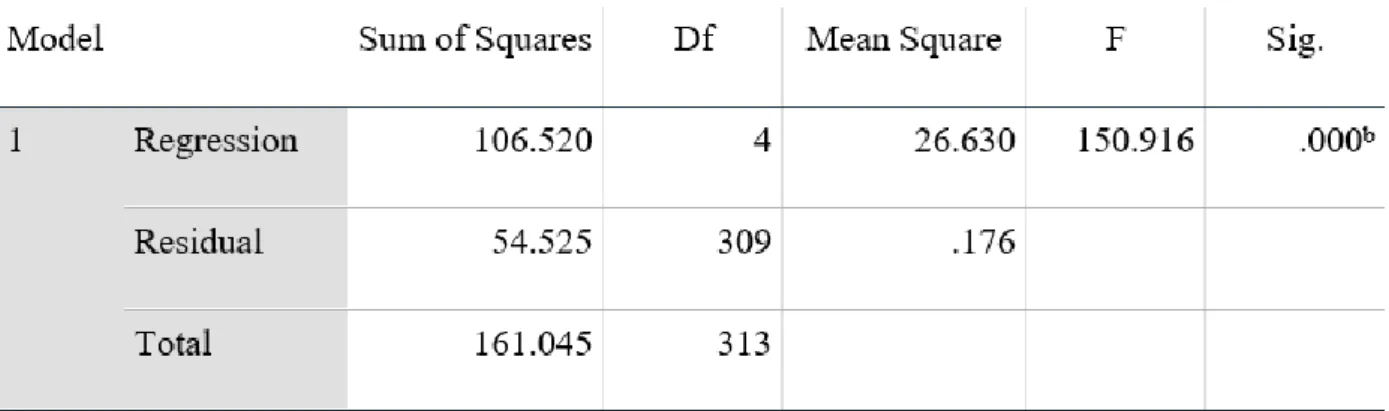
- Multiple Regression
- Test of Significant
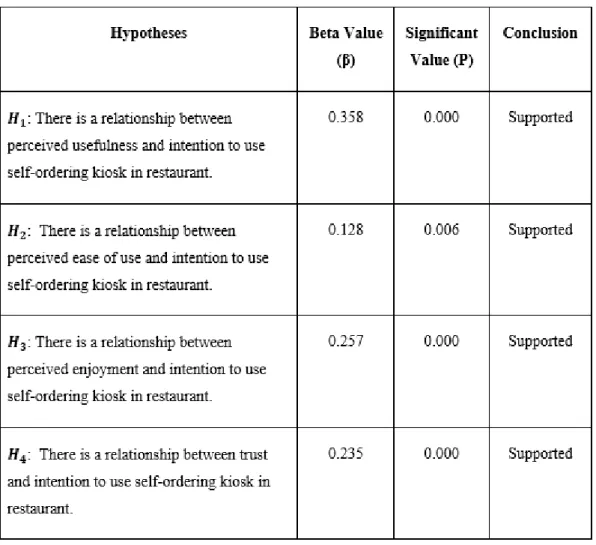
Therefore, based on the result in Table 4.15, it depicted that PU scored 0.358, and it has the strongest effect towards the intention to use self-order kiosk in restaurant, the dependent variable of this research, followed by PE, TR and PEOU, which scored and 0.128 respectively. Also according to Table 4.15 above, the VIF values for PU, PEOU, PE and TR are respectively and 1.833, which all VIF values for each independent variable are lower than 5.0; therefore, it has indicated that all the four independent variables have no multicollinearity problems. 𝐻1: There is a correlation between perceived utility and intention to use a self-order kiosk in a restaurant.
According to table 4.15, 0 is rejected since the P-value of PU has scored 0.000 which is lower than 0.05; therefore, it found that there is a relationship between PU and the intention to use the ordering kiosk in the restaurant. 𝐻1: There is a relationship between perceived ease of use and intention to use the self-ordering kiosk in the restaurant. According to table 4.15, 0 is rejected as the P-value of PEOU is marked as 0.006 which is lower than 0.05; therefore, it is concluded that there is a relationship between PEOU and the intention to use the ordering kiosk in the restaurant.
𝐻1: There is a correlation between perceived enjoyment and intention to use a self-order kiosk in a restaurant. According to Table 4.15, 𝐻0 is rejected as PE's P-value scored 0.000, which is lower than 0.05; therefore, it has concluded that there is a correlation between PE and intention to use a self-order kiosk in a restaurant. According to Table 4.15, 𝐻0 is rejected as TR's P-value scored 0.000, which is lower than 0.05; therefore, it has concluded that there is a correlation between TR and the intention to use a self-order kiosk in a restaurant.
Conclusion
DISCUSSION, CONCLUSION, AND IMPLICATION
Introduction
Discussion of Major Findings
- Perceived Usefulness (PU)
- Perceived Ease of Use (PEOU)
- Perceived Enjoyment (PE)
- Trust (TR)
Based on the research result, it is found that 𝐻1 is supported, which PU is important for the intention to use self-ordering kiosk in restaurants. Davis and Venkatesh's (2000) study also learned that when users find that a technology is useful and effective for them, they will feel satisfied, which can significantly affect the intention to use the innovation technology. 𝐻2: There is a relationship between perceived ease of use and intention to use the self-order kiosk in the restaurant.
Nevertheless, the result of this study is consistent with that of Davis (1989), Davis and Venkatesh (2000), and Singh and Srivastava (2018), which confirmed that PEOU can significantly influence intention to use in TAM. 𝐻3: There is a relationship between perceived pleasure and the intention to use a self-order kiosk in a restaurant. According to the results obtained after analysis, 𝐻3 has been found to be supported as PE has been shown to be important for the intention to use self-order kiosks in restaurants.
Nevertheless, a study by Alalwan et al. 2018) statistically proved that PE can significantly influence usage intention, as innovative technology that can maximize users' sense of pleasure will stimulate users' usage intention. This study resulted in 𝐻4 is supported because the result proved that trust significantly affects the intention to use self-ordering kiosk in restaurants. In addition, Cha (2020) also confirmed that when users perceive an innovative technology such as a self-ordering kiosk in a restaurant to be reliable and trustworthy, it will significantly affect users' intention to use it.
Implications of Study
- Theoretical Implications
- Practical Implications
Based on the results of this study, all the variables (PU, PEOU, PE and trust) have effect on users' intention to use. First, the results of this study have shown that PU is related to intention to use. Based on this study, it statistically showed that PU has the strongest effect on users' intention to use self-order kiosk.
Also, the kiosk company's engineers should always focus on improving the usability of the self-ordering kiosk to further improve its performance. Second, in this study, PEOU also has a relationship with the intention to use self-order kiosks in restaurants. Third, the statistical results of this study have proven that there is a relationship between PE and intention to use.
Therefore, the restaurant owner and design teams are suggested to constantly update the self-order kiosk menu design to ensure that customers always feel interesting and enjoy while ordering food. In addition, adding an audio system to a self-order kiosk can benefit people who have low vision or are blind, as it can help them order food using sound, which can increase their intention to use the self-order kiosk. to make order. Finally, according to the results of this study, it showed that trust is related to intention to use.
Limitations of the Study
Recommendations for Future Research
Conclusion
Factors determining the behavioral intention to use mobile learning: An application and extension of the UTAUT model. The effects of perceived usefulness and perceived ease of use on continued intention to use e-government. Factors influencing customers' intention to use online food delivery services before and during the COVID-19 pandemic.
Determinants of customer satisfaction and willingness to use self-service kiosks in the hotel industry. Extending the TAM model to explore the factors influencing Intention to Use an Online Learning Community. Impact of perceived usefulness, perceived ease of use and perceived enjoyment on intention to shop online.
University students' intention to use e-learning systems: A study of higher education institutions in Sri Lanka. An investigation into the influence of intrinsic motivation on students' intention to use mobile devices in language learning. Understanding behavioral intention to use mobile wallets in Vietnam: extending the tam model with trust and enjoyment.
INT1 I intend to increase my use of self-order kiosks in restaurants in the future. PU1 Using self-order kiosks in restaurants improves my performance in searching and buying food.