INVESTOR ATTENTION AND STOCK MARKET PERFORMANCE DURING COVID-19 PANDEMIC:
EVIDENCE FROM MALAYSIA
CHAN SHU WEN LEE JIA YONG
LEE LI PENG TIU PHEI XIN
BACHELOR OF FINANCE (HONS)
UNIVERSITI TUNKU ABDUL RAHMAN
FACULTY BUSINESS AND FINANCE DEPARTMENT OF FINANCE
APRIL 2021
INVESTOR ATTENTION AND STOCK MARKET PERFORMANCE DURING COVID-19 PANDEMIC:
EVIDENCE FROM MALAYSIA
BY
CHAN SHU WEN LEE JIA YONG
LEE LI PENG TIU PHEI XIN
A final year project summitted in partial fulfilment of the requirement for the degree of the
BACHELOR OF FINANCE (HONS)
UNIVERSITI TUNKU ABDUL RAHMAN
FACULTY BUSINESS AND FINANCE DEPARTMENT OF FINANCE
APRIL 2021
__________________________________________________________________
Undergraduate Research Project ii Faculty of Business and Finance
Copyright @ 2021
ALL RIGHTS RESERVED. No part of this paper may be reproduced, stored in a retrieval system, or transmitted in any form or by any means, graphic, electronic, mechanical, photocopying, recording, scanning, or otherwise, without the prior consent of the authors.
__________________________________________________________________
Undergraduate Research Project iii Faculty of Business and Finance
DECLARATION
We hereby declare that:
(1) This undergraduate Final Year Project is the end result of our own work and that due acknowledgement has been given in the references to ALL sources of information be they printed, electronic, or personal.
(2) No portion of this Final Year Project has been submitted in support of any application for any other degree or qualification of this or any other university, or other institutes of learning.
(3) Equal contribution has been made by each group member in completing the Final Year Project.
(4) The word count of this report is 13,021 words.
Name of student: Student ID: Signature:
1. CHAN SHU WEN 17ABB04015
2. LEE JIA YONG 17ABB03400
3. LEE LI PENG 17ABB02134
4. TIU PHEI XIN 17ABB03564
Date: 5th April 2021
__________________________________________________________________
Undergraduate Research Project iv Faculty of Business and Finance
ACKNOWLEDGEMENT
First of all, we would like to take this opportunity to deliver our utmost gratitude to University Tunku Abdul Rahman (UTAR) for providing us a precious opportunity to conduct this research project. This is a great opportunity for us to enhance our knowledge and experiences that may improve our understanding in the areas that we may participate in the near future. We would like to express our appreciation for the facilities provided by UTAR library to enable us to get information and journal articles that needed for our research.
Besides, we would like to express our special thanks to our supervisor, Mr Lee Chee Long for guiding and giving as a lot of ideas and suggestion on our research. He always presented us with a clear path and advices while we encountered issues or problems. We appreciate his advices and encouragement from beginning until end of our research project. Without his support and guidance, our project will not be done successfully. We sincerely thank Mr Lee for his precious time and effort put on our project. His support and guidance help us a lot in our completion of research project.
Last but not least, we would like to convey our appreciation to our family members, friends, and course mates who giving us support and encouragement in these few months. Most importantly, a great thank you to all the members for paying efforts to accomplish the research. Everyone is important in completing this research project and thank you for the contribution and valuable time by group members in completing this research.
__________________________________________________________________
Undergraduate Research Project v Faculty of Business and Finance
DEDICATION
Dedicated to
Mr Lee Chee Long
Mr Lee Chee Long, our supervisor of this research project for his patient, and valuable guidance and support throughout this research project.
Friends and Family Members
They have given us greatest encouragement and endless support when we conducting this research project.
Future Researchers
Those potential and future researchers who are interested in related topics we hope this research could assist them in the future studies.
__________________________________________________________________
Undergraduate Research Project vi Faculty of Business and Finance
TABLE OF CONTENTS
Page
Copyright Page ...ii
Declaration ...iii
Acknowledgement ...iv
Dedication ...v
Table of Content ...vi-ix List of Tables …...x-xi List of Figures ...xii
List of Abbreviations ...xiii
List of Appendices ...xiv
Preface ...xv
Abstract ...xvi
CHAPTER 1: RESEARCH OVERVIEW ...1
1.1 Research background ...1
1.1.1 COVID-19 Pandemic …...1
1.1.1.1 The Impact of COVID-19 on the Stock Market....2-3 1.1.2 Investor Attention ...4-5 1.1.2.1 Google Search Volume Index (GSVI)...5 1.1.2.2 Trend of Google Search Volume Index (GSVI) on
COVID-19 Related Keywords ...6-7
__________________________________________________________________
Undergraduate Research Project vii Faculty of Business and Finance
1.2 Research Problem ...7-11
1.3 Research Objectives ...12
1.3.1 General Research Objective ...12
1.3.2 Specific Research Objectives ...12
1.4 Research Significance ...13
1.4.1 Investors …...13-14 1.4.2 Policy Makers …...14
1.4.3 Researchers …...15
CHAPTER 2: LITERATURE REVIEW………...…….16
2.0 Introduction …...16
2.1 Underlying Theories …...16
2.1.1 Efficient Market Hypothesis …...16-19 2.1.2 Behavioral Finance Theory …...19-20 2.1.3 Price Pressure Hypothesis …...21-22 2.2 Review of Empirical Results …...23
2.2.1 The Concept and Measurement of Investor Attention....23-25 2.2.2 Investor Attention and Stock Market Return ...25-27 2.2.3 Investor Attention and Stock Volatility …...27-29 2.3 Conclusion ...30
CHAPTER 3: METHODOLOGY ...31
3.0 Research Design………...………31
3.1 Data Collection Methods…...31 3.1.1 Google Search Volume……….…31-32 3.1.2 Stock Market Return & Trading Volume…...32-33
__________________________________________________________________
Undergraduate Research Project viii Faculty of Business and Finance
3.2.3 Analytical Tool – EViews...33
3.2 Empirical Framework …...33-34 3.3. Unit Root Test ...34
3.3.1 Augmented Dickey-Fuller Test (ADF Test) ...34-35 3.3.2 Phillips-Perron Test (PP Test) ...35
3.4 E-GARCH Model …...36
3.5 Diagnosis Checking ...37
3.5.1 Autocorrelation …...37
3.5.2 Normality of Resident Test ...38
3.5.3 Heteroscedasticity ...38-39 3.6 Granger Causality ...39-40 3.7 Impulse Response Function …...40
3.8 Variance Decomposition ...41
CHAPTER 4: DATA ANALYSIS ...42
4.0 Data Collection ...42
4.1 Descriptive Statistics ...42-43 4.2 Unit Root Test ...44
4.2.1 Augmented Dickey-Fuller Test (ADF Test) ...44-45 4.2.2 Phillips-Perron Test (PP Test) ...45-46 4.3 E-GARCH (1,1) Model …...46-47 4.4 VAR Model – Lag Length Selection ...47-48 4.5 Diagnosis Checking …...49
4.5.1 Breusch-Godfrey LM Test ...49-51 4.5.2 Normality Test ...52
__________________________________________________________________
Undergraduate Research Project ix Faculty of Business and Finance
4.5.3 White Heteroscedasticity Test ...53 4.6 Granger Causality Test...53-54 4.7 Impulse Response Function ...54-56 4.8 Variance Decomposition ...56-58 CHAPTER 5: DISCUSSION, CONCLUSION AND IMPLICATIONS ...59 5.1 Discussion on Major Findings ...59-60 5.1.1 Investor Attention and Stock Market Return……...61-62 5.1.2 Investor Attention and Stock Market Volatility ...62-63 5.2 Implications of Study...63-64 5.3 Limitation of Study ...64-65 5.4 Recommendations for Future Research ...65-66 5.5. Conclusion ...66 REFERENCES...67-71 APPENDICES...72-87
__________________________________________________________________
Undergraduate Research Project x Faculty of Business and Finance
LIST OF TABLES
Page
Table 4.1: Descriptive Statistics...42
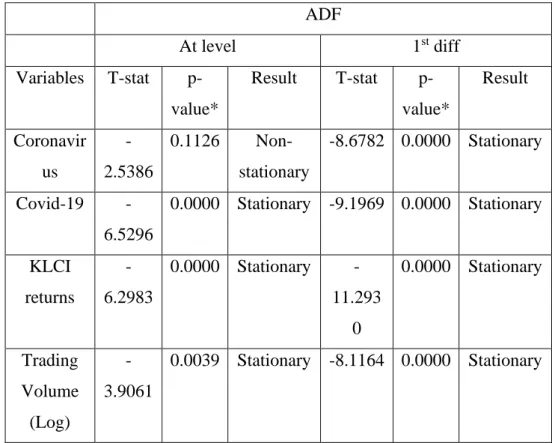
Table 4.2.1: Augmented Dickey-Fuller Test...44
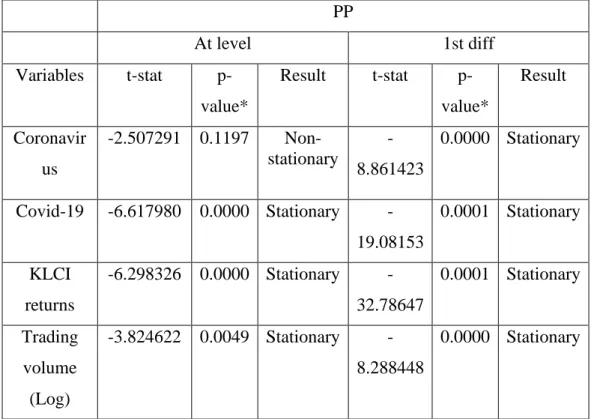
Table 4.2.2: Phillips-Perron Test...45
Table 4.3: E-Garch (1,1) Model...46
Table 4.4(a): KLCI_Return & GSVI_Covid-19 ...47
Table 4.4(b): Log_Trading_Volume & GSVI_Covid-19 ...48
Table 4.4(c): KLCI_Risk & GSVI_Covid-19 ...48
Table 4.5.1(a): LM Test Result: KLCI_Return & GSVI_Covid-19 …...49
Table 4.5.1(b): LM Test Result: Log_Trading_Volume & GSVI_Covid-19……..50
Table 4.5.1(c): LM Test Result: KLCI_Risk & GSVI_Covid-19 …...51
Table 4.5.2: Normality Test Result ...52
Table 4.5.3: White Test Result ...53
Table 4.6: Granger Causality Test ...53
Table 4.8.1: Variance Decomposition of KLCI_Return ...56
Table 4.8.2: Variance Decomposition of Trading_Volume …...57
Table 4.8.3: Variance Decomposition of KLCI_Risk …...57
__________________________________________________________________
Undergraduate Research Project xi Faculty of Business and Finance
LIST OF GRAPHS
Page Graph 4.5.1(a): Model 1: KLCI_Return & GSVI_Covid_19 ...49 Graph 4.5.1(b): Model 2: Trading Volume (Log) & GSVI_Covid_19 ...50 Graph 4.5.1(c): Model 3: KLCI_Risk & GSVI_Covid_19 ...51 Graph 4.7.1: Response of KLCI_RETURN to GSVI_COVID_19 Innovation using Cholesky (d.f. adjusted) Factors ...54 Graph 4.7.2: Response of TRADING_VOLUME_ to GSVI_COVID_19 Innovation using Cholesky (d.f. adjusted) Factors ...55 Graph 4.7.3: Response of KLCI_RISK to GSVI_COVID_19 Innovation using Cholesky (d.f. adjusted) Factors ...55
__________________________________________________________________
Undergraduate Research Project xii Faculty of Business and Finance
LIST OF FIGURES
Page Figure 1.1: Weekly FTSE Bursa Malaysia Trading Volume in Year 2020 ...3 Figure 1.2: Weekly FTSE Bursa Malaysia KLCI Return in Year 2020 …...3 Figure 1.3: Weekly Google Search Volume Index on Keywords “COVID-19” and
“Coronavirus” in Malaysia (Investing Category) ...7 Figure 1.4: The Relationship between Weekly KLCI Return and Weekly Google Search Volume Index (GSVI) on Keyword “COVID-19” in Year 2020 ...9 Figure 1.5: The Relationship between KLCI Return and Google Search Volume Index (GSVI) on Keyword “Coronavirus” in Year 2020 ...9 Figure 1.6: The Relationship between Bursa Malaysia Trading Volume and Google Search Volume Index (GSVI) on Keyword “COVID-19” from January to August, 2020 ………...10 Figure 1.7: The Relationship between Bursa Malaysia Trading Volume and Google Search Volume Index (GSVI) on Keyword “Coranavirus” in Year 2020………...10
__________________________________________________________________
Undergraduate Research Project xiii Faculty of Business and Finance
LIST OF ABBREVIATIONS
CMCO Conditioned Movement Control Order EMH Efficient Market Hypothesis
GSVI Google Search Volume Index IRF Impulse Response Function KLCI Kuala Lumpur Composite Index RMCO Recovery Movement Control Order WHO World Health Organization
__________________________________________________________________
Undergraduate Research Project xiv Faculty of Business and Finance
LIST OF APPENDICES
Page
Appendix 4.1: Descriptive statistics...72
Appendix 4.2.1: Augmented Dickey-Fuller test ...73-75 Appendix 4.2.2: Phillips-Perron test ...75-77 Appendix 4.3: E-Garch Model …...78
Appendix 4.4(a): KLCI_Return & GSVI_Covid-19 ...78
Appendix 4.4(b): Log_Trading_Volume & GSVI_Covid-19 …...79
Appendix 4.4(c): KLCI_Risk & GSVI_Covid-19 ...79
Appendix 4.5.1(a): LM Test Result: KLCI_Return & GSVI_Covid-19 …...80
Appendix 4.5.1(b): LM Test Result: Log_Trading_Volume & GSVI_Covid-19...80
Appendix 4.5.1(c): LM Test Result: KLCI_Risk & GSVI_Covid-19 ...81
Appendix 4.5.2: Normality Jarque-Bera Test …...81-83 Appendix 4.5.3: White Heteroscedasticity Test …...83-84 Appendix 4.6: Granger Causality Test …...85-86 Appendix 4.8.1: Variance Decomposition of KLCI_Return ...86
Appendix 4.8.2: Variance Decomposition of Trading_Volume …...87
Appendix 4.8.3: Variance Decomposition of KLCI_Risk …...87
__________________________________________________________________
Undergraduate Research Project xv Faculty of Business and Finance
PREFACE
Investor attention is a scarce resource; investor have limited attention to focus on huge amount of the financial information. The new era of technology provides a faster way to access the information globally. Due to the rapid flow of information, investor is more likely to pay attention on the stocks information that grabs their attention. In this study, our aim is to study the attention of investor during the Covid- 19 pandemic in Malaysia as Covid-19 is the first financial crisis contributed by the pandemic in history. Our study is focus on FTSE Bursa Malaysia KLCI stock market performance in the whole year 2020. Meanwhile, the Google Search Volume Index (GSVI) is used in our study as an indicator for investor attention.
Thus, our study will focus on the impacts on investor attention towards the FTSE KLCI stock return, trading volume and stock return volatility. Thereby, our study aims to provide significant information and direction for future study towards Malaysia stock market.
__________________________________________________________________
Undergraduate Research Project xvi Faculty of Business and Finance
ABSTRACT
In this research, we indicate the relationship of investor attention proxied by Google Search Volume Index (GSVI) and Malaysia Stock Market Performance on Covid- 19 pandemic. Since the Covid-19 pandemic is a new phenomenon, it has led to the first financial crisis contributed by the pandemic in history. In this study, search queries of “Coronavirus” and “Covid-19” is indicated. Results revealed that keyword “Coronavirus” has no insignificant results to the Kuala Lumper Composite Index (KLCI) performance and keyword “Covid-19” is tested to be significant to indicate the relationship between investor attention and the Malaysia stock market performance. To indicate the validity of the regression model, various test like Augmented Dickey-Fuller test, Philips-Perron test, Breusch-Godfrey LM test, Jacque-Bera test, White heteroscedasticity test has been carried out in this research project. The results had revealed that the model have no existence of unit root, autocorrelation and heteroscedasticity problems in the model and the error term is normally distributed. Granger causality test has been carried out and results that three dependent variables have no granger causal relationship with GSVI Covid-19.
To indicate the short and long run effect on the model, Impulse Response Function has been carried out and proven that there have no impacts on the both short and long runs between the dependent variables and GSVI Covid-19. This study found out that insignificant relationship between investor attention proxied by GSVI with stock market return and stock market volatility. The empirical results support efficient market hypothesis (EMH) which stated that the Malaysian stock market is efficient and hence, there is no arbitrage opportunities for investors since stock prices fully reflect all information.
_______________________________________________________________________________
Undergraduate Research Project Page 1 of 87 Faculty of Business and Finance
CHAPTER 1: RESEARCH OVERVIEW
1.1 Research Background
1.1.1 COVID-19 Pandemic
The COVID-19 pandemic is a multidimensional phenomenon, not only from the medical dimension, but also from the financial aspect. Initiated in Wuhan, Hubei Province of China, the COVID-19 outbreak has led to the first financial crisis contributed by the pandemic in history. The COVID-19 pandemic has then spread rapidly to other countries including Singapore, Italy, USA and UK (Elengoe, 2020). Due to the severity and alarming levels of spread, the World Health Organization (WHO) announced the COVID- 19 as pandemic on 11 March 2020 (The World Health Organization, 2020).
As of 30 December 2020, the COVID-19 has caused over 1.8 million deaths worldwide (Worldometer, 2021). On 24 January 2020, Malaysia recorded the first case of COVID-19 while in year 2020 alone, Malaysia recorded 113,010 confirmed cases of COVID-19 and 471 death cases (Ng, 2020;
Worldometer, 2021).
_______________________________________________________________________________
Undergraduate Research Project Page 2 of 87 Faculty of Business and Finance
1.1.1.1 The Impact of COVID-19 on the Stock Market
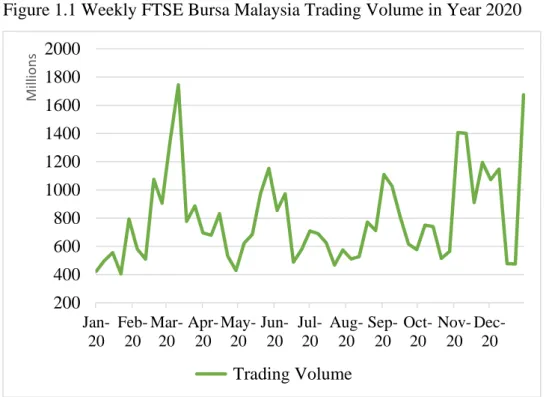
During the crisis, the stock market has been experienced one of the greatest volatilities in the history (Baker et al., 2020). Major indices such as the S&P 500 Index and the Dow Jones Industrial Average have plunged sharply and recorded its lowest point since 2008. Asia-Pacific stock markets such as Nikkei 225 has also fell more than 20% amid coronavirus fear while the European stock markets drop by around 11%. Meanwhile, the trading volume in Bursa Malaysia has reached its highest record in history. As shown in figure 1.1, Bursa Malaysia trading volume reached a new-time high, recorded 6.61 billion shares traded in April 2020 (The Edge Market, 2020). The high record of trading volume maintained throughout the year.
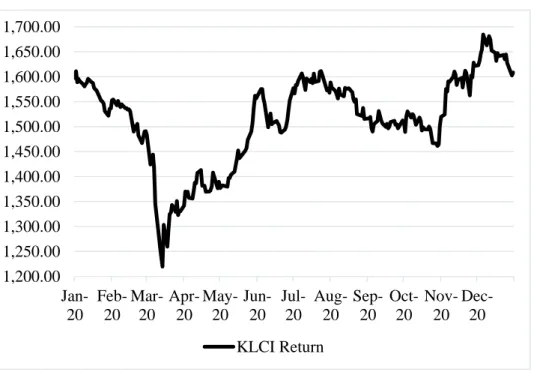
Amid the heavy trading volume, the FTSE Bursa Malaysia KLCI return dropped to its lowest point after 11 years in March, recorded less than 1250.00 as shown in figure 1.2. The massive losses in the market are believed to be influenced by the investors fear due to the movement control order and losses on key index such as Genting Berhad (Bernama, 2020).
The KLCI return then gradually rose to more than 1,500.00 return at the beginning of June but the index dropped again at the end of the year amid the coronavirus fear.
_______________________________________________________________________________
Undergraduate Research Project Page 3 of 87 Faculty of Business and Finance
Figure 1.1 Weekly FTSE Bursa Malaysia Trading Volume in Year 2020
Source: MarketWatch
Figure 1.2 Weekly FTSE Bursa Malaysia KLCI Return in Year 2020
Source: MarketWatch 200
400 600 800 1000 1200 1400 1600 1800 2000
Jan- 20
Feb- 20
Mar- 20
Apr- 20
May- 20
Jun- 20
Jul- 20
Aug- 20
Sep- 20
Oct- 20
Nov- 20
Dec- 20
Millions
Trading Volume
1,200.00 1,250.00 1,300.00 1,350.00 1,400.00 1,450.00 1,500.00 1,550.00 1,600.00 1,650.00 1,700.00
Jan- 20
Feb- 20
Mar- 20
Apr- 20
May- 20
Jun- 20
Jul- 20
Aug- 20
Sep- 20
Oct- 20
Nov- 20
Dec- 20 KLCI Return
_______________________________________________________________________________
Undergraduate Research Project Page 4 of 87 Faculty of Business and Finance
1.1.2 Investor Attention
According to Baker et al. (2020), the extreme fluctuations that have been experienced by the stock markets is probably due to the rapid information flows during the COVID-19 pandemic. During the pandemic, the investor attention towards the COVID-19 related information have risen sharply.
This investor attention brings impact to the stock market and this is proven by the previous studies (Tan & Tas, 2018; Zhang et al., 2020; Iyke & Ho, 2021; Ekinci & Bulut, 2021). In fact, it can be related to the efficient market hypothesis (EMH). In EMH, it is assumed that the stock prices incorporate and reflect all available information including news in an instantaneous way.
Therefore in this hypothesis, it is assumed that the market is efficient and hence, the COVID-19 related news are all reflected on the Malaysia stock market. In the EMH, the investors are also assumed to be rational when responding to the COVID-19 related news. Therefore, when EMH is applied in the case of investor attention, it suggests that the stock market volatilities can be figured out by looking into the internet searches as it serves as the reflection of investor attention. The internet searches enhance the speed of information dissemination among individual investors and thus, helping investors to make more accurate investment decisions.
However, investor attention is a scarce resource and it is a constraint (Barber
& Odean, 2008; Da et al., 2009; Kahneman, 1973). According to Chen and Yu (2013), attention is a cognitive process at which an individual is focusing on a subject but ignoring other subjects. The investor attention is constrained especially to the individual investors. This is due to individual investors have less access to professional information sources such as Bloomberg compared to institutional investors. Therefore, searching for information on the internet becomes the direct tool for individual investors to gain information. However, internet searches produce large amount of information and this is difficult for the investors to produce all information.
_______________________________________________________________________________
Undergraduate Research Project Page 5 of 87 Faculty of Business and Finance
From the aspect of behavioral finance, it is found that the investors are irrational and tend to be affected by some psychological and emotional biases when making investment decisions. According to Barber & Odean (2008), investors have the tendency to buy the stocks that are attention- grabbing among large amount of stock available. In this case, information search query about the particular keywords clearly reflects that the person is paying attention to that subject. Therefore, investor attention becomes one of the variables which is correlated to the stock market movement.
1.1.2.1. Google Search Volume Index (GSVI)
With the rising of information technology and social media, the internet becomes one of the fundamental pathways of individual investors to obtain financial information. Nowadays, online platforms such as Google, Yahoo and Baidu have been highly utilized by investors to obtain financial information. Among them, Google is the most used in Malaysia and it owns 98.57% of search engine market share in Malaysia, compared to bing (0.88%), Yahoo (0.44%), DuckDuckGo (0.05%), Baidu (0.02%) and Ecosia (0.01%) (StatCounter. 2020). Therefore, Google is taken as the direct measure of investor attention in Malaysia. In fact, Google search volume is used as the indicator of investor attention in many previous studies done (Joseph, Wintoki, & Zhang, 2011; Mondria & Wu, 2011; Preis, Moat, &
Stanley, 2013; Vozlyublennaia, 2014). Therefore in this study, we attempt to look into the investor attention through the lens of Google search volume index (GSVI).
_______________________________________________________________________________
Undergraduate Research Project Page 6 of 87 Faculty of Business and Finance
1.1.2.2 Trend of Google Search Volume Index (GSVI) on COVID-19 Related Keywords
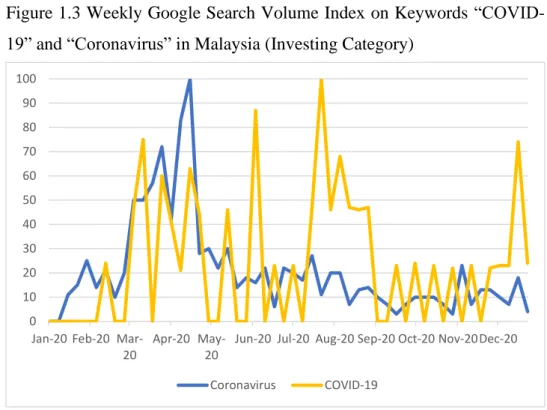
As shown in figure 1.3, the weekly Google search volume index (GSVI) on the keyword “Coronavirus” in Malaysia has started to increase since January. The GSVI reached its peak at April with the scale of 100 and gradually decreased through the year 2020. Meanwhile, the GSVI on the keyword “COVID-19” started to increase since February, which is after the announcement on the official name of the coronavirus disease 2019 with the abbreviation of COVID-19 by the World Health Organization (Centers for Disease Control and Prevention, 2020). After the announcement of the implementation of the Movement Control Order (MCO) on 18 March 2020, the GSVI spiked to the scale of 75. It then reached its peak with the scale of 100 at July. Between March and July, the trends of GSVI on the keyword
“COVID-19” has been fluctuating significantly. After rocketing to the peak at July, the trend of GSVI on the keyword “COVID-19” then show a downward trend, but it climbs to the scale of 75 again at the end of the year 2020. During the early stage of the COVID-19 outbreak, the keyword
“Coronavirus” is highly searched in the Google search engine but the searching trend of keyword “COVID-19” surpassed it after the coronavirus was officially named.
_______________________________________________________________________________
Undergraduate Research Project Page 7 of 87 Faculty of Business and Finance
Figure 1.3 Weekly Google Search Volume Index on Keywords “COVID- 19” and “Coronavirus” in Malaysia (Investing Category)
Source: Google Trends
1.2 Research Problem
During the COVID-19 outbreak, the FTSE Bursa Malaysia KLCI returns has been going through significantly high volatilities. The Bursa Malaysia trading volume has reached all time high records amid the outbreak. The extreme volatility in the Malaysian stock market is significantly high compared to other emerging markets.
Therefore, Malaysia is a good research focus to study the impact of COVID-19 attention on the stock market performances. According to Nguyen et al. (2019), the Google search volume have potentials to impact the stock market performances in emerging markets such as Thailand, Vietnam and Malaysia indirectly. By comparing the trends between KLCI return, Bursa Malaysia trading volume and Google search volume index, it is found out that the stock market return and volatility in Malaysia vary depend on the investor attention.
0 10 20 30 40 50 60 70 80 90 100
Jan-20 Feb-20 Mar- 20
Apr-20 May- 20
Jun-20 Jul-20 Aug-20 Sep-20 Oct-20 Nov-20Dec-20 Coronavirus COVID-19
_______________________________________________________________________________
Undergraduate Research Project Page 8 of 87 Faculty of Business and Finance
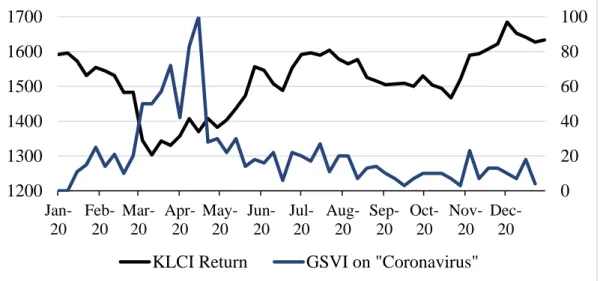
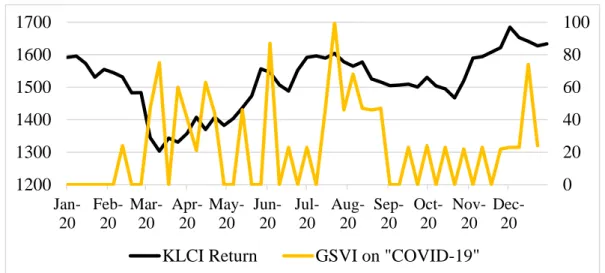
As shown in the figure 1.5, the KLCI return recorded the lowest point when the GSVI on “Coronavirus” is at its highest point in March. For the months following, the GSVI on “Coronavirus” shows a downward trend while the KLCI return shows an overall upward trend. It is clearly shown that the movement of the KLCI return and the GSVI on “Coronavirus” is on opposite direction. The downward trend of GSVI on the keyword “Coronavirus” might be due to the announcement of official name of “COVID-19” on March. The keyword “COVID-19” then becomes the new keyword that is highly searched. On the other side, the correlation between the GSVI on “COVID-19” and the KLCI return shown positive relationship despite some fluctuation amid the months. In figure 1.4, the KLCI return recorded the lowest point when the GSVI on “COVID-19” spike to the first new high point in March. The trends of GSVI on “COVID-19” and the KLCI return then shown positive relationship for the following months.
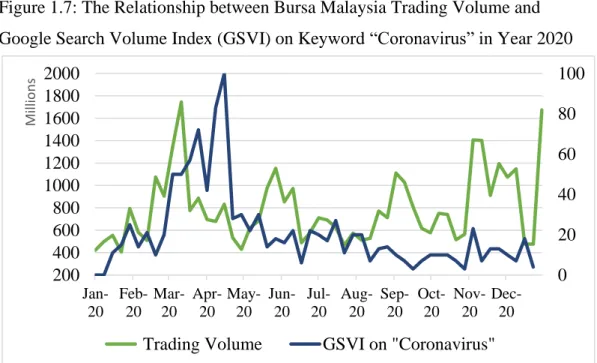
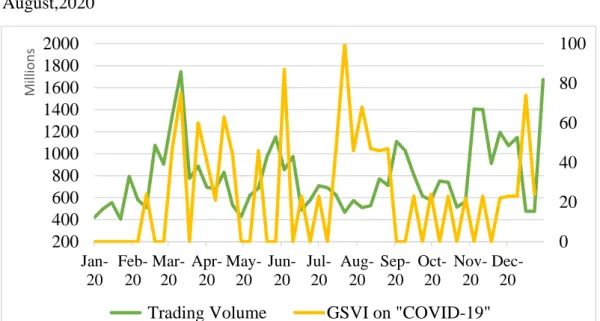
From the point of view of Bursa Malaysia trading volume, it is shown that the Bursa Malaysia trading volume increases when the GSVI on “COVID-19” and
“Coronavirus” increases. As shown in the figures 1.6 and 1.7, when the GSVI on
“COVID-19” rises sharply, the Bursa Malaysia trading volume reached a high point as well. After that, both Bursa Malaysia trading volume and GSVI on “COVID-19”
show decreasing trends. Meanwhile, the relationship between the GSVI on
“Coronavirus” and the Bursa Malaysia trading volume shows the similar trends.
During the first three months in 2020, the Bursa Malaysia trading volume shown an increasing trend when the GSVI on “Coronavirus” gradually increases. In short, the chart portraits that the GSVI on “COVID-19” and “Coronavirus” and Bursa Malaysia trading volume move in the same direction.
The positive correlations between the GSVI on keywords “COVID-19” and
“Coronavirus” could be explained by the efficient market hypothesis (EMH). This is due to the keywords “COVID-19” and “Coronavirus” become good news when the news of COVID-19 vaccine was announced, and this brings new hopes to the
_______________________________________________________________________________
Undergraduate Research Project Page 9 of 87 Faculty of Business and Finance
investors. The stock market has incorporated this good news and hence, bringing positive impacts on the stock market.
Figure 1.4: The Relationship between Weekly KLCI return and Weekly Google Search Volume Index (GSVI) on Keyword “COVID-19” in Year 2020
Source: MarketWatch and Google Trends
Figure 1.5: The Relationship between KLCI Return and Google Search Volume Index (GSVI) on Keyword “Coronavirus” in Year 2020
Source: MarketWatch and Google Trends
0 20 40 60 80 100
1200 1300 1400 1500 1600 1700
Jan- 20
Feb- 20
Mar- 20
Apr- 20
May- 20
Jun- 20
Jul- 20
Aug- 20
Sep- 20
Oct- 20
Nov- 20
Dec- 20 KLCI Return GSVI on "COVID-19"
0 20 40 60 80 100
1200 1300 1400 1500 1600 1700
Jan- 20
Feb- 20
Mar- 20
Apr- 20
May- 20
Jun- 20
Jul- 20
Aug- 20
Sep- 20
Oct- 20
Nov- 20
Dec- 20 KLCI Return GSVI on "Coronavirus"
_______________________________________________________________________________
Undergraduate Research Project Page 10 of 87 Faculty of Business and Finance
Figure 1.6: The Relationship between Bursa Malaysia Trading Volume and Google Search Volume Index (GSVI) on Keyword “COVID-19” from January to August,2020
Source: Yahoo Finance and Google Trends
Figure 1.7: The Relationship between Bursa Malaysia Trading Volume and Google Search Volume Index (GSVI) on Keyword “Coronavirus” in Year 2020
Source: MarketWatch and Google Trends
0 20 40 60 80 100
200 400 600 800 1000 1200 1400 1600 1800 2000
Jan- 20
Feb- 20
Mar- 20
Apr- 20
May- 20
Jun- 20
Jul- 20
Aug- 20
Sep- 20
Oct- 20
Nov- 20
Dec- 20
Millions
Trading Volume GSVI on "COVID-19"
0 20 40 60 80 100
200 400 600 800 1000 1200 1400 1600 1800 2000
Jan- 20
Feb- 20
Mar- 20
Apr- 20
May- 20
Jun- 20
Jul- 20
Aug- 20
Sep- 20
Oct- 20
Nov- 20
Dec- 20
Millions
Trading Volume GSVI on "Coronavirus"
_______________________________________________________________________________
Undergraduate Research Project Page 11 of 87 Faculty of Business and Finance
The FTSE Bursa Malaysia KLCI returns has experienced extreme fluctuations during the pandemic. The past study done by Padungsaksawasdi et al. (2019) linked the stock volatilities to the search volume index and the stock volatilities. Therefore, it is important to find that whether there are associations between the Bursa Malaysia trading volume and GSVI on “Coronavirus” and “COVID-19” and between the KLCI return and the GSVI on “Coronavirus” and “COVID-19”.
However, there is still a lack of studies to look into the impact of investor attention on the Malaysian stock market during pandemic. Hence in this dissertation, the relationship between investor attention and the Malaysia stock market performance is investigated. The stock market performance is measured in terms of return, volatility and trading volume by referring to the FTSE Bursa Malaysia KLCI.
Meanwhile, investor attention is indicated by the Google Search Volume Index (GSVI).
_______________________________________________________________________________
Undergraduate Research Project Page 12 of 87 Faculty of Business and Finance
1.3 Research Objectives
1.3.1 General Research Objective
To investigate the relationship between investor attention and stock market performance in Malaysia.
1.3.2 Specific Research Objectives
i. To study the influence of COVID-19 attention on the stock market return in Malaysia.
ii. To investigate the impact of COVID-19 attention on the stock market volatility in Malaysia.
iii. To study the relationship between the COVID-19 attention and the Bursa Malaysia trading volume.
_______________________________________________________________________________
Undergraduate Research Project Page 13 of 87 Faculty of Business and Finance
1.4 Research Significance
Our dissertation contributes to the growing body of literature in investigating the impact of investor attention on the Malaysian stock market during COVID-19 pandemic. Since the COVID-19 pandemic is quite a new phenomenon, there is a lack of studies to investigate the investors’ behaviour on investment decisions during this health crisis. Also, although there are lots of studies done previously in investigating the behavioural finance during the financial crisis in countries like US and China, there are still a lack of studies to investigate the impact of investor attention on the stock market performance in Malaysia. Malaysia is chosen in this study as the Bursa Malaysia has recorded one of its highest trading volumes during the COVID-19 pandemic. This shows that investor attention has been reflected in the volatility of the stock market compared to other emerging markets. Therefore, Malaysia is suitable to be studied on the impact of COVID-19 attention on its stock market.
1.4.1 Investors
From this study, investors will understand the impact of the investor attention on the stock market and thus, used it as an efficient indicator to predict the stock market movement in future. By analysing the trends of the investor attention on the stock market, investors can tailor their investment strategy when setting up a portfolio. For example, a past study done by Iyke and Ho (2021) shows that there is a positive relationship between investor attention and the stock return in Botswana, Zambia and Nigeria but there is a negative relationship between investor attention and the stock return in Tanzania and Ghana. This indicates that the investor attention might to be used as the hedging instrument in a portfolio by analysing the investor
_______________________________________________________________________________
Undergraduate Research Project Page 14 of 87 Faculty of Business and Finance
attention. In short, this study is helpful to investor in making timing selection when making investments in the stock market.
1.4.2 Policy makers
The results of this study will be a useful reference for policy makers and regulators such as the Securities Commission (SC) to supervise and to monitor the stock market from the impact of crisis. By tracking the trends of the investor attention, the policy makers and government can maintain the financial market vulnerabilities by imposing relevant regulations as response to the crisis. For example, the Securities Commissions has suspended the activities of short selling from March 2020 until the end of year 2020, in order to minimize the stock market volatilities from the impact of COVID-19 pandemic (The Star, 2020). Therefore, the results of study can contribute to the regulators and governments to respond to the uncertainties resulted from the crisis. This is important to ensure the stability and the soundness of the stock market yet, strengthening the financial market in the loss-absorbing capacity during crisis (Couppey- Soubeyran, 2010).
_______________________________________________________________________________
Undergraduate Research Project Page 15 of 87 Faculty of Business and Finance
1.4.3 Researchers
From the behavioral finance aspect, the results of this study will be helpful to researchers by giving them more insight into the influence of investor attention on the stock market performance. According to Smales (2021), it is found out that when the there is a negative relationship between investor attention and stock returns but positive relationship with the price volatility.
However, the study done by Iyke and Ho (2021) shows that there is a positive relationship between investor attention and the stock return in Ghana and Tanzania. These 2 studies shown completely different results and hence, this study which is focus in Malaysia may give future researches more understandings on the role of investor attention on the stock market performances.
_______________________________________________________________________________
Undergraduate Research Project Page 16 of 87 Faculty of Business and Finance
CHAPTER 2: LITERATURE REVIEW
2.0 Introduction
In this chapter, we focus on the underlying theories and review of empirical results.
Literature review can be defined as the topic that has been released by accepted researchers previously. Enormous research had been studies and the past studies enable us to perform our research. This chapter will be discussed to few theories which related to our research topic. The independent variable is investor attention, as proxied by Google Search Volume Index (GSVI) on keyword “COVID-19” and
“Coronavirus”. The dependent variables are stock market return and stock market volatility by referring to the FTSE Bursa Malaysia Kuala Lumpur Composite Index (KLCI) in Malaysia.
2.1 Underlying Theories
2.1.1 Efficient Market Hypothesis
Efficient market hypothesis (hereafter EMH) is one of the traditional financial theory that developed by Eugene Fama. The concept of this theory is reported that share or security prices in financial market is fully affected by all the relevant information (Fama, 1970). The price of securities is fair when the capital is efficient. In the EMH, investors are assumed as rational people in financial market. This efficient market theory is also known as Random Walk Theory. According to Kisaka (2015), random walk is a
_______________________________________________________________________________
Undergraduate Research Project Page 17 of 87 Faculty of Business and Finance
financial theory suggests that the past movement of stock prices or market is impossible to predict the future movement of stock prices and believes that the stock market prices are random.
Fama (1970) identified weak form, semi-strong form and strong form are the three forms of market efficiency measurement. According to Nada (2013), in weak form efficiency, the author stated that the security prices fully reflect all available past information. Such examples of the past information are the prices, trading volume, past financial report, news, stories of the company etc. If such information were accessed by people, then weak form market is said to be efficient. However, Nada presented that there is no chance to have arbitrage opportunities or profits for investors by just referring to such historical information. Hence, the outdated information would be useless to an analyst due to the historical prices are reflected in current prices, but not future prices. The explanation for weak form market efficiency is similar known as the random walk theory since random walk theory defined that the stock price movements are unpredictable.
In semi-strong form efficiency, Nada (2013) pointed that all publicly available information (historical and current) is incorporated in the stock prices. Not only the past data, but everyone can also access to the current or new information. However, individual investor is also no chance to earn superior returns in semi-strong form efficient market, and this argument also supported by Subash (2012). This is because that information already been affecting the stock prices. For example, the public announcements of balance sheet, income statements, dividends, earnings, stock split and so on can result in the changing of stock prices.
_______________________________________________________________________________
Undergraduate Research Project Page 18 of 87 Faculty of Business and Finance
In strong form of EMH, scholars proposed all available, public and private information are incorporated in the security prices. There is assumption that the private information is less important because the inside information would not much more help in making higher returns for investors (Subash, 2012). Strong form is difficult to accept and market cannot be completely efficient, and the actual financial markets relatively supports the weak and semi-strong forms (Nada, 2013).
Past researcher, Smales (2021) have examined the available information influence the security prices. The EMH is applied in the case of investor attention. Attention is known to play an important role in investors learning and trading behaviours. By testing EMH, Smales indicates the negative relationship between GSVI and global stock returns during the pandemic crisis. Besides, Smales found a positive relationship in GSVI to the stock volatility. Evidence proved that a high speed of information dissemination causes the number of internet searches increase, and people are rational to be more attentive to the news event. Eventually, it induces a price response and higher return volatility.
However, few scholars examined there is problem and limitation with EMH.
Barber & Odean (2008) and Kahneman (1973) found out attention is a scarce cognitive resource. Also, Yung & Nafar (2017) and Nada (2013) said that investors have bounded rationality, which means investors is limited by the information they have. They reported that individuals have limited attention to produce with the massive information. Therefore, investors are suggested go for the stocks that can grab their attention. Moreover, study done by Bui & Nguyen (2019) documented that individual investors are having difficulty to come up with an optimal choice by analysing hundreds of stocks in full details. Arguments above can be concluded that the stock prices may not immediately adjust to reflect its true value. Hence, investor
_______________________________________________________________________________
Undergraduate Research Project Page 19 of 87 Faculty of Business and Finance
attention and stock market performance by testing EMH might be not significant related.
2.1.2 Behavioral Finance Theory
From the past to the present, financial economists started to assume that investors are irrational and normal in the financial environment. Hence, behavioral finance came into picture. The behavioral finance is interaction between financial activity and psychology. This theory claims that investors propensity to have some psychological effects and emotional biases on financial decision making and on financial market. The response reactions to the new information and good-bad news can be explained by this theory.
Findings pointed that the psychologic factors would make changing in the stock price (Nada, 2013; Subash, 2012 and Yildirim, 2017).
Behavioral finance focuses on limited cognitive person rather than cognitive person. The limited cognitive person is influenced by psychologic bias when they are making investment decision from the massive information. The related psychologic bias leads investors to have irrational behaviour (Yildirim, 2017; Subash, 2012). One example of the irrational behaviour is representativeness. Representativeness described the individuals make judgements based on the similarity of an event to predict the occurrence of an event, as they are trying to avoid uncertainty issue arises. It can be useful when people are trying to make a quick decision, but the limitation for this is it would lead to close-mindedness. In the study of Yildirim said that investors pay attention to averaged success of security in that moment and they are willing to buy the security that moment. In that moment, they do not consider long run income for security and no desire to invest in security which have a good long-term performance.
_______________________________________________________________________________
Undergraduate Research Project Page 20 of 87 Faculty of Business and Finance
Yildirim and Subash also pointed the herding behaviour is another example of irrational behaviour. Herding behaviour can be explained by information cascade. It suggests that investors believe other people’s choices are optimal level. Investors ignore their own preference and their own personal knowledge, then will implement others’ opinion or decision. It occurs when there is a lack of information, fear of reputation and wage levels etc.
Investor is easier to accept a good attention from others and continue to spread the information via online. Investors are then willing to invest in the securities which support by other people’s choices. Hence, this can be linked to the herding behaviour make high trading volume in stock market, then causes higher volatility, and therefore increase in investor attention.
Other than that, overconfidence, avoidance of regret etc. known as the examples of irrational behaviour which significant to study as the related psychologic bias might impact on the stock market performance, evidence proven by the study of (Nada, 2013; Subash, 2012 and Yildirim, 2017).
People with overconfidence bias behave to overestimate their knowledge and underestimate their risks. Psychological findings state that the behavioural of avoidance of regret related to investors do not sell their stocks when the price is low due to the fear of making loss, but willing to sell the stocks when the price started to increase.
_______________________________________________________________________________
Undergraduate Research Project Page 21 of 87 Faculty of Business and Finance
2.1.3 Price Pressure Hypothesis
According to Price Pressure Hypothesis, few researchers examined investors are more likely to consider on buying in the options that have first caught their attention among the massive information available. The reason proved by Barber Odean (2008); Swamy, et al. (2019) and Yung & Nafar (2017), they founded that individual investors have limited time or resources to consider among the thousands of stocks in the market. Majority investors are attracted to the news attention because of the news have reported as an example of attention-grabbing event. Furthermore, Barber and Odean indicated that individual investors are net buyers of attention- grabbing stocks, hence; the stocks will experience in high abnormal trading volume.
Two empirical conceptual frameworks in explaining how investor attention generates price pressure have been done by Swamy, et al. (2019) and Smales (2021). There are information discovery hypothesis and asymmetry of the choices hypothesis. The information discovery hypothesis argues that if more abundant news information will help investors in reducing information asymmetry. That information related to stocks are easy for investors to access through Google search. In the study of Smales support the information discovery hypothesis indicate that COVID-19 attention is associate with a negative stock return.
For asymmetry of the choices hypothesis, Barber and Odean (2008) supposed price pressure hypothesis generated when only the attention- grabbing stocks are chosen and purchased by investors. The authors also pointed out the problem about investors have only limited resources and time to analyse on the large amounts of possible investments, this argument also proven by Smales (2021). It also explained by the concept of a rises of
_______________________________________________________________________________
Undergraduate Research Project Page 22 of 87 Faculty of Business and Finance
search query will create investors’ buying attention on the security.
Conversely, there is no such search problem exist in the condition of selling stocks from retail investors because the person is typically only able to see the stocks they already own. Summarize, a rising number of attentions will increase buying and temporarily push the prices up, but no impact on selling frequency.
In support of this theory, a research paper done by Swamy et al. (2019) found that there is relationship between investor’s attention and stock market performance. For instance, Fehle et al., (2005) stated there is a positive effect on the company’s stock prices in which the company was mentioned in the American daily newspaper of New York Times; as well as the example from Takeda and Yamazaki (2005) stated there is increase in the company’s stock prices after the broadcast on the Japanese TV program.
Moreover, Barber and Odean (2008) suggests the direct measurement of GSVI reflects the retail investors’ attention by testing the attention-induced price pressure hypothesis. Other than that, Adachi et al. (2017) examined the raising stock liquidity and trading activity if there is an increase in search queries. Study of Tan & Tas (2019) also provide evidence that an increase in average search volume index generates higher future returns.
_______________________________________________________________________________
Undergraduate Research Project Page 23 of 87 Faculty of Business and Finance
2.2 Review of Empirical Results
2.2.1 The Concept and Measurement of Investor Attention
Odean (1999) explained that investor could solve the problems of selecting from thousands of potential stocks to invest by restricting their selection to the stocks that have recently gets their interest. Investor are likely to purchase attention-grabbing stocks and the preference of investors indicate their decisions after the choices has been determined by attention. The search for details of a specific topic clearly shows that one pays attention on the matter. Papadamou et al. (2020) stated that internet searches are one significant medium by which investors deliver their information requirement in the way that are more direct and transparent. Hence, Google Search Volume Index (GSVI) offers a direct and timely indicator of the attention and could reflect the general population’s searching behaviour. Da et al. (2011) was the first to implement the Google Search Volume Index (GSVI) as the indicator for investor attention.
The search on the Internet reflects the intention of investor to look for information in the search queries. The online search platform currently leads by Google and its partner networks like Yahoo, Bing and Baidu, comprising over 95% of the online searching (Nawaz, 2014). Google search query has been widely used on the literature throughout variety of field study. Internet provides huge amount of available information and easily to be access globally. Google reflects the search behaviours of Internet users as users will search for the particular terms while they paying attention to it (Smales, 2020). The GSVI could obtained from Google Trend, which tracks the cumulative number of searches of the term scaled by its time-series
_______________________________________________________________________________
Undergraduate Research Project Page 24 of 87 Faculty of Business and Finance
average and is generated weekly using the aggregate search frequency of Google. The results index is normalised from 0 to 100, term that obtained 100 of search volumes indicates a highly researched during the timeline and chosen geographical area, while the 0 scaled search volume indicate no researched or few researched at that timeline (Yung & Nafar, 2016; Lyke &
Ho, 2021).
Many researchers have examined the investor attention on Covid-19 by using the GSVI to reveal a significant effect on the financial stock market.
The research of Lyke & Ho (2021) stated that Google Trends enables the users using search volume index to indicate search frequency related to Covid-19 to analyse the impacts of attention to the Africa stock market and the results proved that GSVI is significant measurement for attention. The search queries for the Covid-19 related keywords are act as the proxied to indicate the investor attention on the Africa stock market on Covid-19 pandemic. The study found that a rapid flow of Covid-19 related information has grab the attention of investors, the Google Trends show a sharp increase on the Covid-19 related terms proved by Smales (2020). The study indicates that when investors paying high attention to the Covid-19 related information contribute greater exploration of information.
The Covid-19 pandemic create enormous uncertainty to the global stock market that could directly affects the financial economics. The widely use of technology provide the platform for investors to look for the stock trading patterns and make actively trading in stock markets during the era of Covid- 19. Swamy & Dharani (2019) indicate GSVI could be a reliable measurement of direction and magnitude on excess returns and GSVI has been proved useful towards the strategies on profitable trading. Study on Papadamou et al. (2020) reveal that the GSVI could be significant determinant of attention on coronavirus to the stock market. The study examined the synthetic index on the term and theme of “Coronavirus” to
_______________________________________________________________________________
Undergraduate Research Project Page 25 of 87 Faculty of Business and Finance
capture the attention. The study reveals an increase on risk-aversion in stock market to the contagion effects of google based anxiety towards Covid-19 pandemic.
Several studies proved that GSVI act as indicator for attention are applicable to predict future trading activity as compared to current. GSVI is significant to forecast the trading volume and volatility, which are consistent with market efficiency as study stated that nearly 90% of the internet searches are performed by Google’s search engine. GSVI could recognise the future trading patterns by the search queries act as the proxied for the attention (Kim et al., 2018). Tan and Tas (2021) results that increase in GSVI is linked to higher future returns. The study further mentioned that firms receiving abnormally high attention are earning higher returns and the results revealed stronger price pressure effect of GSVI among small stocks.
2.2.2 Investor Attention and Stock Market Return
The attention theory proposed by Barber and Odean (2008) stated that investors make investment decision on stocks that attract their attention as they found difficulty to search on the huge amount of potential stocks they can buy, results only those stocks that could get investors’ attention are purchased that will directly impacts the stock market trading. Recent studies on the attention on Covid-19 found that the increase on investor attention results a negative stock market return. Shear et al. (2021) study on investor attention on Covid-19 to the 34 countries stock market returns and found out that the high investors’ attention is expected to generate greater selling pressure from shareholders. This is due to the disposition effect or rebalance of portfolio requirements as COVID-19 created enormous uncertainty and raised economic uncertainty. Research on Smales (2020) show that the
_______________________________________________________________________________
Undergraduate Research Project Page 26 of 87 Faculty of Business and Finance
shareholders are intends to sell out high risk stocks to reduce uncertainty that could give negative impact the stock market return.
The studies demonstrate that investors may highly relying on the news attention as their primary source of information and would make their investment decision based on the news attentions. The study of Engelhardt et al. (2020) indicates the investor attention on corona-crash of a total of 64 countries stock market and found that the enormous uncertainty that created by Covid-19 pandemic results a significant negative stock market return.
The effects of Covid-19 pandemic on the financial market are an emerging strand. Investors pay more attention on the negative information and results a decline on stock return with higher attention to reduce potential losses.
Smales (2020) study on the investor attention on Covid-19 to U.S. stock market. The research reflects that during financial crisis period, investors are giving higher attention on stock that catch their attention and holding stocks, investors likely to reduce uncertainty and created selling pressure on risky stocks instead of buying on new stocks as Covid-19 created a decline phenomenon on the stock market.
Moreover, previous studies also revealed that the role of investor attention creates a new window for researching the predictability of future stock market. The study of Yoshinaga and Rocco (2020) on 57 Brazilian stocks by analyzing weekly GSVI from 2014 to 2018. The results demonstrate a greater effect on high trading volume stocks and revealed a lower stock return. The rises in the attention may expose the stock to higher risk and this is consistent with the theory that greater interest from individual investors contributes to lower subsequent returns. This meaning that growing popularity causes stock prices to deviate from their basic valuation, resulting a negative return on stock. Kou et al. (2017) found that the greater predictive strength of the search frequency is from PC-based searches and
_______________________________________________________________________________
Undergraduate Research Project Page 27 of 87 Faculty of Business and Finance
not from smartphone searches that could forecasts greater positive and negative returns on futures markets.
In contrast, there are few studies showed that the increase on the investor attention results a positive stock return. The study of Zhang et al. (2020) investigates on the investor attention and the mask concept stock under the Covid-19 outbreak and found that they have positively significant impacts.
The establishment of the model of panel fixed effect analyze that since the Covid-19 outbreak, high production of the mask rises the attention of investors on the mask concept stock. Investor access to information to the mask concept stocks revealed a high attention and results in a positive return on the mask concept stocks. The study on Swamy et al. (2019) found that the GSVI and stock return are significant and positively related as the higher attention forecast higher stock returns. Investors’ trading behavior can be capture from the GSVI to determine the investors’ attention and the stock- related information from Google is useful for financial decision. Investors are making decision on the access information as compared with make decision on the basis of experience. The results show that while investors paying more attention on the stock prices results a positive stock returns in subsequent three weeks (Swamy, 2019).
2.2.3 Investor Attention and Stock Volatility
The rapid development of the Internet created a platform for investors to capture stock information and financial news for analysis and make prediction on the stock market and could be directly affecting the stocks trading activity (Zhang et al., 2020). Several researches have studied on the impacts on investor attention on the stock trading volume and volatility to investigate the prove that attention is correlated to the volatility in the stock
_______________________________________________________________________________
Undergraduate Research Project Page 28 of 87 Faculty of Business and Finance
markets. The research on Zhang et al. (2020) found that the higher attention on the stock market is significantly related to the stock volatility. The research studied on mask-related stock market during Covid-19 pandemic.
Investors could access the information through search volume and big data, investors make investment decision based on the information obtained and attentions focused on stocks that caught their attention and cause buying and selling pressure. The buy and sell of stocks reflect the stock price fluctuation and high volatility of the stock markets and results the increase number of the search volume on the stock market reflects a higher trading volume and greater volatility on the stocks (Smales, 2020).
The increase in the internet searches triggers a rapid flow of information into the financial markets, that could generate a higher volatility of the stocks. Smales (2020) studied on the investor attention and global stock market on Covid-19 period and found that the increase on investor attention would results higher stock volatility. The investor reflects their trading activity behavior based on their attention on the stock’s information that could create a shock to the market. The rapidly fast dissemination of news on Covid-19 pandemic causing stock market fluctuate is larger than at any other time of history (Papadamou et al., 2020). Investors’ attention is focused on the stock’s performance that could reduce their uncertainty about fears during the crisis. Thus, the stocks markets result a greater trading activity and greater volatility.
Study also proved that increasing on the investor attention shows an increase stock volatility even after controlling the impact of the financial crisis (Aouadi et al., 2013). Study shows that the investor attention is highly associated with trading activity and is a major determinant of stock market performance. Aouadi examined the France stock market illiquidity and volatility and results a significant positive relation between the investor attention and stock volatility even after monitoring the effects of financial
_______________________________________________________________________________
Undergraduate Research Project Page 29 of 87 Faculty of Business and Finance
crisis. The results show robust after including the crisis effects and a strong correlation is revealed between the investor attention to the France stock market volatility. Online searches reflect the investment behaviours of investors and proved that online searches are highly correlated to the trading volume and stock volatility where shows the correlation of SVI and volatility are significant and positive (Chen & Lo, 2018).
The google search queries has predictive potential for the stock volatility while investor exposure to the stock market results in a high market movement. The research of Brochado (2016) proved that rising on the investor attention results greater stock volatility. The research examined the Portuguese stock market return and volatility to the investor attention by using GSVI. The strong correlation is found when the stocks are gaining more attention from investor, it will be comparatively more traded as compared to those that draw lesser attention. The price fluctuation results a greater volatility on the Portuguese stock market. The study on Bui and Nguyen (2019) proved that the investor attention is significantly positive to the Vietnam stock market volatility on the VN-100 stocks from 2014 to 2018. Bui and Nguyen reveal that the high attention on the stock market leads to the more uncertainty and rising on the access on online information could resulting in overtrading and the greater price fluctuation. Thus, the results revealed that investor attention is significant for forecasting the stock market return volatility.