Electrical resistivity tomography (ERT) is one of the most common, widely implemented and promising methods for producing cross-sectional images showing the distribution of electrical conductivity for a particular multiphase flow. The method involves measuring electrical resistance characteristics that convert it to image mixtures when the continuous phase is conductive. Other types of tomography sensors that involve the measurement of electrical characteristics include electrical capacitance tomography (ECT), electromagnetic tomography (EMT), and electrical impedance tomography (EIT).
Among other things, ERT has the advantage for its excellent time resolution produced from very fast measurements of electrical resistance. The main focus for this project is to implement ERT for detection and measurement of gas void fractions in waxy cooled crude oil.
- Problem Statement
- Objective and Scope of the project
- Main Objective
- Scope of Project
- Relevancy of Project
- Feasibility of Project
It is important to consider the multiphase present in the waxy cooled crude oil. Gas voids formed in the waxy cooled crude oil can affect the compressibility of the crude oil. The aim of this study is to measure, detect, visualize and characterize waxy cooled crude oil, whereby image and raw data of the multiphase flow can be directly captured.
Flow visualization focuses on two-dimensional imaging of the multiphase gas fraction in waxy cooled crude oil. The project will be carried out by collecting related materials, such as journals and technical articles, specifically on ERT, the physical properties of crude oil and the gas void fractions in the measurement of waxy cooled crude oil.
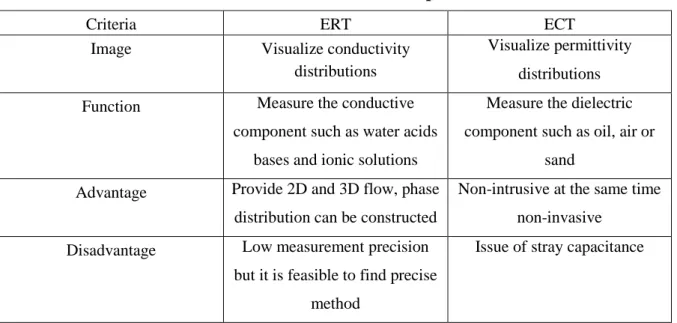
- Electrical Resistance Tomography (ERT)
- ERT and ECT Comparison
- Nuclear
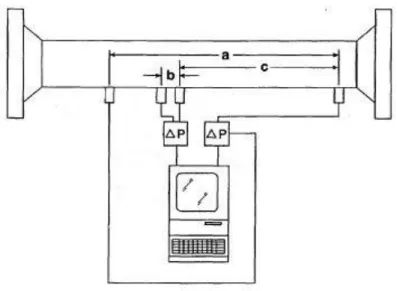
- Differential Pressure
- Multiphase Flow
- Flow Regimes
- Superficial Velocities
- Waxy Cooled Crude Oil
- Yield Stress for Waxy Crude
The measurement principle can also be presented in a theoretical derivation of the optimal excitation field distribution, where current injection and electrode voltages form the electric field in homogeneous conductive media. Two of the most advanced radiation methods recently developed are the X-ray Computed Tomography (X-CT) system and the Real-Time Neutron Radiography (RTNR) system. During this transport, the multiphase mixture travels through multiple inclination changes, affecting the flow pattern and flow characteristics of the multiphase pipeline, so as to further complicate the problem of pipeline corrosion.
Measuring a time delay between the start of the primary pressure drop and the start of the secondary drop. Determining as a function of time delay whether the primary pressure drop corresponds to a predetermined multiphase flow anomaly moving through the analysis section of pipe. Flow regimes is the physical geometry exhibited by multiphase flow in a channel, which will vary depending on operating conditions, fluid characteristics, flow rate, and the orientation and geometry of the tube through which the fluids flow.
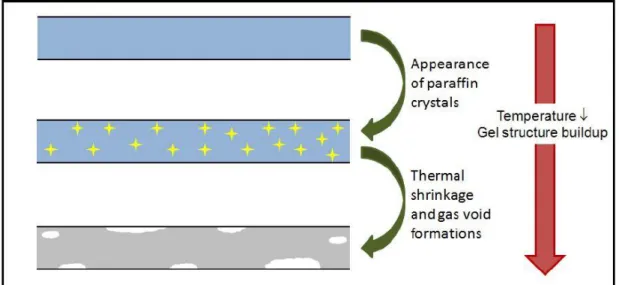
The sum of vs,gas and vs,liquid is the multiphase mixing rate and the expression is given below. In the real situation, thermal shrinkage of the crude oil in the pipeline occurs naturally, as the temperature of the seabed is low depending on the geographical difference, and the thermal shrinkage occurs during the shutdown period of the facility, therefore the crude oil remains in the pipeline for a certain period of time. A study on the thermal shrinkage titled "Novel Approaches to Waxy Crude Restart: Part 1: Thermal shrinkage of waxy crude oil and the impact for pipeline restart" had come out with a result that proved that there were gas voids produced by the cooling process of crude oil in the flow line (Phillips, David A., 2010).
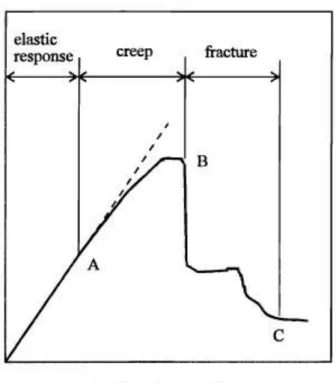
The appearance of gas voids can affect the compressibility of the gelled crude as there are spaces for the gelled crude to move after a certain pressure. This assumption was also confirmed by Margarone, who stated that gelled petroleum behaves as an incompressible highly viscous liquid. However, the petroleum industry has not adopted any standard assay for determining the amount of recovery of waxy crude oils due to poor reproducibility in any given instrument and poor reproducibility between different assays [17]. One of the reasons for poor repeatability and reproducibility is that recovery values, along with all other rheological properties of waxy crude oils, are highly dependent not only on what the sample experiences, i.e. temperature and shear rate, but also from what the sample, i.e. thermal and shear history.
Even a small change in any of the test or history conditions can cause a noticeable difference in the measurement results. Another important reason for poor repeatability is that there are various confusing definitions of yield stress due to a lack of understanding of the complicated yield process [20].
- Flow Chart
- Key Milestones
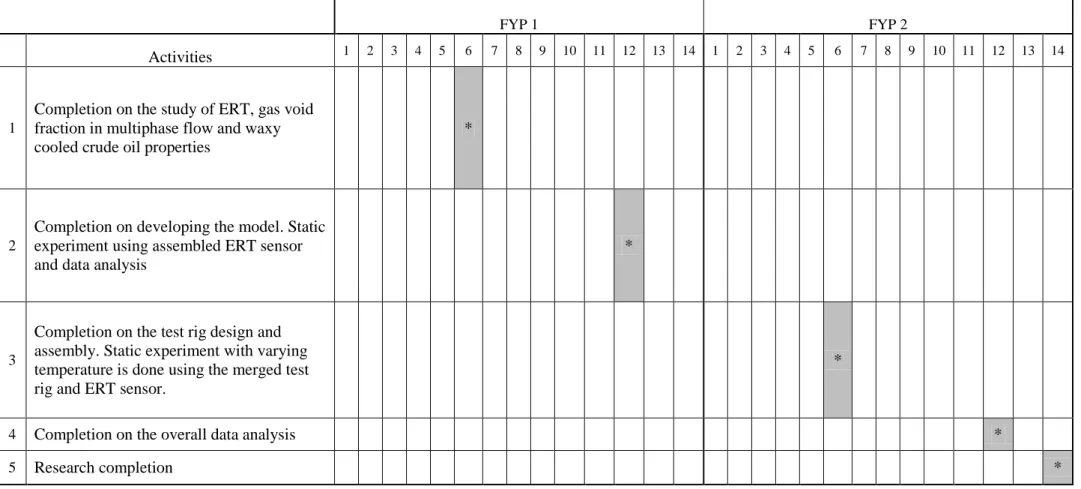
- Gantt Chart
- Electrical Resistance Tomography (ERT) Measurement
- Electrical Resistance Tomography (ERT) Sensor Design
- Image Reconstruction
- Linear Back Projection Algorithm (LBP)
- Static Test
Completion on the study of ERT, gas void fraction in multiphase flow and waxy cooled crude oil properties. Static experiment with varying temperature is done using the combined test rig and ERT sensor. Study on waxy cooled crude oil properties 2 Submit extended proposal 3 Development of ERT sensor and static experiment.
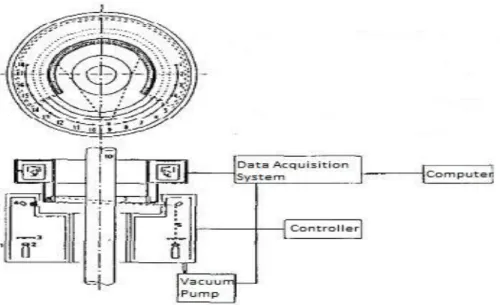
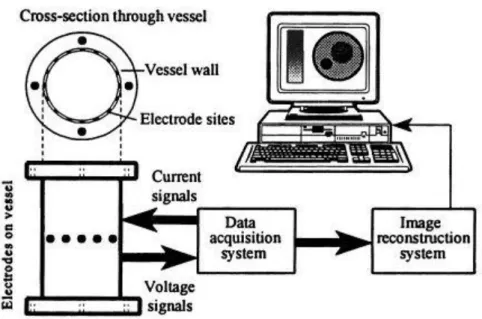
The ERT Sensor includes the measurement of fluid resistance, whereby the fluid flowing in the measurement area is categorized as an electrical conductor [8]. The proposed measurement process is simplified in the flow chart as shown in the figure below. For this particular project, that means measuring gas hole fraction in waxy cooled crude oil.
The result would show the percentage of which gas fraction inhabits a given amount of waxy cooled crude oil [9]. The targeted image reconstruction flow for this project is as shown in the figure below. The flowchart in the figure below briefly shows the planned course of the image reconstruction using the LBP.
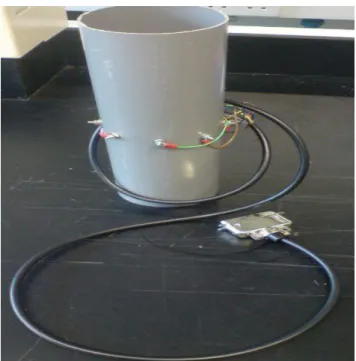
Referring to the objective of the project, this is the part where the author will measure, detect, visualize and characterize the cooled wax crude oil with different temperatures. For the static experiment, the ERT sensor mounted with appropriate shielding enclosing the wax-cooled crude oil is then placed in a container filled with water. The temperature then varies from 10°C to 50°C thereby affecting the properties and characteristics of the wax-cooled crude oil in the sensor.

- Sensor Calibration Results
- WAT Table
- Raw Resistance (Ω) Distribution
- Raw Resistance (Ω) Distribution and Temperature (°C) Relation
A better fit dimension will be used to design another ERT sensor for the next part of the project to run the static test to characterize waxy cooled crude oil. The waxy cooled crude oil used in this project was recovered at the Sepat Field owned by PETRONAS Carigali Sdn. To gain a better understanding of the properties and characteristics of the waxy cooled crude oil and the liquid and waxy phase within the 10°C to 50°C margin, a Wax Appearance Temperature (WAT) table from PCSB is used as a reference.
WAT is the point at which the crude oil will develop into a waxy cooled or semi-solid state. The pour point, on the other hand, is defined to be the lowest temperature at which the crude oil will be in a liquid state. With reference to the table below, Sepat crude oil's WAT and pour point are both estimated to be at 35°C.
This indicates that if the temperature of the crude oil goes below the critical temperature point of 35°C, the wax will start to appear and will no longer be in a liquid state, instead the crude oil will be semi-solid. From the static experiment, the author obtained a raw resistance (Ω) plot of 66 readings for every 5°C change in temperature over the 10°C to 50°C range. The raw resistance (Ω) distribution is well within the high and low calibration limits, so the data can be accepted.
In order to obtain the relationship between the distribution of raw resistance with respect to temperature, the author analyzed five sets of data with reading studies between adjacent electrodes, every 2 electrodes, every 3 electrodes, every 4 electrodes and every 5 electrodes. From Figures 20 and 21 obtained from the data of Table 6, the author can observe that the distribution of raw resistance (Ω) is directly proportional to the change in temperature (°C). It can also be seen that there is a slight dip in each graph at 25 °C when the key WAT and pour point are reached, which represent the properties of crude oil undergoing a phase change.
Recommendation
Thorough understanding of the purpose of this project is very important to predict and anticipate the outcome of the experiment and to ensure that the project is completed within the allotted time. Consistent meeting with the supervisor is required to avoid making mistakes that would affect the overall outcome of the project. While working on this project, safety is a priority, especially because the material used in this project; crude oil, is highly flammable and will ignite with the slightest mistake, especially when power is injected inside the ERT sensor.
Calibration of the ERT sensor should be done for each online measurement to make sure the sensor is working well and to get the best results. Modification and repair should be done whenever necessary, as the sensor is very fragile and can cause poor results due to electrode wear and external interference. It is best to consult a laboratory technician if the ERT sensor or data acquisition system is not working properly.
Since the ERT sensor is placed in a container filled with water, a coating must be used to cover the electrodes to prevent damage. It is also recommended to ensure that the wires are not exposed to water as this will lead to a very damaging situation. Two Methods for Measuring Gas-Liquid Flows in Vertical Upstream Pipeline Using Dual-Plane ERT System.
Two methods for measuring gas-liquid flows in a vertical updraft pipe using a two-plane ERT system. Real-time measurement of average cross-sectional void fraction in two-phase gas-liquid flow in a vertical annulus by neutron and X-ray tomography techniques. Thermal shrinkage of waxy crude oil and impact on pipeline restart, Journal of Petroleum Science and Engineering.