In this project, real-time online shoppers purchasing intent data from Sakar et al. Weka, a data mining tool, provides the facility to classify datasets with various machine learning algorithms. The data used in this research were pre-processed with oversampling and feature selection methods.
Finally, the best combination of learning algorithms and sampling preprocessing methods can be determined on an unbalanced data set for predicting customer purchase decisions. The data set for online buyers is usually unbalanced - the majority is in the negative class (Not Buy) and a minority is in the significant positive class (Buy). Such an unbalanced distribution of classes in the dataset will greatly affect the prediction for a positive class, as machine learning algorithms favor the majority class.
This project is a data mining project and it aims to study the predictive ability of the selected machine learning algorithms using the dataset of online shoppers purchase intent provided by Sakar et al.
Existing Research
The data from the original dataset can be fully mined and the overfitting problem can be avoided. In this study, the dataset collected from the UK-Bank data repository consists of data from 5000 users. The records are an unbalanced dataset and the five machine learning algorithms include Naive Bayes, Gradient Boosting Tree, Random Forest, Logistic Regression, and Multilayer Perceptron applied to the model.
In the study, data was collected and analyzed on the flow of clicks from page to page from the online store; data is categorized as purchase, browse or search. The data set is highly unbalanced because the non-fraud case classes are the majority and dominate the fraud case class. The dataset analyzed in this paper was collected from 407 users on Taobao who are in the 90s generation.
With the help of the Weka tool, we can efficiently process the data set without coding the selected algorithms.
Unbalanced Data Set and Its Solutions
Sampling Methods
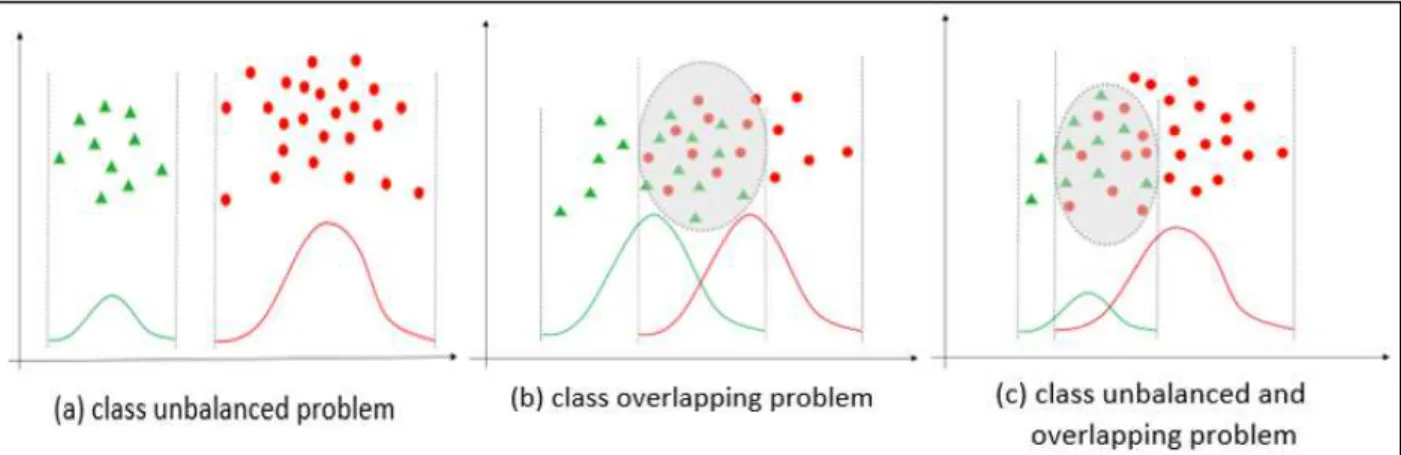
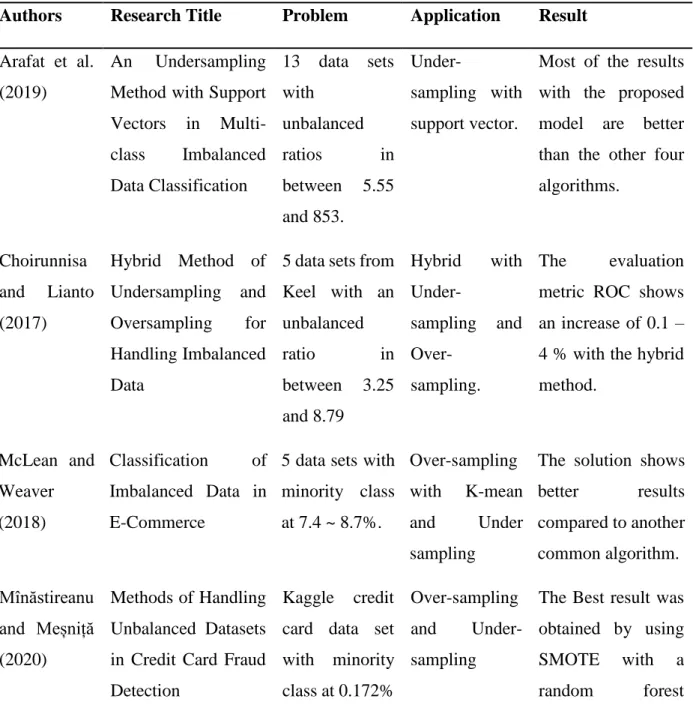
Knowing that unbalanced and overlapping classes will affect the performance of the customer prediction model, one of the goals in this project is to deal with the unbalanced dataset and overcome the poor prediction performance caused by the dataset. They reviewed the various unbalanced data handling solutions in this study, such as random oversampling, Synthetic Minority Oversampling Technique (SMOTE), random majority undersampling, one-sided selection undersampling and cost-sensitive promotion learning. Choirunnisa and Lianto (2017) used a combination of undersampling and oversampling to solve the unbalanced data problem.
4.0% compared to treating only the unbalanced data set with only one of the sampling methods. They presented a new approach for dealing with an unbalanced dataset, which is a hybrid classification method that combines algorithmic adaptations and multi-modal data formats. Meanwhile, in the research of Li and Zhou (2019), they introduced an improved over-sampling method from SMOTE known as TDSMOTE to solve the problem of classification effect in unbalanced data set.
14 From the studies of processing methods for unbalanced datasets above, sampling techniques for pre-processing unbalanced datasets showed effective results for improving classification performance.
Ensemble Learning
Therefore, using DS fusion theory can improve the classification accuracy of personal credit rating. The second type error rate obtained from the test sample was slightly higher than the two single classification models, but overall the DS fusion model showed the advantage of personal credit score classification for commercial banks. The first data set was telecom industry data extracting data from the UCI data set which has 5000 data samples with minority class percentage at 14.3%.
Preprocessing method such as feature selection and sampling techniques were applied to the two datasets. From the result, MCS achieved 97.2% accuracy on the first dataset and 86.3% accuracy on the second dataset which is the best performance among other selected classifiers. From the studies of handling methods for unbalanced datasets above, ensemble learning improved the classification performance for unbalanced datasets.
17 Table 2.3: Summary of literature review on unbalanced dataset solution (ensemble) Authors Research title Problem Application result.
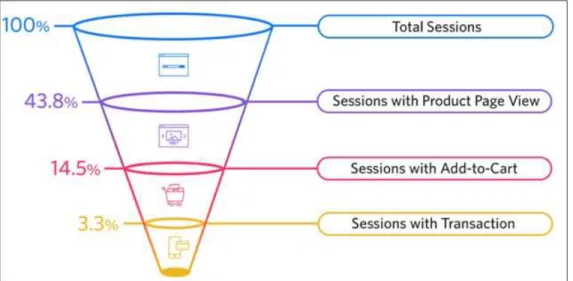
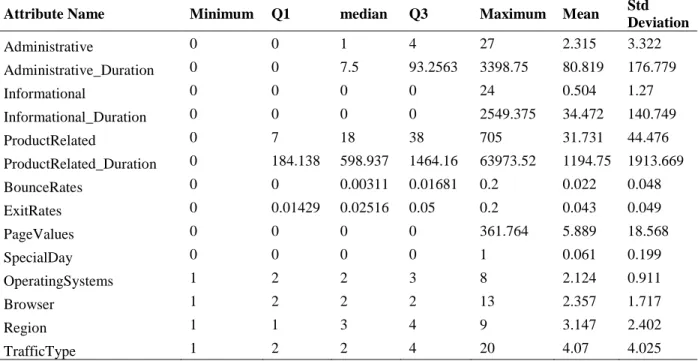
Data Set Overview
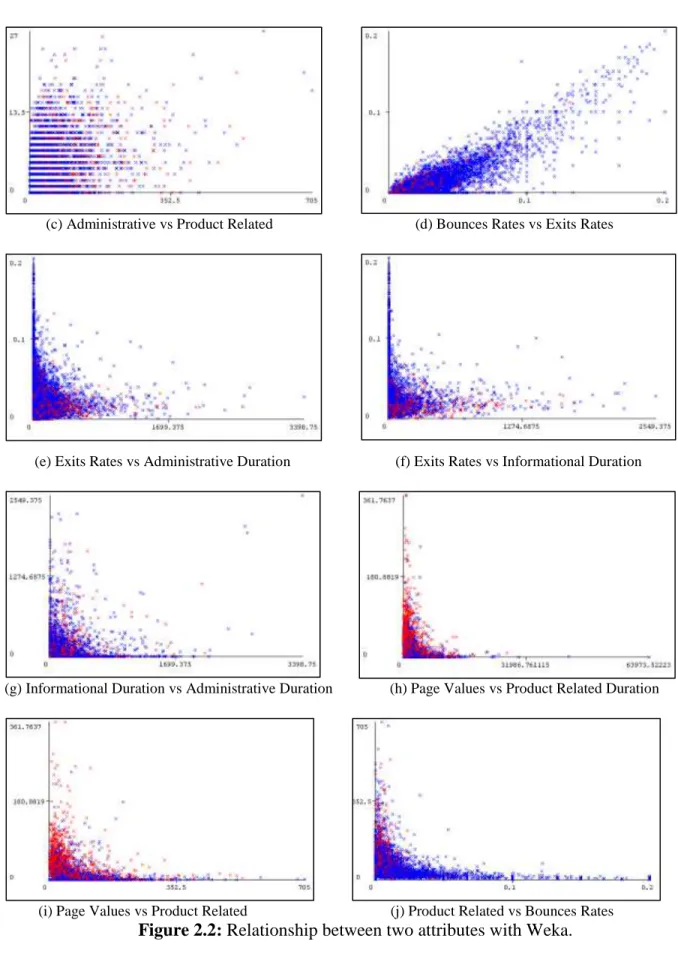
19 From the dataset, the descriptive statistics for each attribute were measured with numerical data and the overlapping graph was generated using the Weka tool. The result shows that the dataset overlaps strongly and has an unbalanced data distribution since the unbalanced ratio is 1:6. Therefore, this highly overlapping and unbalanced data set was selected to be applied in this project to further solve the problem of the low true positive rate for the positive class.
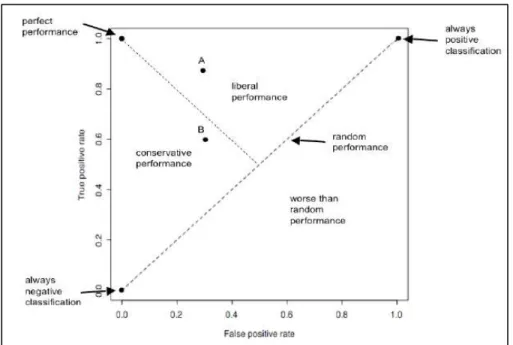
Evaluation Methods
There are two new metrics introduced in ROC, which are the true positive rate and the false positive rate. Random performance is the mean by which the model produces the same true positive responses as the false positive response. Accuracy is calculated based on the overall true positives and true negatives for the model's prediction outcome.
The proportion of true positives among the positives predicted by the system can be measured. The recall or true positive rate measures the overall correct positive prediction of a class from the model. The curve is a receiver operating characteristic (ROC) curve plotted between true positive and false positive.
Therefore, in this work, the focus will be on the recall/true positive rate for the customer buying decision prediction model.
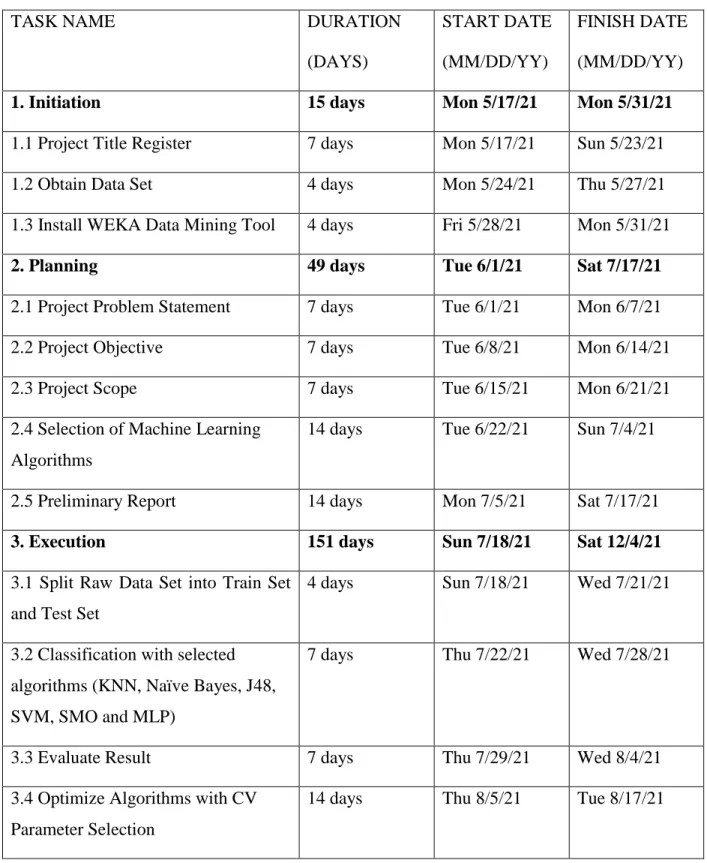
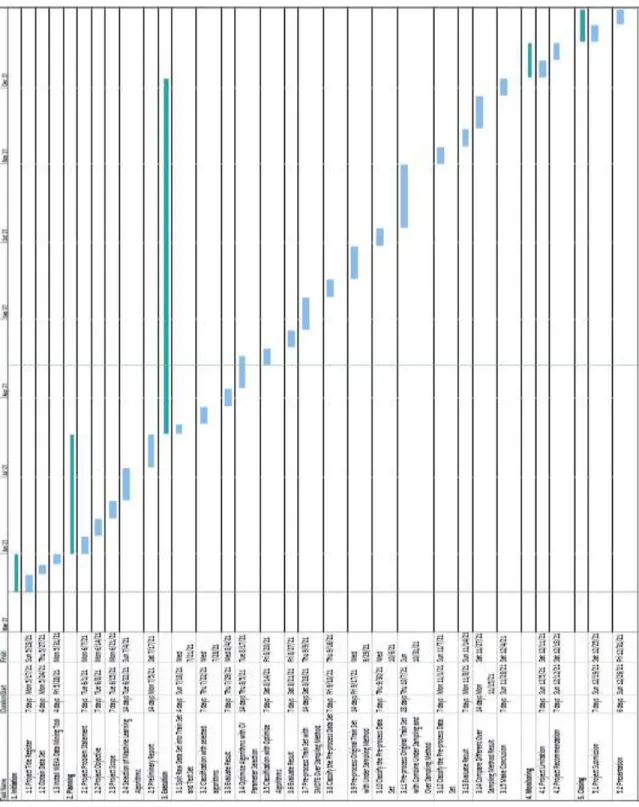
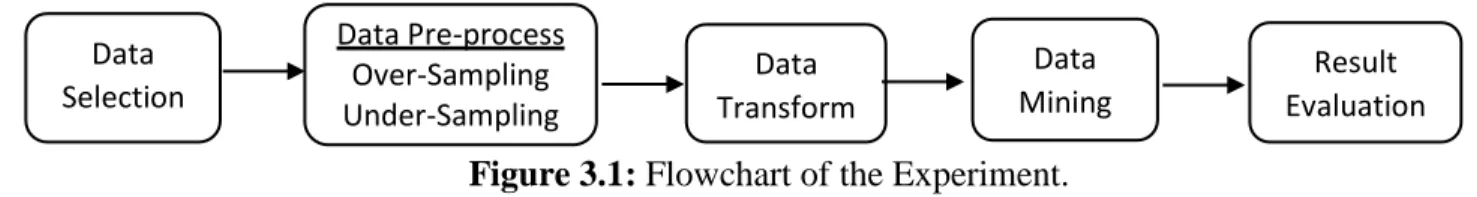
3. RESEARCH METHODOLOGY
Research Methodology
- Data Pre-processing
- Classification
Changes in the class distribution will balance the data set, and when input into any learning algorithm, performance is expected to improve. The oversampling was applied to the data set to increase the size of the minority classes. SMOTE uses the KNN method by selecting k number of nearest neighbors from sample data and aggregating them to generate synthetic samples in the dataset.
A specific percentage of the majority class data will be removed to balance the distribution in a data set. Therefore, the preprocessing of the unbalanced data set in this project needs to be experimented with: - Oversampling started from 10% to 150% for the minority class. In addition to the individual learning algorithms, the ensemble learning method was also used to further improve the classification performance.
The boosting algorithm built the first model by randomly selecting data from the supplied data set and testing it with other unselected data. The process continues several times to improve the classification performance and reduce the wrong classification result. The classification results obtained from each learning model will be voted to make the final decision.
It improves classification performance with multiple learning models to reduce variance and increase robustness of the provided dataset. Classification performance was evaluated with accuracy, true positive rate, and true negative rate to compare the performance of algorithms based on correct prediction for positive and small classes in the dataset. However, in this project, the true positive rate was more focused than the accuracy rate since the accuracy may not be suitable to judge the performance for an unbalanced data set.
𝑇𝑃+𝐹𝑁 takes the correct guess-positive class (buy) and divides by the total number of positive class data from the classification output. While accuracy is the overall predictor for both positive and negative classes in the classification output.
4. RESULT
Without Any Sampling
Before the dataset was preprocessed in the next phase of experiments, the learning algorithms' parameters of J48 were fine-tuned with CV parameter selection. The confidence factor (c) and minimum object per leaf (m) for J48 were set to 0.05 and 2 respectively. The small value of the confidence factor means more branches for the classification model built.
With Over-Sampling (SMOTE)
As shown in Figure 4.1 and Figure 4.2, the TPR of both classification models was improved by SMOTE (over-sampling). For Naïve Bayes, TPR increased continuously when increasing the percentage of over-sampling, but TNR and precision dropped accordingly.
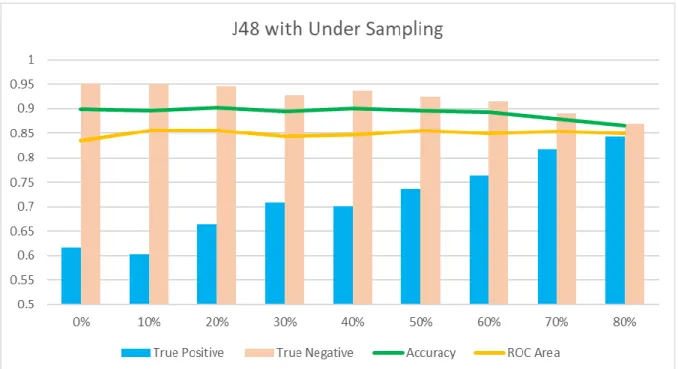
With Under-Sampling
36 As Figure 4.3 shows, the undersampling method achieved a better result than oversampling with J48 by undersampling 80% of the majority class (No Buy). Figure 4-4 showed that undersampling Naïve Bayes had the same problem as in SMOTE.
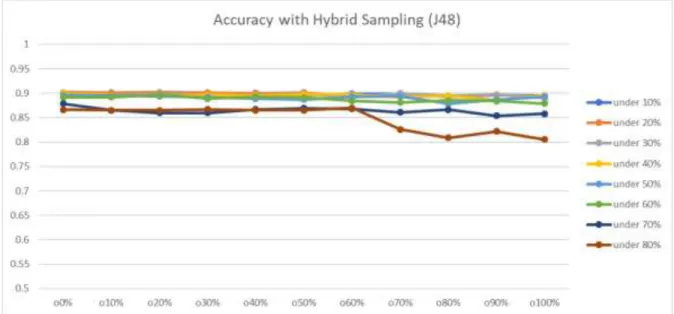
With Hybrid Sampling
As shown in the graph from Figure 4.5 to Figure 4.7, overall performance with J48 using hybrid sampling was slightly improved compared to simply using subsampling. The best result was obtained with the hybrid method (60% oversampling + 80% undersampling) among the three data preprocessing methods. Since there is no significant improvement with the ensemble methods used, further experiments were conducted by combining ensemble learning with the sampling method.
For the oversampling ensemble method, J48 bagging with 80% oversampling was the best. For the subsampling group method, the best was bagging with J48 with 70% undersampling. For the ensemble method with hybrid sampling, J48 bagging with 60% undersampling and 80% oversampling was the best.
Based on the table above, the best result of the sampling method was hybrid at 60%. The results obtained with different unbalanced data sets obtained by the sampling methods and different machine learning algorithms were visualized and compared with the tool. The data set was split into a train set (70%) and test set (30%) and models were built using the unsampled data set, sampled data sets and ensemble learning.
The best result was obtained by the hybrid sampling method with 60% oversampling + 80% undersampling and applied with single learning algorithms J48. The best model built in this project achieved only comparable performance to Sakar et al. The ensemble learns AdaBoost and Bagging, with base learner Naïve Bayes and J48 showed no improvement.
To obtain a better classification result than Sakar et al. 2018), the other ensemble learning methods, such as voting and stacking, will be considered for future experiments.