DESIGN OF FLEXIBLE fflGH RISE STRUCTURE TO CATER TO HUMAN COMFORT CRITERIA AND STRUCTURAL STABILITY
By
MOHAMAD NAZRIN B ZAINALABIDIN
FINAL PROJECT REPORT
Submitted to the Civil Engineering Programme in Partial Fulfillment ofthe Requirements
for the Degree
Bachelor of Engineering (Hons) (Civil Engineering)
Universiti Teknologi Petronas
Bandar Serf Iskandar 31750 Tronoh Perak Darul Ridzuan
©Copyright 2010 by
Mohamad Nazrin Bin Zainalabidin, 2010
n
CERTIFICATION OF APPROVAL
DESIGN OF FLEXIBLE HIGH RISE STRUCTURE TO CATER TO HUMAN COMFORT CRITERIA AND STRUCTURAL STABILITY
Approved:
by
Mohamad Nazrin B Zainalabidin
A project dissertation submitted to the Civil Engineering Programme Universiti Teknologi PETRONAS in partial fulfilment of the requirement for the
Bachelor of Engineering (Hons) (Civil Engineering)
APIR Dr Shahir Liew
Project Supervisor
UNIVERSITI TEKNOLOGI PETRONAS
TRONOH, PERAK
June 2010
i n
CERTIFICATION OF ORIGINALITY
This is to certify that I am responsible for the work submitted in this project, that the original work is my own except as specified in the references and acknowledgements, and that the original work contained herein have not been undertaken or done by unspecified sources or persons.
azrin B Zainalabidin
IV
ABSTRACT
This project is carried out to design flexible high rise building to cater to human comfort and structural stability. The wind force can result in the vibration of the building in which can induce the discomfortness to the occupants if the motion experience exceeds the perception level. This project is carried out to analyze and design high structure in Malaysia that meets the human comfort criteria. This project will require knowledge of wind force and human perception threshold levels.
Acceleration of the wind is taken as the parameter to evaluate the human perception level. The design and analysis are based on ASCE 7-05.Two models of high structures in Malaysia have been chosen and analysis has been carried out on the subjects.
ACKNOWLEDGEMENTS
I would like to thank everyone who has been involved directly or indirectly that contribute to the completion of this project:
First and foremost, I am thankful to Allah the most gracious, for blessing me with the knowledge and patience that has been crucial towards the completion of this project.
Secondly, I would like to thank AP IR Dr Shahir Liew, for the help and guidance throughout my Final Year Project. Without his contribution, I would not be able to finish this project successfully.
Special thanks to all my friends especially Johann Khuzaimi Kalana and Ruzaidi Ab Aziz for their tremendous support during the difficult time of completing the project.
Finally, this project is dedicated to my parents, Mr Zainalabidin Sarbani and Mdm SuhidahPaidar for their undivided love and encouragement throughoutmy life.
VI
TABLE OF CONTENTS
LIST OF TABLES ix
LIST OF FIGURES x
LIST OF ABBREVIATIONS xi
CHAPTER 1 INTRODUCTION 1
1.1 Background Study 1
1.2 Problem Statement 2
1.3 Objectives and Scope of Study 2
CHAPTER 2 LITERATURE REVIEW 3
CHAPTER 3 METHODOLOGY 6
3.1 Procedure Identification 6
3.2 Research and Literature Review 7
3.3 Design Procedures 9
3.4 Use of Comfort Criteria in Design 10
CHAPTER 4 RESULT AND CALCULATION 11
4.1 Analytical Procedure for Building A 11
4.1.1 Checking Normal Period of Vibration 13
4.1.2 Gust Factor 13
4.1.3 Design Wind Pressure 15
4.1.4 Calculating the Displacement 16
4.1.5 Calculating the Acceleration 17
4.2 Analytical Procedure for Building B 19
4.2.1 Checking for Normal period of Vibration 21
4.2.2 Gust Factor 21
4.2.3 Design Wind Pressure 23
4.2.4 Calculating the Displacement 24
4.2.5 Calculating the Acceleration 25
CHAPTER 5 DISCUSSIONS 27
CHAPTER 6 ECONOMIC BENEFITS 32
6.1 Case study 1: John Hancock Tower, Chicago 33 6.2 Case study 2: Gulf and Western Building, New York 33
CHAPTER 7 CONCLUSIONS AND RECOMMENDATION 34
v n
7.1 Conclusions 34
7.2 Recommendation 35
REFERENCES 36
APPENDICES 37
Appendix A ASCE 7-05 38
Appendix B wind directionality Ka 39
Appendix C variation factor, 1 40
Appendix D velocity exposure coefficient kh and kz 41
Appendix E terrain exposure constant 42
AppendixF variation of peak factor with average fluctuation rate 43 Appendix G variation of turbulence background factor with height and
aspect ratio of building 44
AppendixH variation of roughness factor with buildingheight 45 AppendixI maximum 5 years acceleration according to iso 6897 46
Vlll
LIST OF TABLES
Table I Velocity Pressure Exposure Coefficient (Kz) According to Height for
Building A 12
Table 2 Velocity Pressure qz Based on Height for Building A 12 Table 3 Design Wind Load for Windward Wall based on Height 15 Table 4 Velocity Pressure Exposure Coefficient (Kz) According to Height for
Building B 20
Table 5 Velocity Pressure (qz) based on Height for Building B 20 Table 6 Design Wind Load for Windward wall based on Height for BuildingB 23
Table 7 Along wind and Cross wind Acceleration 28
Table 8 Human Comfort Criteria 29
Table 9 Upper Limit Boundary 30
Table 10 Maximum 10 years Acceleration according to BLWTL 30
IX
LIST OF FIGURES
Figure 1 Work Flow Chart 6
Figure 2 Building A and Building B 8
Figure 3 Dimension ofBuilding A 11
Figure 4 Design Windload for Building A 16
Figure 5 Sketch Figure and Dimension for Building B 19
Figure 6 Design Wind Load for Building B 24
x
LIST OF ABBREVIATIONS
RMS Root Mean Square
ASCE American Society of Civil Engineers BLWTL Boundary Layer Wind Tunnel Laboratory
XI
CHAPTER 1 INTRODUCTION
1.1 Background Study
This project is carried out to design a flexible high rise building to cater to human comfort and structural stability. This project focuses more on the design and analysis
of the high rise building in Malaysia which is taking in to consideration the effect of
wind. Dynamic wind pressure imposed force which can induce wide range of response to the occupant, ranging from anxiety to acute nausea. Motion resulting from the wind can vary greatly in duration and intensity, thus affecting the
physiological and psychological state of the occupant in which will result in undesirable condition of the building.
In this study, acceleration has been taken as the parameter to evaluate the human
threshold perception as the basis for human comfort in high rise building. Basically, building that has the height greater than 10 stories are very responsive to the wind load. Moreover, the advancement of architectural technology, structural innovations and lightweight construction nowadays have led to the design of light and flexible modern building which is more prone to the wind motion. In building that is experiencing motion, the objects may vibrate and ifthe building has a twisting action, its occupant may get an illusory sense that the world outside is moving, creating the symptoms of vertigo and disorientation. The resulting dynamic stress may induce motion that may disturb the comfortness ofthe building occupant.
However there are no specific international standards for comfort criteria.
Nevertheless there are parameters which are considered influential to determine human response to vibration:
• Period
• Amplitude
• Body orientation
• Visual
• Acoustic cues
1.2 Problem Statement
Human comfort engineering, specifically on the wind effect is not a commonpractice in the design of the high rise building in Malaysia. The wind force can result in the vibration of the building in which can induce the discomfortness to the occupants if
the motion experience exceeds the perception level. The art of designing high rise
building in the windy climate is not only to ensure the structure can withstand the wind force steadily, but as well to keep the motion of the building within the comfortable limit in which is more challenging than meeting the strength requirements of the building itself. The designer must ensure there are no undesirable motions that could adversely affect the occupants. However, no international standardhas been achieved on the comfort criteria itself.
13 Objectives and Scope of Study
It would be prohibitively expensive to construct a building that would not move perceptly in the worst storm. Consequently, since some motions are inevitable, the goal is to determine levels of motion and rates of occurrence that is acceptable to the building occupants. Therefore the objectives and scopes of the studyare:
• To understand and analyze the wind effect on the high rise structures in Malaysia
• To determine the effects of wind loading with regard to human
comfort criteria
• To study the parameters that is being used in evaluatinghuman
comfort
• To establish and determine the human comfort level in highrise building in Malaysia
CHAPTER 2
LITERATURE REVIEW
The rapid growth of tall building and towers has fascinated mankind nowadays. High
structures and towers has been the symbol of power and economic stability for many countries and it is certainly has put the nation on the map of the world. Response todemand of high population of people in big city has lead to the construction of high
structures for residence. From the engineering perspective, Bryan and Alex [1] statethat, tall building can be defined as one that, because of its height, is affected by lateral forces due to wind or earthquake actions to an extent that they play an
important role in structural design.Human comfort influenced in the design of high rise building has been taken
seriously nowadays. The use of high strength material and advanced structural system
has produced lighter system and has been widely used in the building of high rise in which has increased the sensitivity of building towards the effect of wind. Bryan andAlex [1] in his book mentioned thatalthough there are yet no universally standard for comfort criteria, it is generally agreed that acceleration is the predominant parameter in determining human response to vibration, but other factor such as period,
amplitude, body disorientation, visual, acoustica cuesand even pastexperience can beinfluential too.
There are two types of acceleration that is normally being used to evaluate perception
level namely, the peak value and RMS (root-mean-square) value. Scholars have been debating on which value is giving the most accurate result. Some scholars believe that degree to which a person objects to a certain magnitude of vibrationwill be evaluatedby its average effect over a period of time while the other school of thought reasoned that, a person is affected at most on the peak of acceleration and tend to forget the lesser one. Nevertheless majority of the research on motion perception thresholds has
been presented in terms of RMS.
Boggs. D [2] in his study, RMS acceleration is practical to be used in evaluating human threshold perception level. This is because, the RMS value is much simpler to evaluate, and more likely to result in consistency and uniformity among various agencies engaged in predicting vibration in a proposed building, or in evaluating the vibration in an existing building.
The study on human comfort level has begun in the early 1970's. Hansen et al [3]
were the first to give subjective reason that high rise has low frequency motion. After a wind storm they perform a study on two buildings and have deduced that 2% of population could perceive motion. This is in combination of calculated top floor acceleration of two building, led to the proposal to limit the 6 year RMS acceleration to 0.005g (0.049 m/s2). Irwin [4] on one hand has calibrated his motion perception threshold (maintaining the frequency dependence) with Hansen et al's. A slight adjustment was made to use the 5 years interval instead of 6 years recurrences interval. However, both [4,5] have agreed that perception threshold level is the best
criteria to evaluate human comfort.
On the other hand, based on IS02631-2 [5] complaints regarding building vibrations in residential situations are likely to arise from occupants of building when the vibration magnitudes are slightly in excess of perception level. Although there are two different measurements on the human response, it is agreed that, vibrations is one of the main factor that influenced the human comfort in the building.
Bryan and Alex [1] also discovered that, if tall flexible structure is subjected to lateral or torsional deflections of the wind loads, the resulting oscillating motion can induce response of discomfort to the occupant which resulting to the undesirable building.
The study conducted by Denoon et al [6] which state that effects of motion on cognitive performance envisaged that if wind-induced building motion in an office environment impacts on cognitive performance, it results in a loss of productivity to the tenant with consequent financial implications. Similarly, cognitive performance deterioration in air traffic controllers during strong winds, which are some ofthe most stressful work times, could lead to a greater chance of errors being made. The study has been supported by K.C. S Kwok et al [7] in his report which has mentioned that,
prolonged exposure to vibration in wind sensitive building can cause discomfort, affect task concentration, nausea and migraine. According to Bryan and Alex the perception of building movements depends largelyon the degree of stimulation of the body's central nervous system, the sensitive balance sensor within the inner ears playing a crucial role in allowingboth linear and angular acceleration to be sensed.
Irwin [8] in his article mentioned that keeping the motions of the tower within
comfortable limit is often a biggest challenge than meeting structural strength requirements. Bryan and Alex in their study discovered that wind loading becomes significant for building over 10 stories high and progressively more with increasing
height.
It would be really expensive to build a building that would not move perceptively in
the worst storm or a severe earthquake. Consequently, since some motions are inevitable, the goal is to determine levels of motion and rates of occurrence that are both economic and acceptable to the building occupants.CHAPTER 3 METHODOLOGY
3.1 Procedure Identification
This methodology section will briefly show the pre-determined track of accomplishing the project. The project will be carried out for two semesters. The projects flows are as the flow chart below. The first three blocks are done in the first part ofthe project which is in the FYP 1.
Design is based on ASCE 7-05
Analysis on BuildingA
"" ""~ " . t t :
Analysis on Building B
Figure 1 Work Flow Chart
3.2 Research and Literature Review
The main approach of the project is to analyze the design of the high rise building focusing on the wind factor with the effect to the human comfort and later to come out with the proper design taking into account the subject mentioned. The author has been doing research on the relevantjournals and books that might be beneficial to the project. Among the journals and the books that have been selected are as the followings:
• Tall building structures: analysis and design, Bryann Stafford Smith and Alex Coull (1991)
• Acceleration indexes for human comfort in tall building, Daryll Boggs (1995)
• Human response to wind inducedmotion of building, Hansen, Robert J., Reed, John W., and Vanmarcke, Erik H. (1973)
• Human Response to Dynamic Motion of Structures, Irwin, A.W. (1978)
• ISO 2631-2; Evaluation of human exposure to whole bodyvibration (1989)
• Perception of vibration and occupant comfort in wind-excited tall buildings, K.C.S Kwok, PeterA. Hitchcock, Melissa. D. Burton (2009)
• Effects of wind induced tall building motion on cognitive performance, Roy. O. Denoon, Richards. D. Roberts, Christopher. W. Letchford, K.C.S Kwok (2000)
• Wind Engineering Challenges of the new Generation of supertall buildings, Peter A. Irwin (2009)
• FourTall buildings in Madrid; Study of Wind Induced response in Serviceability Limit State, Peter Paul Hoogendoorn, Ramon Alvarez
• ASCE70-5
• ISO 6987:1998
From the reading, the author found out that, there is few calculations approach that can be applied in the project such as:
• Simple static approach
• Dynamic methods
• Detailed analytical method
• Wind tunnel method
In the design stages, the probable motion of a planned structure can be predictedfrom a dynamic analysis. The predicted values should be verified by measured motions of the built structure so that possible problems in service may be foreseen.
The predicted accelerations and periods of vibration may then be compared with threshold curves to ascertain whether any problems are likely to be encountered. To obtain the recommended upper limit for human comfort, the acceleration is then compared with ISO 6897.
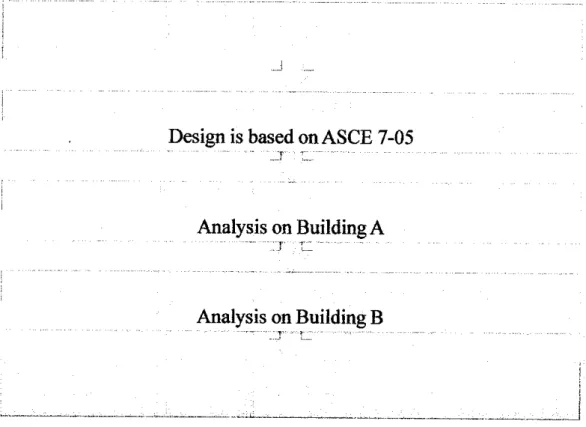
In the early design stage, the author has been using analytical procedure. Two types of buildings are being considered due to its occupancy rates. Building A is a condominium while building B is a hotel.
Figure 2 Building A and Building B
3.3 Design Procedures
The design procedures are based on ASCE 7-05 [9][ refer appendix A] for wind loads and all information and design procedure shall be referred back to the mentioned
manual.
1. The basic windspeed V and winddirectionality Kd, factor shall be
determined in accordance with section 6.5.4
2. An importancefactor I shall be determined in accordance with section
6.5.5
3. An exposure category or exposure categories and velocitypressure exposure coefficient Kz or Kh, as applicable, shall be determined for each
wind direction in accordance with section 6.5.6
4. A topographicfactor Kzt shall be determined in accordance with section
6.5.7.
section 6.5.8
5. A gustfactor G or Gf, as applicable, shall be determined in accordance
with section 6.5.8
6. An enclosure classification shall be determined in accordance with section
6.5.9.
7. Internalpressure GCpi shall be determined in accordance with section
6.5.11.1.
8. Externalpressure coefficients Cp or GCpf, orforce coefficient Cf, as applicable, shall be determined in accordance with section 6.5.11.2 or 6.5.11.3 respectively
9. Velocitypressure qz or qh as applicable shall be determined in accordance
with section 6.5.10
10. Design wind load p of F shall be determined in accordance with section 6.5.12,6.5.13, 6.5.14, and 6.5.15 as applicable.
3.4 Use of Comfort Criteria in Design
Deflection shall be determined from the value obtained from 3.3
Along wind acceleration is to be determined by using the following formula:
tfD =4jrVgprVi?(£) [1]
Cross wind acceleration is to be determined by using the following formula
aw=n02gp[WD]*^ [1]
where
p =average density ofthe building (kg/m3) At = 78.5 x 10° [ Vnl n0yfWD)3S Pa
g = acceleration due to gravity (m/sec2)
The predicted acceleration may then be compared with the threshold table [ figure to
ascertain whether any problems are likely to be encountered10
CHAPTER 4
RESULT AND CALCULATION
60.0-
R5.Q
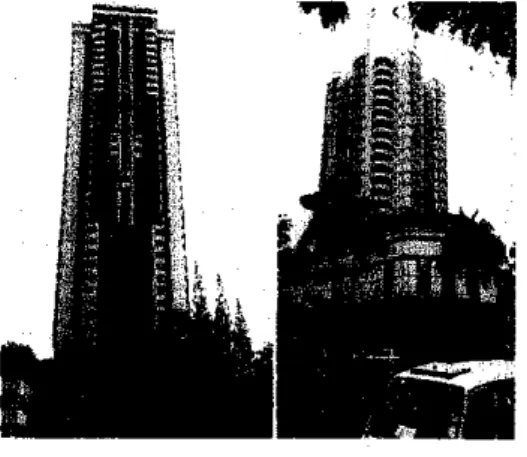
Figure 3 Dimension of Building A
4.1 Analytical Procedure for Building A
Location: Kuala Lumpur Wind Speed: 33 m/s
qz= 0.613* Kz*Kzt*Kd*V2*I Kd (refer appendix B) = 0.85
I (refer appendix C) = 1.15 (category III)
Kzt=l
Velocity Pressure Kz: (refer appendix D)
11
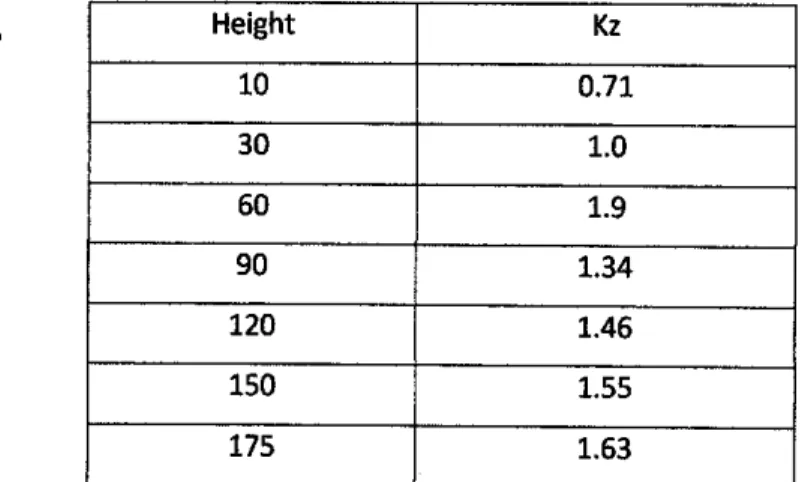
Table 1 Velocity Pressure Exposure Coefficient (Kz) According to Height for Building A
Height Kz
10 0.71
30 1.0
60 1.9
90 1.34
120 1.46
150 1.55
175 1.63
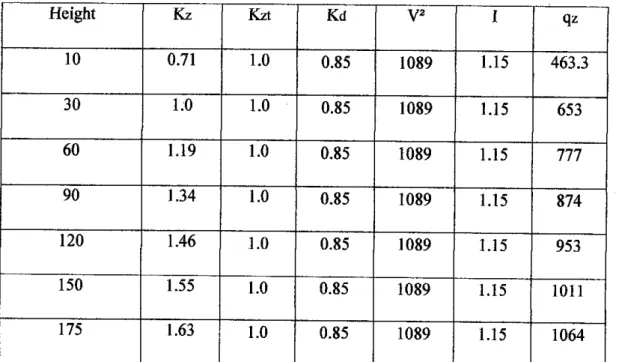
Table 2 Velocity Pressure qz Based on Height for Building A
Height Kz Kzt Kd V2 I qz
10 0.71 1.0 0.85 1089 1.15 463.3
30 1.0 1.0 0.85 1089 1.15 653
60 1.19 1.0 0.85 1089 1.15 777
90 1.34 1.0 0.85 1089 1.15 874
120 1.46 1.0 0.85 1089 1.15 953
150 1.55 1.0 0.85 1089 1.15 1011
175 1.63 1.0 0.85 1089 1.15 1064
12
4.L1 Checking Normal Period of Vibration
T- 0.1 N (by approximation)
N= 175-10 +1 4
= 42 floors
T= 0.1 (42)
= 4.2 second
F= 1/ 4.2 = 0.24 Hz (slender and flexible)
4.1,2 Gust Factor
_ 0.925 (1+1.712 Vgq Q2+gr2R2)
1+1.7 gr 11
From 6.5.8.2
gq=3.4 gr=3.4
gr=V2 In(3600m) +
0.577yj2 ln(3600 ni)
0.577
=V2 In(3600 0.24) +
V2 ln(3600 0.24) 3.677 + 0.157 = 3.834
R= fe Rn Rh Rp (0.53 +0.47 RL) [refer appendix Efor exposure constants]
„ 7.47 JVl niLz T f z \
^(1+10.3 »!)*/* whereNl=— ^=Y \^)e
= 009 _ 0.24(213.42)
26.73 = 213.59
-1.92 Vz
= 26.73
13
->©•"
Rl=i- A(l-e^)
Where RI = Rh(/* = 4.6 nl —)
Rh = 0.128
Rb = 0.402
Rl=0.18
Rb(/* = 4.6e£)
RL(/i = 15.4nlL/Vz)
R=/J Rn Rh Rp (0.53 +0.47 RL)
R=J— (0.09)(0.138)(0.402) (0.503+ 0.47 (0.18)) =0.238
UiUD
Q
Q
Gf=
—(^)
»«3(S)
= 0.774
0.925 (1+1.712 Vgq Q2+gr2R2)
1+1.1 gr 11
Gf= 0.925
Gf= 0.834
(l+1.71 (0.202)V(3.4)2(0.774)2 +(3.834)2(0.24)2)
1+1.7 (3.4)(0.202)
14
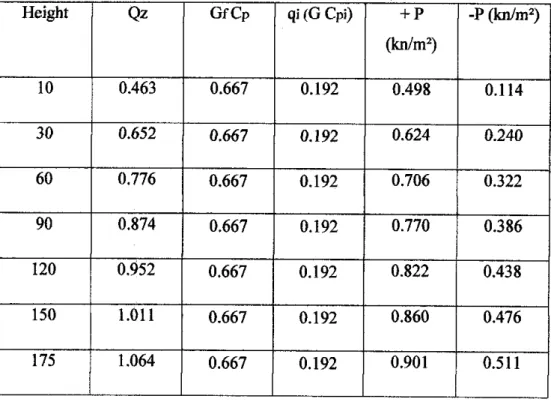
4.1.3 Design Wind Pressure P = qGfCp-qi(GCpi)
Table 3 Design Wind Load for Windward Wall based on Height
Height Qz GfCp qi(GCpi) + P
(kn/m2)
-P (kn/m2)
10 0.463 0.667 0.192 0.498 0.114
30 0.652 0.667 0.192 0.624 0.240
60 0.776 0.667 0.192 0.706 0.322
90 0.874 0.667 0.192 0.770 0.386
120 0.952 0.667 0.192 0.822 0.438
150 1.011 0.667 0.192 0.860 0.476
175 1.064 0.667 0.192 0.901 0.511
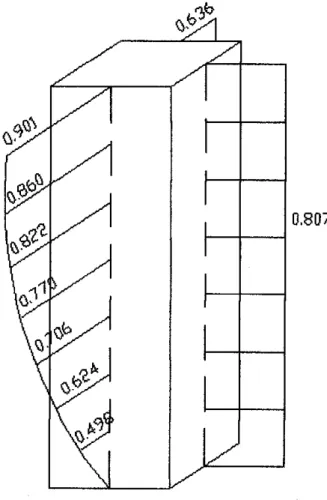
Leeward wall
P= 1.064 (-0.417) ±0.192
= 0.636 kn/m2 Sidewall
P= 1.064 ( -0.578 )± 0.192
= 0.807 kn/m
15
0.807
Figure 4 Design Windload for Building A
4.1.4 Calculating the Displacement
P = 2/3 (0.901 kn/m2 x 175 m) + (0.631 kn/m2 x 175m)
= 216.42 kn/m
T = 27T lk/m
*-£)«
=(^2) 1209600 =2707091.493 kn/m
K 3£/
3(200 X 106)
16
3EI
_ (216.42)(1753) 3(200 X 106 )(24180.53)
A = 8x 10"5m
Allowable displacement A= yl 300
= 175/300
A -0.58m
Therefore; the displacement for the building under wind force is acceptable.
4.1.5 Calculating the Acceleration
Along wind acceleration:
flD =43t2«02gp fVjRf^)
gp = 3.6 ( from appendix F) whereas it is a function of the average fluctuation rate o.
n°
o= , 0.128
Ji+b/r
B - 0.6 (from appendix G), R - 0.247
r - 0.32 ( from appendix H)
G = 0.834 (gustfactor whichhas been calculated earlier)
Of =4-t 2(0.24)2 (3.6)(0.32) V0238 (^Pj =0.0001 m/sec2
Cross wind response:
«w=«02 gp [wd] Vi jjjg where;
ar = 78.5 x 10'3[ FH/«0Vr/)]3-3Pa
ar= 78.5 x 10"3 [33/ 0.24 V40 x 60]
aT =2.365
17
aw= 0.242(3.6) [48.98] •
W V / L J (293.68)(9.8l)(VbT05),2/365, .
= 0.037 m/sec2(0.3%g) - peak value
Converting into RMS
0.037x0.707= 0.026 m/sec2
18
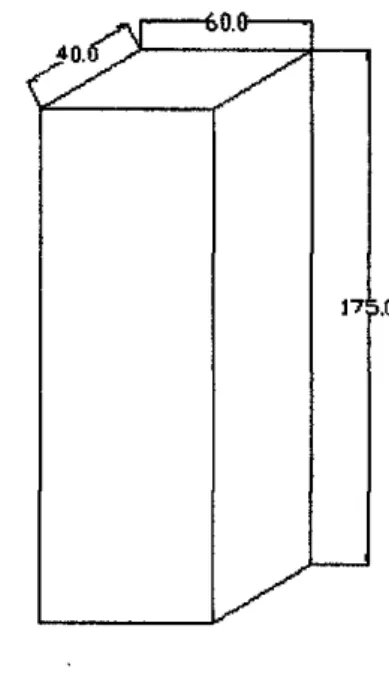
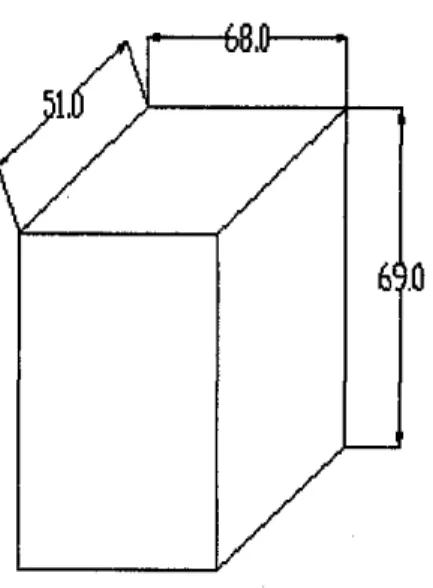
Figure 5 Sketch Figure and Dimension for Building B
4.2 Analytical Procedure for Building B
Location: Miri
Wind Speed: 30.5 m/s
qz- 0.613* Kz*Kzt*Kd*V2*I
Kd = 0.85
1=1.15
Kzt=l
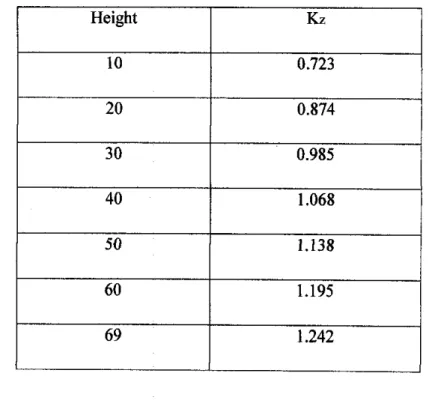
Velocity Pressure Kz: (referappendix D)
19
Table4 Velocity Pressure Exposure Coefficient (Kz) According to Height for Building B
Height Kz
10 0.723
20 0.874
30 0.985
40 1.068
50 1.138
60 1.195
69 1.242
Table 5 Velocity Pressure (qz) based onHeight for Building B
Height Kz Kzt Kd V2 I qz
10 0.723 1.0 0.85 930.25 1.15 403
20 0.874
i
1.0 0.85 930.25 1.15 487.18
30 0.985 1.0 0.85 930.25 1.15 549.05
40 1.068 1.0 0.85 930.25 1.15 595.317
50 1.138 1.0 0.85 930.25 1.15 634.336
60 1.195 1.0 0.85 930.25 1.15 666.104
69 1.242 1.0 0.85 930.25 1.15 692.306
20
4.2.1 Checking for Normal period of Vibration
T= 0.1 N (by approximation)
N=23
T=0.1(23)
= 2.3 second
F= 1/ 2.3 - 0.434Hz (slender and flexible)
4.2.2 Gust Factor
_ 0.925 (1+1.712 Vgq Q2+gr2R2)
1+1.7 grit
From 6.5.8.2
gq=3.4 gr=3.4
gr=^2 ln(3600 ni) + r-T- ^
v V2 ln(3600ni)
3.839 + 0.1503-3.986
R= 1^ Rn Rh Rp (0.53 +0.47 RL) [refer appendix Efor exposure constants]
= 0.064 =3.481 =156.62
= 19.57
Rl =i--i-(l-e2M)
0.577
Where Rl = Rh (ju = 4.6 nl ~)h
21
Rb(^ =4.6e£)
Rl(//-15.4ti1L/Kz)
Rh = 0.132
Rb = 0.133 Rl= 0.0556
R=fe Rn Rh Rp (0.53 +0.47 RL)
= 0.112
Q~ / /b+H
= 0.803
_ 0.925 (1+1.71Z Vgq Q2+gr2R2)
1+1.7 grit
Gf = 0.825
Gf Cp = 0.825(0.8) = 0.66 windward wall
= 0.825 (-0.5) = -0.42 leeward wall
= 0.825( -0.7) = - 0.58 side wall qi(GCpi) = 0.692 (-0.18)
= ±0.125
22
4.2.3 Design Wind Pressure P = qGfCp-qi(GCpi)
Table 6 Design Wind Load for Windward wall based on Height for
Building B
Height Qz GfCp qi(GCPi) + P
(kn/m2)
-P(kn/m2)
10 0.403 0.66 0.125 0.391 0.141
20 0.487 0.66 0.125 0.446 0.196
30 0.549 0.66 0.125 0.487 0.237
40 0.595 0.66 0.125 0.518 0.267
50 0.634 0.66 0.125 0.543 0.293
60 0.666 0.66 0.125 0.561 0.311
69 0.692 0.66 0.125 0.582 0.332
Leeward wall
P = 0.692 (-0.41252) ±0.125
= 0.410 kn/m2 Sidewall
P = 0.692( -0.58 ):t 0.125
= 0.525kn/m
23
Figure 6 Design WindLoadfor Building B
4.2.4 Calculatingthe Displacement
P = 2/3 (0.582kn/m2 x 69 m) + (0.410 kn/m2 x 69m)
= 55.06 kn/m
27T
T = >'
m K =
-7143190.552 kn/m sEl
K = T3"
I = 39U"i4
24
_ PL*
& — -s-rpr-
=7.708 xlO"6 m
Allowable displacement A= r 1300
= 69/300
A = 0.23m
Therefore; the displacement for the building under wind force is acceptable.
4.2.5 Calculating the Acceleration
Along wind acceleration:
tfo^TrVgpWi?^)
gp = 3.8 (from appendix F) whereas it is a function of the average fluctuation rate u.
u = no/Vl+B/R
= 0.435/V 1 + 0.7/0.112
= 0.162
B = 0.7 (from appendix G), R = 0.112 r = 0.45 (from appendix H)
G = 0.825 (gust factor which has been calculated earlier)
« =4 -i2 (0.435)2 (3.8)(0.45V0.112(7.7 x 10"6/0.825) =0.0004 m/sec2
Cross wind response:
«w=«o2gP[ra]'/^ where;
ar = 78.5xl0"3[ VH/n0^IWDf3Pa
err= 78.5 x 10"3[30.5/0.435 V51 x68]33
aT =0.1396
aw=0.242 (3.6) [48.98]
(407.89)(9.8l)(Va05)25
0.00661 m/sec2 (0.06%g) - peak value
Converting into RMS
= 0.00661x0.707
= 0.0046 m/sec2
26
CHAPTER 5 DISCUSSIONS
The lateral loading due to wind or earthquake is the major factor that causes the design of high rise building to differ from those of low to medium structures. In this
project the writer has incorporated the wind effect alone and the analysis of the
buildings has shown that, the designs of the buildings are adequate to resist the wind loading as the deflection of the building due to wind load is within the allowable deflection of the building itself.Many researches have been carried out into the important of physiological and psychological parameters that affect human perception to motion and vibration in the
low frequency tall buildings. Evidently, human response to building vibration is a complex mix of psychological and physiological factors. Prior experience, vibration expectation, habituation, personality and even job satisfaction also play an important role, which makes predicting an individual's reaction to building vibration a complex task. Since human perception and tolerance of wind-induced tall building vibration
are essentially a subjective assessment, there are significant differences anduncertainties in the building vibration acceptability and occupant comfort criteria and
the assessment methodology currently in use. So far, no consensus has been reached among the structural engineers internationally with regard to human comfort criteria.However it is generally agreed that acceleration is the predominant parameter in
determining the nature of human response to vibration.Two different measures of acceleration is being used in this project namely peak value and RMS (root mean square) value. The peak value occurs during a period of time-say 15-20 minutes- while RMS value is the averaged over this same period.
Scholars have been debating on which value isbest applied for human criteria and yet no international consensus has been achieved. The first school ofthought believe that
the degree of a person objects to a particular magnitude of vibrations best determined27
by the average effect over the period of time while on the other hand, it is reasoned that a person tend to be affected most by the largest peak of acceleration. However, the writer chose to use both values as to obtain the best result and to analyze the human comfort from every perspective
In this analysis, the author has considered the along wind response and cross wind
response as the prominent criteria to obtained the peak acceleration for thebuilding as the peak acceleration play the biggest role in human comfort criteria. Along wind
response or loading is normally due to the buffeting effect and is consist of thecomponent of the mean wind speed and fluctuating wind component. Fluctuating wind is a mixture of gusts of various sizes where large size of gust occurs less often
then the smaller gust. Smaller gust normally induced the structure to vibrate at or nearone of the building natural frequency. It gives significant dynamic load effect on the structure. Cross wind on the other hand is due predominantly to vortex shedding.
Although the maximum lateral wind loading are in the along wind direction, the maximum acceleration of the building, which is significant for human comfort, may often occur in cross wind direction. Therefore, for this project, the author has adopted the cross wind value to evaluate the human comfort criteria ofthe two buildings. The following summarizes the finding of both along wind loading and across wind
loading for both structures.Table 7 Along wind and Cross wind Acceleration
"~^\^^ Building
Wind direction\^^
A(m\sec2) B(m\sec2)Along Wind Response 4 x 10⁻⁵ 1.226 x 10"4
Cross Wind Response 6.61 x 10"3 3.7x10*
Since the along wind response value is significantly small, cross wind response is considered as the peak acceleration for the building. From the calculation, the peak acceleration obtained for building Ais 3.7 x 10"3 m\sec2 (0.37%g) while building Bis 6.61 x 10" m\sec . The result is being compared to Table 8, where both buildings are
28
categorized in range 1. From the table, human cannot perceive motion in both building during peak wind gust. Based on the result, both buildings are designed with adequate criteria of human comfort. This condition suits the commercial function of the building because the occupants will not experience the physiological and psychological effect of the wind loading that might lead to undesirable condition of the building.
Table 8 Human Comfort Criteria
Acceleration
Range (m/sec') Effect
i <o.os Humans cannot perceive motion
2 0.05-0.10 Sensitive people can perceive motion:
banging objects may move slightly.
3 0.1-0.25 Majority ot"people will perceive mo tion; level of motion may affect desk work; long-term exposure may produce motion sickness
4 0.25-0.4 Desk work becomes diflieuh or al
most impossible; ambulation sfili possible
5 0.4-0.5 People strongly perceive motion; dif
ficult to walk naturally, standing people may lose balance.
6 0.5-0.6 Most people cannot tolerate mocion
and are unable to walk naturally
7 0.6-0.? People cannot walk or tolerate mo
tion.
8 >0.85 Objects begin to fall and pcopic may
be injured
From the analysis also, the author has came outwith recommended upper limit to satisfy the comfort criteria ofthose two buildings. ISO 6897-1984 (appendix I) has been used as the guideline for this purpose. ISO 6897-1984 has proposed that the maximum value of 5 years acceleration at the top occupied floor during the 10 severest minutes ofa wind storm, as a function ofthe vibration frequency. Curve 1, represents the limit for general-purpose building whereas curve 2 represent the comfort criteria for offshore structures. For this purpose, RMS value isadopted as it
gives average magnitudes for short periods.For building A, with natural frequency of0.24 Hz, the recommended upper limits of acceleration should not exceed 0.048 m/sec2. RMS value for building Ais 0.026 m/sec2 which is smaller than the upper limits boundary. For building B, with natural
29
frequency of 0.435Hz,the recommended upper limits of acceleration should not
exceed 0.038 m/sec2. RMS value for building B is 0.00428 m/sec2 which is smaller
than the upper limit boundary. Table 9 summarizes the upper limit boundary for both buildings.Table 9 Upper Limit Boundary
Building Natural frequency (Hz)
RMS value (m/sec2) Recommended
upper limit (m/sec2)
A 0.24 0.026 0.048
B 0.435 0.00426 0.038
The upper limit boundary should be considered during the early stage of designing to avoid excessive levels of vibration under the action of wind, adversely affecting serviceability and occupant comfort.
Another approach that is being used to evaluate human comfort is by using BLTWL (Boundary Layer Wind Tunnel Laboratory). BLTWL provides maximum of 10 years value of peak acceleration for office and residential buildings. The BLTWL maximum ranges are provided in table 6 below. Peak value of both building is being compared to check on whether both building satisfy the BLTWL criteria for human comfort. Note that, a distinction is made between different building occupancy rates as a function of building's use. This reflects during a severe wind storm an office building would probably be evacuated and people will take shelter in their homes.
Table 10 Maximum 10 years Acceleration accordingto BLWTL
Range (g%)
Office 20-25
Hotel 15-20
Residence 10-15
30
Building A (residence): 0.37% g < 10-15 %g Building B (hotel): 0.0661%g < 15-20%g
From the comparison, both buildings satisfy the range of BLTWL criteria for human
comfort.
31
CHAPTER 6
ECONOMIC BENEFITS
High rise structures mainly serve the function as an occupiable space for office, residence or hotel. Millions of money is invested to build tall structure with the hope of more money in return. With increasing urbanization, high land prices in cities make ever-taller building economically viable. With the advancement of the technology, building with a lightweight material is built to reduce the overall cost of constructing the building. In short, constructing a high rise is not only to cater to
human needs, but nowadays it has become a great investment to gain more money.
Therefore, a slight fault in the design of the building might lead to the reduction in value and loss of money ofthe building.
High rise structures are exposed to the wind imposed loading. Wind has
created a variety of problems in a tall structure and has become a major concern to building owner, insurers and engineers alike. Severe windy climate is the largest
single cause of economic and insured losses due to natural disaster. The estimated annual wind disaster in the USA alone is USD 6 billion. The damage to structure and ensuing cleanup is likely to affect the market price of the property itself.
Human comfort is one of the many factors that contribute to the value of the
high rise with regard to wind imposed loading. Top floor of the building is most likely to sway as the result of the wind force and it has become the greatest concern of the top occupants of the building. Excessive motion of the building may result in the physiology and psychology effect of the occupants which may raise complaints about the building. In some other cases, workers who work on top of the floor who experienced annoyed motion might leave the workplace or cannot be able to perform
his work and this can lead to the losses of the business.
The following are examples of the buildings which have suffered great losses
financially due to the negligence in incorporating human comfort criteria in its design.32
6.1 Case study 1: John Hancock Tower, Chicago
The buildingupper floor occupants suffer from the motion sicknesswhen the building swayed in the wind. Many complaints have been raised by the occupants who forced the owner to take action to minimize the effect. To stabilize the movement, contractors installed a device called a tuned mass damper on the 58th floor. The installment of the damper has cost USD 3 millions. However, despite the damper, the building couldhave fallen over under a certain kind of swing. Therefore 1500 tons of
braced steel were added which has cost another USD 5 millions.
6.2 Case study 2: Gulf and Western Building, New York
As a result of wind stress, the 44 story building developed cracks in stairwells and
interior walls. In addition, office workers on the top floors frequently complained of
motion sickness during the windy day. To fix these problems, the owner invested USD 10millions to add massive steel braced to steady the structure.The above losses can be avoided if in the early stage of designing, human comfort
criterion is being taken into account. Tuned mass damper and massive steel bracedare among the options to solve the excessive wind motion induced to the building.
Although it cost a fortune, however, if it is planned earlier, it would save a lot more money in the future.
33
CHAPTER 7
CONCLUSIONS AND RECOMMENDATION
7.1 Conclusions
From the analysis, both buildings have satisfied the human comfort criteria. Both buildings have been categorized in range 1 where human cannot perceive motion.
Both buildings also have met the criteria of BLWTL and upper recommendation
limits for acceleration. From this analysis also, the writer proved that, building in
Malaysia do not face this kind of problem because the country doesn't face a severe windy climate.Apart from that, based on the dynamic analysis, the designs of both buildings are
adequate in resisting the wind load as there is no likelihood of excessive deflections due to lateral loading.However, although both buildings satisfy the criteria of human comfort, not many
engineers in Malaysia are aware of this aspect. Human comfort criteria should be emphasized in the early stage of the design when it comes to high structures.From the study as well, acceleration is proved to be the predominant parameter to
evaluate human threshold perception levels for human comfort criteria.34
7.2 Recommendation
It is recommended that although building in this country does not have much problem with wind load, human comfort criteria should always be considered. Engineers and designers are recommended to take into account the human comfort criteria on every design of high rise. Every engineer should be equipped with the exposure and knowledge of human comfort engineering from the early years of tertiary education.
With the advancement in construction technology and the rapid growth of tall structures, this knowledge might come in handy for the future engineers.
The writer also would like to recommend this study should be carried out in details in the future for a better understanding on the human comfort engineering generally.
Accurate result can be obtained by using appropriate software and wind tunnel testing.
35
REFERENCES
1. Tall building structures: analysis and design, Bryann Stafford Smith and alex Coull (1991)
2. Acceleration indexes for human comfort in tall building, Daryll Boggs (1995) 3. Human response to wind induced motion of building, Hansen, Robert J.,
Reed, John W., and Vanmarcke, Erik H. (1973)
4. Human Response to Dynamic Motion of Structures, Irwin, A.W. (1978) 5. ISO 2631-2; Evaluation of human exposure to whole body vibration (1989) 6. Effects of wind induced tall building motion on cognitive performance, Roy.
O. Denoon, Richards. D. Roberts, Christopher. W. Letchford, K.C.S Kwok (2000)
7. Perception of vibrationand occupantcomfort in wind-excited tall buildings, K.C.S Kwok, Peter A. Hitchcock, Melissa. D. Burton (2009)
8. Wind Engineering Challenges ofthe new Generation of super tall buildings, Peter A. Irwin (2009)
9. ASCE 7-05, Minimum Design for Buildingand Other Structures, Chapter 6 (2005) [appendix A]
10. Feblowitz, Joshua C. 2010. "Confusing The Wind: The Burj Khalifa, Mother Nature, and the Modern Skyscraper." Student Pulse Academic Journal 2.01.
Retrieved from: <http://www.studentpulse.com/a?id=124>
36
APPENDICES
37
Appendix A
ASCE 7-05
38
£
&/w^. t-..- - - er. .-.
Aim'^StkJ
Chapter 6
WIND LOADS c <•• ^ X RAL
. Buildings and otherstructures, including the Main Resisting System(MWFRS) andall components and reof, shall be designedand constructedto resist wind
;ified herein.
ed Procedures. The designwind loads for buildings uctures, including theMWFRS and component and ments thereof, shall be determined using one of the ocedures: (I) Method I—Simplified Procedure as Section 6.4 for buildings meeting the requirements rein; (2) Method 2—Analytical Procedure as speci-
>n 6.5Tor buildings meeting therequirements speci- (3) Method 3—Wind Tunnel Procedure as specified
6.
Pressures Acting on Opposite Faces of Each irface. In the calculation of design wind loads for and for components and cladding for buildings, the ti of the pressures acting on opposite faces of each
'ace shall be taken into account
mm Desji . rrmd Loading. The design wind load, by any one of the procedures specified in Sec- lallbe not less than specifiedin this section.
n Wind-Force Resisting System. The wind load to e design of the MWFRS for an enclosed or partially Iding orother structure shall not beless than 10lb/ft2 ) multiplied by the area of the building or structure toa vertical plane normal to the assumedwinddirec- sign wind force for open buildings and other struc- :not less than 10 lb/ft2 (0.48 kN/m2) multiplied by the
iponents and Cladding. The design wind pressure nts and cladding of buildingsshall not be less than eof10 lb/ft2 (0.48 kNfln2) acting in either direction
: surface.
IITIONS
ng definitions apply only to the provisions of ED: Acceptable tothe authority having jurisdiction.
TND SPEED, V: Three-second gust speed at 33 ft;
: theground in Exposure C (see Section 6.5.63) as
ei accordance with Section 65A.
"G, ENCLOSED: A buUding that does not comply irements foropenor partially enclosed buildings.
G ENVELOPE: Cladding, roofing, exterior walls.
BUILDING AND OTHER STRUCTURE, FLEXIBLE:
Slender buildings and other structures that have a fundamental natural frequency less than 1 Hz.
BUILDING, LOW-RISE: Enclosed or partially enclosed
buildings that comply with the following conditions:
1. Mean roof height h less than or equal to"60 ft (18 m).
2. Mean roof height h does not exceed least horizontal dimen
sion.
BUILDING, OPEN: A building having each wall at least
80 percent open. This condition is expressed for each wall by
the equation Aa > 0.%AS whereA = total area of openings in a wall that receives positive external pressure, in ft2 (m2)
A = the gross area of that wall jn which Aa is identified, in
' ft^m2),
BUILDING, PARTIALLY ENCLOSED: A building that
complies with both ofthe following conditions:
1. The total-area of openings in a wall that receives positive external pressure exceeds the sum ofthe areas ofopenings in the balance of the building envelope (walls and roof) by :fnore than 10 percent.
2. The total area of openings in a wall that receives positive
external pressure exceeds 4ft2 (0.37 m2) or 1percent of the
area of that wall, whichever is smaller, and the percentage ofopenings in the balance ofthe building envelope does not
exceed 20 percent.
These conditions are expressed by the following equations:
I. Aa> LlOArf
Z Aa > 4 sq f£ (u-3? ra2) or>0'°1^«. whichever is smaller, and AjAgi< 0.20
where
Aat As are as defined for Open Building
A^ =°the sura ofthe areas of openings in the building en velope (walls and roof) not including A0, in ft2 (m2) Agi = the sum ofthe gross surface areas of the building en
velope (walls and roof) not including Ag, in ft2 (m2)
BUILDING OR OTHER STRUCTURE, REGULAR- SHAPED: Abuilding orother structure having no unusualjeo- metrical irregularity in spatial form.
BUILDING OROTHER STRUCTURES, RIGID: A«dT
ing or other structure whose fundamental frequency is greater
than or equal to I Hz.
BUILDING, SlfilPLE DIAPHRAGM: Abuilding iri which both windward and leeward wind loads are transmitted through floor and roofdiaphragms to the same vertical MWFRS (e.g., no
structural separations). * •„ • •
#n^M17KFrC * XtT* / T A nnrMH. CLm*ntF ftf th* hllilH-
•jC / = product ofthe equivalentexternalpressurecoef- P ficient and gust-effect factor to be used in deter
mination of wind loads forMWFRS of low-rise buildings
QC i —product of internal pressure coefficientand gust-
?* effect factor to be used in determination ofwind
loads for buildings
gQ = peak factor for background response in Eqs. 6-4
and 6-8
gR = peak factor for resonant response in Eq. 6-8 gv = peak factor for wind response in Eqs. 6-4 and
6-8
H = height ofhill orescarpment in Fig. 6-4,-in ft (m) h = mean roof height of a building orheight ofother structure, except that eave height shall be used for roof angle $ of less than or equal to 10", in
ft(m)
he ~ roof eave height at a particular wall, or theaver age height if the eave varies along the wall / = importance factor
Ii = intensity of turbulence from Eq. 6-5 2, £3 = multipliers inFig. 6-4 toobtain K:i
Kd = wind directionality factor inTable 6-4 Kh - velocity pressure exposure coefficient evaluated
at heightz = h ...
Kz ~ velocity pressure exposure coefficient evaluated
at height z
KIt = topographic factor asdefined inSection 6.5.7 L = horizontal dimension of a building measured
parallerto the wind direction, in ft (m)
Lk = distance upwind of crest of hill or escarpment in Fig. 6-4 to where the difference in ground elevation is half the heightof hill or escarpment, in ft (m)
Li ~ integral length scale of turbulence, in ft(m) Lr = horizontal dimension of return comerforasolid
freestanding wall or solid sign from Fig. 6-20, in ft (m)
t = integrallength scale factor from Table 6-2, ft(m) H\ = reduced frequency from Eq.6-12
n, = building natural frequency, Hz
p = design pressure to be used in determination of wind loads for buildings, inlb/fi2 (N/m2) pi ~ wind pressure acting onleewardface inFig. 6-9,
in lb/ft2 (N/m2)
pael =s net design wind pressure from Eq. 6-2, inlb/ft (N/m2)
Pnttin —net design wind pressure for Exposure Batk = 30ftand/ = l.0rromFig.6-3,inlb/fr2(N/m2) pp = combined net pressure on a parapet from
Eq. 6-20. in lb/ft2 (N/m2)
ps —net design wind pressure fronrEq. 6-1, inIb/ft- (N/m2)-
p,30 = simplified design wind pressure forExposure B ath = 30 ft and I - 1.0 from Fig. 6-2, inlb/ft1
(N/m2)
pw = wind pressure acting on windward face in Fig.6-9,inIb/ft2(N/m2)
qs= velocity pressure, in lb/ft2 (N/m2)
qk = velocity pressure evaluated atheight z = h, in lb/ft2 (N/m2)
q-t = velocity pressure for internal pressure determi nation, in lb/ft2 (N/m2)
qp = velocity pressure at top of parapet,- in lb/ft2
(N/m2)
qz = velocity pressure evaluated at height 2 above ground, in lb/ft2 (N/m2)
R ~ resonant response factor from Eq. 6-10 Rb, Rh* &l = values from Eq. 6-13
Rs = reduction factor from Eq.6-16 Rn = value from Eq.6-U
s'= verticaldimensiortofthesolidfreestandingwall I
or solid sign from Fig. 6-20, in ft (m) |
r = rise-to-span ratio for arched roofs
V= basic windspeedobtainedfromFig.6-l,inmi/h (m/s). The basic wind speed corresponds to a 3-s gust speed at 33 ft(10 m) above ground in exposure Category C
V{ = unpartitioned internal volume ft3 (m3)
Vt = mean hourly wind speed atheight z,ft/s (m/s) W= width of building in Figs. 6-12 and 6-14A andB and width of span in Figs. 6-13 and 6-15, ' ' Mri'ft(m) *•'
X = distance to center of pressure from windward edge in Fig. 6-18. in ft (m)'
jc = distance upwind or downwind of crest in Fig. 6-4, in ft (m)
z = height above ground level, in ft(m) z= equivalent height ofstructure, inft (m)
zs ~ nominal height of the atmospheric boundary
layer used in this standard. Values appear in
Table 6-2
exposure constant from Table 6-2
3-s gust-speed power law exponent from Table
6-2
a = reciprocal of a from Table 6-2
a = mean hourly wind-speed power law exponent in Eq.6-14 from Table 6-2
fl —damping ratio, percent critical for buildings or
other structures
e = ratio of solid area to gross area for solid free standing wall, solid sign, open sign, face of a
trussed tower, or lattice structure
X= adjustment factor for building height and expo sure from Figs. 6-2 and 6-3
€ = integral length scale power law exponent in Eq.6-7 from Table 6-2
ij = value used in Eq. 6-13 (see Section 6.5.8.2)
9= angle of-plane of roof from horizontal, in de
grees
v= height-to-width ratio forsolid sign
;.4 METHOD 1—SIMPLIFIED PROCEDURE
Al Scope. Abuildingwhosedesignwindloadsaredewrrmned
'rain a
Lcs, shall be designed using recognized literature
gsuch wind load effects or shall use the wind tunnel pecified in Section 6.6.
eldin». There shall be no reductions in velocity pres-
apparent shielding afforded by buUdings and other
r terrain features.
Permeable Cladding. Design wind loads deter-
iSection 6.5 shall be used for air permeable cladding roved test data or recognized literature demonstrate Is for the type of air permeable cladding being
>n Procedure.
basic wind speed Vand wind directionalityfactor Kd
I be determined inaccordance with Section 6SA.importancefactor Ishall be determined in accordance
t Section 6.5.5.
exposure category or exposure categories and velocity
•sure exposure coefficient Kz or Kk, as applicable, shall
letennined for. each wind direction in accordance withtion 6.5.6.
jpographic factor KIt shall be determined in accor-
ce with Section 6.5.7.
ust effectfactor Gor Of, as applicable, shall be deter-
ed in accordance with Section 6.5.8.
enclosure classification shall bedetermined in accor-
ce with Section 6.5.9.
rnat pressure coefficient GCpi shall be determined in
ordance with Section 6.5.11.1.
ernatpressure coefficients Cp or GCp/t orforce coeffi- us Cf, as applicable, shall be determined in accordance
hSection 6.5.II .2 or 6.5.11.3, respectively.
ocity pressure q, or qh, as applicable, shall be deter-
icd in accordance with Section 6.5.10.
rign wind load p or F shall be determined in accor- ice with Sections 6.5.12,6.5,13,6.5.14, and6.5.15, as
dicable.
ic Wind Speed. The basic wind speed, V, used in nination of design wind loads on buUdings and other shall be as given in Fig. 6-1 except as provided in
i.5.4.l and 6.5.4.2. The wind shall be assumed to come horizontal direction.
jecial Wind Regions. Thebasic wind speed shall be in here records orexperience indicate that the wind speeds
•than those reflected inFig. 6-1. Mountainous terrain,
dspecial regions shown in Fig.6-lshaHbeexamined for
'ind conditions. The authority having jurisdiction shall,try, adjust the values given inFig. 6-1 to account for
al wind speeds. Such adjustment shall be based on me al rnformation andanestimate of thebasicwind speed in accordance with the provisions ofSection 6.5.4.2.stimation of Basic Wind Speeds from Regional Data. In areas outside hurricane-prone regions, re-
imatic data shall only be used in lieu of the basic sds given in Kg. 6-1 when (i) approved extreme-value -analysis procedures have been employed in reducing
•xnA n \ the lontrth nf wrnrri camnlin? error. aVeraeUlB
the anemometer have been taken into account. Reduction in basic I
wind speed below that of Fig. 6-1 shall be permitted. I
In hurricane-prone regions, wind speeds derived from simula
tion techniques shall only be used in lieu of the basic wind speeds oiven in Fig. 6-1 when (1) approved simulation and extreme value statistical analysis procedures are used (the use ofregional wind
speed data obtained from anemometers is not permitted to define
the hurricane wind-speed risk along the Gulf and Atlantic coasts, the Caribbean, orHawaii) and (2) the design wind speeds result
ing from the study shall not be less than the resulting 500-year return period wind speed divided by VL5.
In areas outside hurricane-prone regions, when the basic wind
speed is estimated from regional climatic data, the basic wind speed shall be not less than the wind speed associated with an annual probability of 0.02 (50-year mean1 recurrence interval),
and the estimate'shall be adjusted for equivalence to a 3-s gust
wind speed at 33 ft (10 m) above ground in exposure Category C. The data analysis shall be performed in accordance with this
chapter.
6.5.43 Limitation. Tornadoes have not been considered in de veloping me basic wind-speed distributions.
6.5.4.4 Wind Directionality Factor. The wind directionality
factor, Kd, shall be determined from Table 6-4. This factor shall only be applied when used in conjunction with load combinations
specified in Sections 2.3 and 2.4.
6.5.5- Importance Factor. An importance factor, /.for the build ing or other structure shall be determined from Table 64 based on building and structure categories listed in Table I-1.
6.5.6 Exposure. Foreach wind direction considered, the upwind exposure category shall be based on ground surface roughness
that is determined from natural topography, vegetation, and con
structed facilities.
6.5.6.1 Wind Directions and Sectors. For each selected wind direction atwhich the wind loads are to be evaluated, the expo sure ofthe building orstructure shall be determined for the two
upwind sectors extending 45° either side of the selected wind di rection. The exposures in these two sectors shall be determined
in accordance with Sections 6.5.6.2 and 6.5.6.3 and the exposureresulting in the highest wind loads shall be used to represent the
winds from that direction.
6.5.6.2 Surface Roughness Categories. A ground surface
roughness within each 45° sector shall be determined for adis tance upwind of the site as defined in Section 6.5.6.3 from the categories defined in the following text, for the purpose ofassign ing an exposure category as defined in Section 6.5.6.3.
Surface Roughness B: Urban and suburban areas, wooded ar eas, or other terrain with numerous closely spaced obstructions having the size ofsingle-family dwellings or larger.
Surface Rouahness C: Open terrain with scattered obstructions
having heights*generaUy less than 30 ft (9.1 m). This category includes flat open country, grasslands, and aU water surfaces in
hurricane prone regions:
Surface Roughness D: Flat, unobstructed areas and water sur
faces outside hurricane prone regions. This category includes smooth mud flats, salt flats, andunbroken ice.6.5.63 Exposure Categories