Micheal Drieberg who guided and advised the author in every possible way from the beginning to the end of the project. Chow Weng Sum from the Department of Geosciences, for his assistance in geological knowledge and recommendations throughout the project. Last but not least, I thank all the parties who have involved or help the author on the way to the completion of this project.
To solve this, this project will develop a wireless network system (WSN) for landslide early warning, which will alert the potential of landslides for further action and mitigation. The effectiveness and robustness of the system will also be evaluated throughout the project via a slope model and data acquisition in Moteview software.
Introduction
- Background Study
- Problem Statement
- Objectives
- Scope of study
Today, there is still no clear description of the relationship between landslide physical factor, which can be used to trigger alarm for dangerous level landslide alarm. Because of this, we need a maintenance-free technology that can be placed in the design area and able to monitor the slope of the hills all day long. The main objective of this project is to come out with a wireless sensor network (WSN) technology which can provide an early warning system for landslide activities.
To develop a wireless sensor network that can dynamically respond to early landslide signs of impending landslide. Based on the reading, early warning sign should be able to be reported to the base station for monitoring and early warning if needed.
Literature review
- Overview of landslide
- Landslide theory
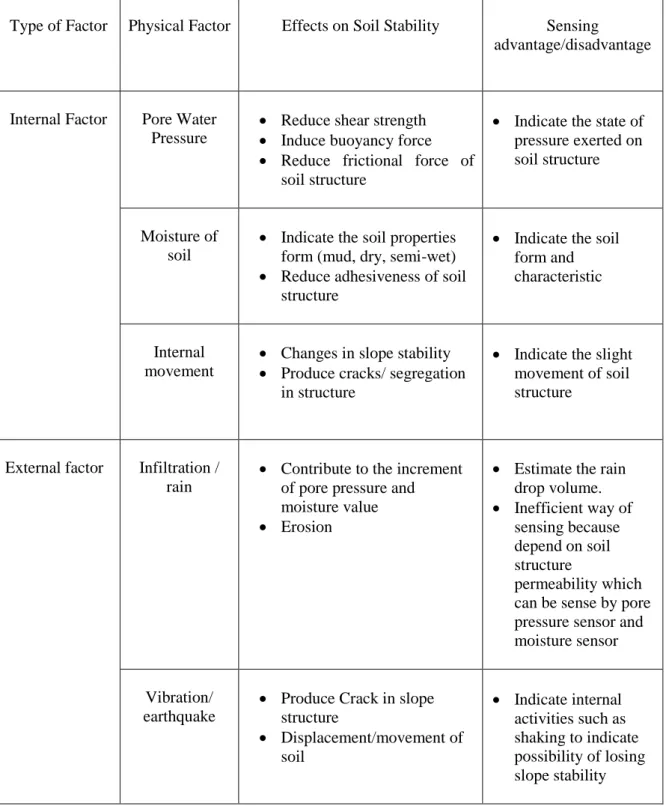
- Landslide triggering factors
- Internal factor
- External factor
- Current technology
- Landslide Mitigation in Malaysia
- Wireless remote sensing
- Conclusion
Landslides are classified into different types based on the speed of the process and the failure characteristic. The water pressure in the pores also caused a buoyant effect on the shear strength of the soil structure. A pore water pressure meter or a pore pressure transducer can be used to measure the pore water pressure.
Ground movement can also be considered as an internal factor of landslides as it can occur naturally. One of the techniques is resistive imaging (RI), which can be used to map rock layer thickness, water content, and see the internal structure of the slope [16].
![Figure 1: Number of landslide incident in yearly based [7]](https://thumb-ap.123doks.com/thumbv2/azpdforg/10276502.0/16.892.228.753.108.396/figure-1-number-landslide-incident-yearly-based-7.webp)
Methodology
Tools and software
Gantt chart
Key milestone
Result and Discussion
Sensors selection
Strain gauge will be used to detect internal movement, whereby the detection will be based on the resistance increment on the strain gauge as force is applied. Pore water pressure has been found to be the most important factor in causing landslides when it rains or broken underground drainage. The water that filled the pores underground induced force which leads to uplift or buoyancy in the underground soil which will cause independent of effective stress between soil particles.
In construction near hilly area, there are specifications set about the limit of vibration for spare development. Suitable sensors have been selected and are still undergoing the process to purchase from supplier and to be evaluated when the stock is ready. Proper termination of the MDA300 sensor board will be done to configure the detection mechanism and output to be displayed in Moteview software.
In order to select the appropriate sensor, in-depth understanding of the landslide factor and behavior is required. The sensor selection process must meet the third objective of this project, which is to provide affordable technology for imminent landslide monitoring instrument and system, plus it must be easy to maintain and install in the respective area. Three sensors were successfully collected due to low cost and meeting the factor requirement.
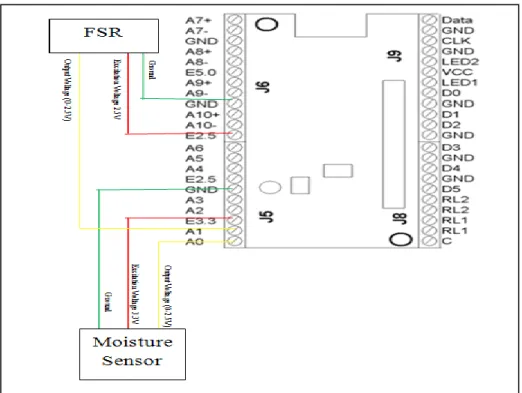
There is moisture to measure volumetric water content (VWC) in the soil, resistive force sensor (FSR) to detect subsoil deformation or forces, and vibration sensor to detect any form of vibration-producing activity that may cause the stability of the soil to decrease. slope. . Somehow, for this project the pore water pressure transducers and vibration sensors are not made available because the price is too expensive and not affordable. Due to this cost limitation, the application of the pore-water pressure transducer is not included in the prototype, but the working principle and purpose is the study for future work and product development.
Development of Wireless Sensor Network
- Software Installation and Programming Manual
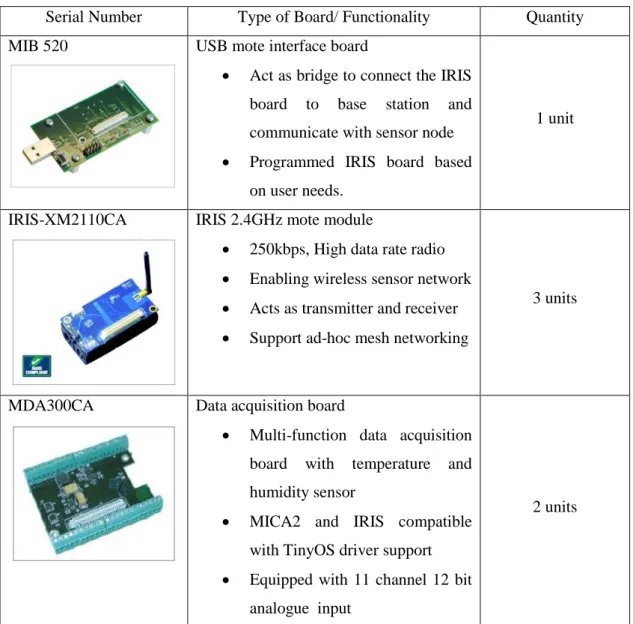
Connect the base station (MIB520) together with the USB module to IRIS on the PC. MoteView2.0 software will not work if MIB520 is not connected). Click setting to configure the USB port and board used in the system, set the details as shown in the picture. After configuring the interface board setting, the IRIS Weather is ready to be programmed via the USB interface board.
IRIS folder" and select the folder "XMeshBase" for the Base Station Program or "MDA300" for the Sensor Node. After selecting the files, click the "Program" button to start programming the Sensor Node or Base Station. To program the Sensor Node sensor, replace the IRIS board which is already programmed as a base station and connect the new IRIS board to the MIB520 USB interface.
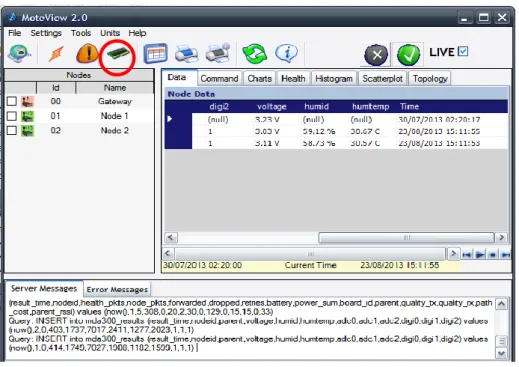
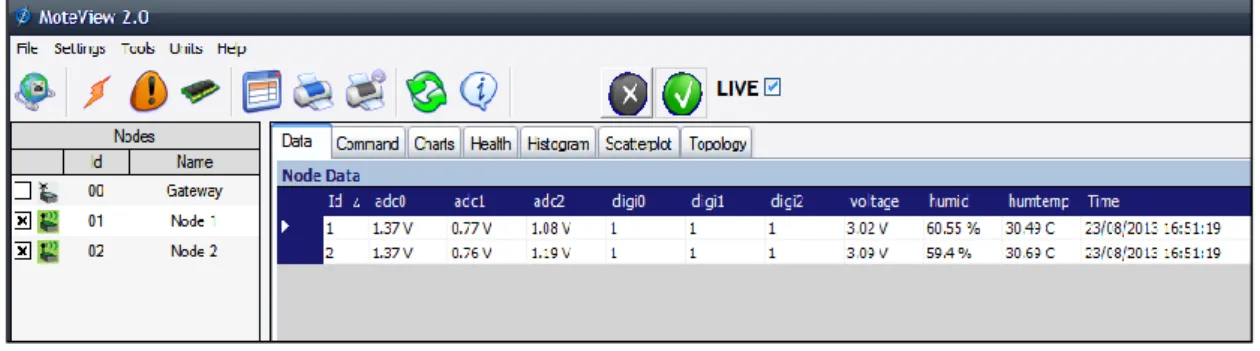
After clicking the "earth symbol", "Connect to WSN" windows will pop up and set the setting as follows, and click "Next". After clicking done, WSN communication should be established automatically if sensor nodes are not found, add node by node column in MoteView.20 windows and click "update symbol". The process of WSN development is done by software installation on computer with several requirements to be followed to ensure successful installation.
One base station and two nodes are successfully configured with a special attribute or identity to ensure that the IRIS node can communicate to perform tasks as a base station and sensor node. If the configuration process is successful, the node's IRIS card modules will be integrated with the MDA 300 sensor card, with the humidity and temperature sensor built into the card. To ensure successful integration of the MDA 300 and the IRIS module, the Moteview GUI is supposed to display the measurement of moisture and humidity, as shown in Figure 10 in Chapter 4.
Data Acquisition
The data in Moteview is also available to be displayed in the form of diagram, histogram and scatter plot. The data can also be saved for history data for inspection and also investigation purposes.
Sensor integration with MDA 300 sensor board
- Moisture sensor
- Force resistive sensor
- Vibration Sensor
- Pore-water Pressure sensor
This equation will be substituted as a constant coefficient (Figure ) in a straight line to meaningfully read the data after the raw data in millivolt output. When a force is applied to the sensor, the resistance value will decrease according to the applied force. Since the resistance value did not decrease linearly; FSR is not suitable for this.
From the Moteview data configuration, the output is given in voltage value, so the increase in decrease of the voltage output depending on the resistance value changes in FSR. The resistance values for the applied forces are not linear in form, which made it difficult to set up the equation for the curve characteristic, so the Motewiew interface provides a lookup table function to replace the value and the calculation will provide the output based to the average value of two consecutive true values. The vibration transducer from ASSEMtech (Figure 33) is chosen to monitor underground vibrations in the slope area.
Pore water has a significant impact on slope stability in the same way as soil moisture. This result shows that the moisture level indicates for different soil types is almost the same depending on the amount of water dissolved/absorbed by the soil. 46 fitting as shown in Figures 28 and 29, the VWC value can be configured based on the raw data (millivolts) to replace the equation.
Force resistive sensor (FSR) is a very basic sensor to indicate force exerted on the area. This type of sensor is not suitable to be used in the approximate measurements due to the degradation of the resistance per applied forces are not linear. Due to cost limitation and time-consuming procurement processes on the supplier side.
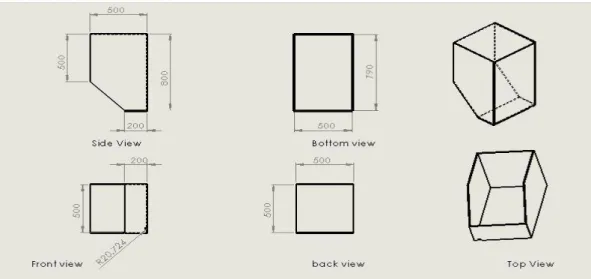
Slope model development and testing
The slope container must be able to support the weight of the soil sample. Plus, when the soil is flooded with water, the weight can be doubled from dry soil. A hole is made in the front of the box to allow excess water to drain from the container.
A test was conducted to verify the responsiveness of the system and sensor installation on the slope model. The housing and position of the sensor on the ramp model are as shown in Figure 43 and Figure 44. To replicate the water absorption and flow process, water is poured from the tab to the ramp model several times.
While adding water, the sensor reading is continuously monitored to monitor changes in the reading as the soil becomes wet. Somehow the alert is not triggered yet because the volumetric water content has not reached 0.35 as set in the alert manager. 49 slope pattern that caused water seepage occurred at high speed, and there is a blurred pattern that was made by hand.
Nevertheless, the increase in reading proved the response of the moisture sensor in the system. As the purpose of the sensor is to indicate any force exerted, the work cannot be done due to the condition of the soil at the high porosity level and produces a lot of hole inside the hole as it is not compact in comparison with the actual slope. Since the limit of the warning set in the warning manager for VMC is 0.35VMC and for FSR is when the reading reaches 0.5V, the warning warning is output indicating the state of the data received.
Recommendation
Conclusion
Appendix
Appendix 1
Appendix 2
![Figure 2:Heavy rain cause the landslide in form of mud flow following the alluvial fan at Camuri Grande, Vargas, Venezuela [8]](https://thumb-ap.123doks.com/thumbv2/azpdforg/10276502.0/16.892.257.702.452.758/figure-landslide-following-alluvial-camuri-grande-vargas-venezuela.webp)
![Figure 3: The debris flow hit the pile foundation of Highland Tower landslide caused 2 blocks of tower to collapse [2]](https://thumb-ap.123doks.com/thumbv2/azpdforg/10276502.0/17.892.259.698.103.451/figure-debris-foundation-highland-tower-landslide-caused-collapse.webp)
![Figure 4: landslide cross section sample [14]](https://thumb-ap.123doks.com/thumbv2/azpdforg/10276502.0/19.892.272.688.109.381/figure-4-landslide-cross-section-sample-14.webp)
![Figure 5: Landslide triggering database in Italy [5]](https://thumb-ap.123doks.com/thumbv2/azpdforg/10276502.0/20.892.242.709.104.405/figure-5-landslide-triggering-database-in-italy-5.webp)
![Figure 6: Landslide contributing factors[15]](https://thumb-ap.123doks.com/thumbv2/azpdforg/10276502.0/20.892.209.741.633.1091/figure-6-landslide-contributing-factors-15.webp)
![Figure 7: Landslide triggering factors [15]](https://thumb-ap.123doks.com/thumbv2/azpdforg/10276502.0/21.892.297.666.462.758/figure-7-landslide-triggering-factors-15.webp)
![Figure 9: Testing flow procedure based on Landslide risk assessment and mitigation strategy flow chart [5]](https://thumb-ap.123doks.com/thumbv2/azpdforg/10276502.0/31.892.340.625.111.487/figure-testing-procedure-based-landslide-assessment-mitigation-strategy.webp)