To the best of my knowledge, the matter contained in the thesis has not been submitted to any other university/institute for the award of any degree or diploma. Agarwal, Head of the Department of Chemical Engineering for his encouragement, patience and ingenuity throughout the development of this project. Adsorption and desorption studies were performed for 4 samples with the highest adsorption capacity reported as 11.09 mL/g carbon and the lowest as 5.15 mL/g at 30°C.
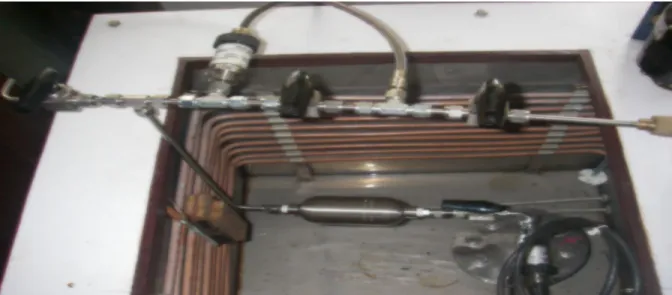
The effect of particle size was studied by considering samples of 150µm, 650µm and 850µm and it was found that adsorption capacity decreased with increase in particle size. Regarding the effect of pH, the adsorption capacity was highest for acidic media followed by alkaline media and neutral media. 2 Photo of the manufactured experimental setup (Top view) 21 3 CO2 sorption properties on different coal samples 26.
List of tables
Introduction
Introduction
- Global warming and CO 2 level in atmosphere
- Methods to reduce CO 2 level in atmosphere
- Coal as a geological sink
- Factors affecting CO 2 adsorption on coal
- Objective of the project
- Literature Review
The nature of the coal will determine the maximum adsorption capacity under a given set of conditions. The amount of CO2 adsorbed on the coal will depend on the physical and chemical reactions between the coal and the CO2. Parameters such as temperature, pressure, particle size and pH are expected to have a fair to large influence on the adsorption of CO2 on the coal.
The organic fraction of coal is believed to capture CO2 using surface adsorption, pore filling, and solid solution. The nature of the coal will determine its absorptive capacity, but the dynamic nature of the sequestration environment will determine the extent to which that capacity can be realized. Finally, the concept of the characteristic curve is used for CO2 absorption data in order to predict isotherms at new coal seam temperatures.
Literature Review
- Comparison of sorption characteristics on different coals
- Effect of temperature on CO 2 adsorption
- Desorption studies
- Binary mixtures of gas sorption behavior on different coals
- Isotherms
- Langmuir isotherm
- BET isotherm
- Polanyi’s potential theory of adsorption isotherms
- Materials & Methods
Ekrem Ozdemir et al., 2004, performed CO2 adsorption and desorption isotherms on Argonne dried premium coal samples. Wang Zuo-tang et al., 2009, experimentally studied the adsorption and desorption of carbon dioxide, methane and other gases on Zhonglisshan coal. Every et al., 1972, conducted experiments to find the ability of carbon dioxide, helium and air to displace methane from pulverized coal.
Andreas Busch et al., 2003, studied the methane and CO2 sorption and desorption measurements on dry Argonne premium coal sample with pure gas components and mixtures. Chaback et al., 1996, observed the simulation study of ECBM with pure CO2, N2 and their mixtures. Wolf et al., 1999, conducted laboratory and simulation studies to study the enhancement of methane production by injecting the carbon dioxide into the Belgian and German coals.
Saunders et al., 1985) used a stagnant system to study the adsorption of H2-CH4 mixtures on Pittsburgh bituminous coal at temperatures varying from 220°C to 2070°C and pressures up to 4.1 MPa. Ideal adsorption solution theory failed to predict the pure component of the isotherm. Stevenson et al., 1991) studied the adsorption isotherm for binary, ternary mixtures of methane, carbon dioxide and nitrogen on dry samples of Australian coal at 300C and pressure up to 5.23Mpa. Harpalani et al., 1993, studied the neat adsorption of methane, carbon dioxide, and ternary gas mixtures containing 93% methane, 5% carbon dioxide, and 2% nitrogen on wet Fruitland coal from the San Juan Basin at 1120 F and above. to a pressure of 10.35Mpa.
Greaves et al., 1993, studied the sorption characteristics using Sewickley carbon samples at 22.7°C and up to a pressure of 6.9 MPa. Hall et al., 1992 performed significant sorption tests with wet Fruitland coals at 1150F and pressures up to 1800Psi. Busch et al., 2003, performed adsorption studies with mixtures of methane and carbon dioxide on dry and moisture-equilibrated coals of different rank, composition of different European coals.
In 1938, Brunauer et al., modified some of the assumptions of Langmuir model and provided an extended Langmuir model for multilayer adsorption commonly known as the Brunauer, Emmet and Teller (BET) model.
Materials& Methods
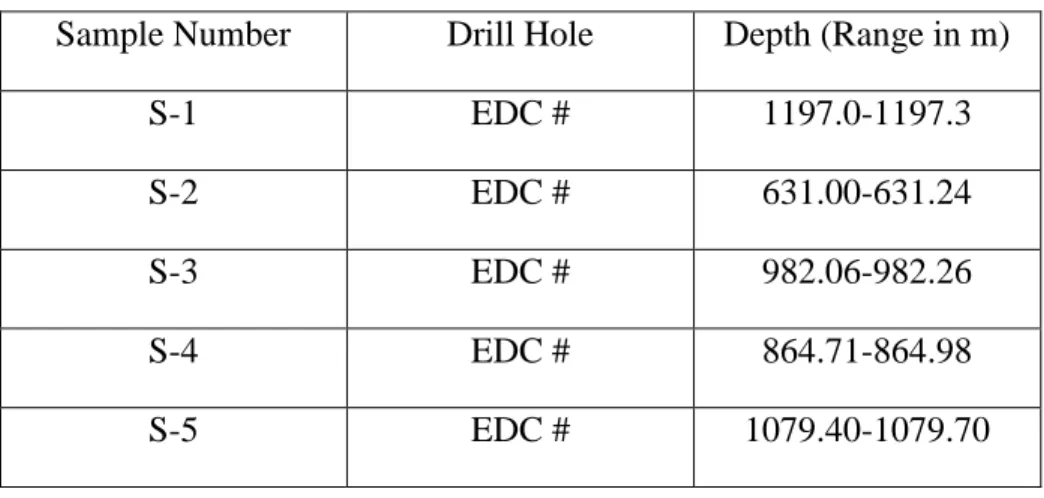
- Coal samples and preparation
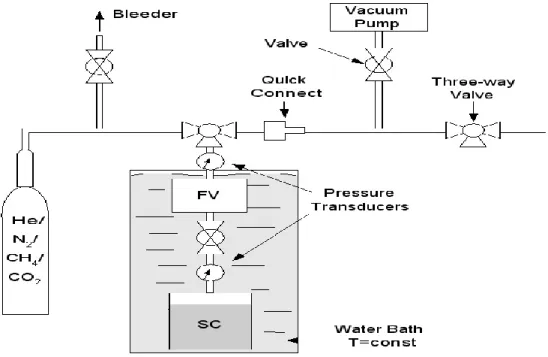
- Experimentation
- Procedure
- Measurement of pure gas
- CO 2 sorption calculations
- Modelling of carbon dioxide adsorption data
- Characteristics Curve
- Results & Discussions
The pressure transducer helps measure the pressure in the sample chamber as well as the reference chambers. It was necessary to estimate the void volume in the sample cell very accurately to determine the volume of gas adsorbed with limited error. A minor error in the void volume measurement can lead to significant error in the estimation of sorbed gas.
In the fabricated setup, the void volume consisted of the adsorbent pore volume, voids between the particles, and the free volume reaching up to the valve. Initially, the helium gas used in the void volume measurement was vented from both cells. Now the pressure of the sample cell (Ps1) and reference cell was recorded through the pressure transducer connected to the data acquisition system and reflected in the computer screen attached to it.
The sample cell was isolated from the reference cell by closing the valve in the middle. The valve between the sample and the reference cell is opened and the gas from the reference cell flows into the sample cell and is absorbed into the sample. To calculate the moles of gas that adsorbed on the coal samples in the sample cell, it was necessary to calculate the number of moles of gas that left the PV and the number of moles of gas that appeared in the SC as free gas in the void volume. .
Now to obtain the desorption steps, the gas in the PV was first released with 150 units and the pressure was recorded after equilibrium was reached. The same procedure was repeated until the minimum pressure was present in the sample cell and the desorption isotherm was plotted. The adsorption data were collected by the DAS with compatible software installed on a PC. The adsorbed volume was determined at a constant temperature (300C, 400C & 500C) as a function of pressure at equilibrium.
The difference in the total amount of gas (nT) introduced into the void space of the sample cell (SC) and the amount of free gas occupying the void space (nf) in the sample cell gives the amount of absorbed gas (na) in number of spots.
Results & Discussions
Geochemistry
Adsorption capacity
Effect of coal depth on adsorption capacity
Desorption studies
However, hysteresis has been reported for CO2 sorption on coals (Ozdemir et al explained that this hysteresis could be attributed to a metastable sorbent/sorbate system that prevented releases of gas with decreasing pressure during desorption. Various isotherms for adsorption of gases on solids have been analyzed using different approaches such as Langmuir theory, BET theory, Polanyi's potential theory.The experimental data were used to model the adsorption kinetics using Langmuir model using equation 2.
Langmuir parameters were calculated by linear regression analysis of experimental data using SPSS 13.0. D-R and D-A parameters were estimated by linear regression analysis and non-linear regression analysis respectively using SPSS 13.0 using equation (5,6) presented in Table 5. Comparisons of experimental data with all isotherm models such as Langmuir, BET, DR and D-A with respect to each sample are shown in Figure (8-11).
R parameters
A parameters
- Effect of particle size
- Effect of pH
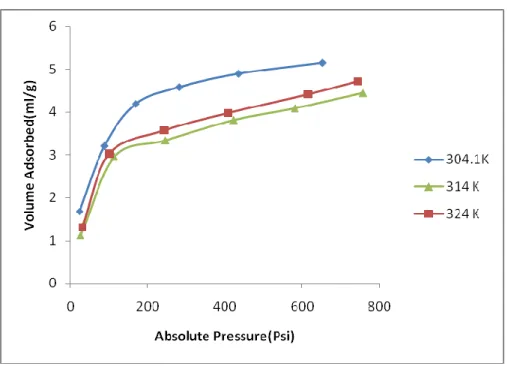
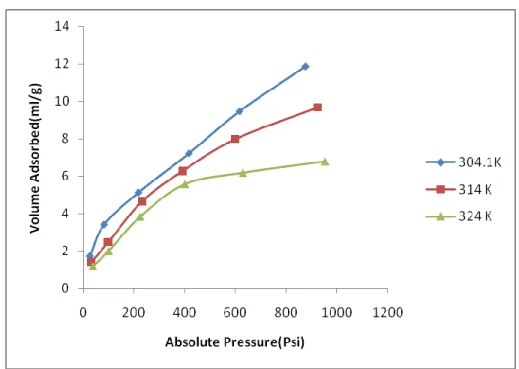
- Effect of Temperature on adsorption capacity
The percentage of Absolute Residual Error (ARE) was used to calculate the percentage deviation of the experimental results from the theoretical models discussed above. From the ARE results, it can be observed that the Langmuir model has the highest residual error and D-A has the lowest possible error. The subsequently calculated values correspond to the value of excess Gibbs' moles adsorbed given by nGibbs. The comparison between volume calculated from Gibbs and absolute values is shown fig (12-15).
As illustrated in Table 9, it can be observed that %JA have increased in all cases. It is observed that the volume of absorbed gas increased with increasing pressure in all cases. From figure 16 it can be observed that the smallest particle size (150µm) absorbs more than the largest particle size (850µm).
From the results, we concluded that the smaller particle size had a higher adsorption rate compared to the larger particle size. From fig. 17 it can be clearly seen that the sorption capacity increased with both acid and base medium than with the untreated sample. This is because some of the acid/alkali dissolves minerals present inside the coal during the treatment process, increasing the available pore volume and thus increasing the adsorption capacity compared to the untreated sample (A.S.Azmi et al., 2006).
This may be due to the change in the physical properties of coal at higher temperatures. Their experimental results show that the effect of temperature on the sorption capacity of Argonne Premium Upper coals from California. They noted that increasing temperature decreases the sorption capacity of the Malaysian coal samples.
This is because at higher temperatures the kinetic energy of the molecules of both the solid and the gas, given by the Boltzmann equation, is higher. The comparison of the experimental values with those obtained from the characteristic plot is shown in Figs 27, 29, & 31 at 20oC. It can therefore be concluded that this characteristic plot can be extensively used to predict the experimental data at new temperature provided it is below the critical temperature of the gas.
Conclusions
Conclusion
Dubinin Astakhov et al., 1995: “A modified approach for estimating pseudo-vapor pressures using the Dubinin Astakhov equation”; carbon; vol. Viete et al., 2006: “Effect of CO2 on Geomechanical and Permeability Behavior of Lignite: Implications for Coal Bed CO2 Sequestration”; International Journal of Coal Geology; Vol.66, P. Every R.L et al and L.Delloso et al, 1972: "Deep coal bed methane in Alberta, Canada: A Fossil resource with the Potential of Zero Greenhouse Gas Emissions": Energy Conversion Management, Vol.38 ( addn.), pp. 217-222.
Gunter et al., 1997: “Deep Coal Bed Methane in Alberta, Canada: A Fossil Resource with Zero Greenhouse Gas Emission Potential”; energy conversion management, Vol.38, P.217-222. Rezni et al., 1984: “An analysis of the effect of CO2 injection on in-situ methane recovery from bituminous coal: An experimental simulation”; SPE Journal; Vol.24, P.521-528. Speight et al., 1994: "Coal Chemistry and Technology"; Second edition, revised and enlarged, Marcel Dekker, Inc, New York.
Stevenson et al., 1991: "Adsorption/desorption of multicomponent gas mixtures under indoor conditions": SPE 23026, presented at SPE Asia-Pacific Conference, Perth, Western Australia. Gunter et al., 1998: “Large CO2 Sinks: Their Role in Greenhouse Gas Mitigation from an International, National (Canadian) and Provincial (Alberta) Perspective”;. 1979) Handbook of Chemistry and Physics.