ISSN 2599-1280 (Online); ISSN 2599-2449 (Print) http://ejournal.iikmpbali.ac.id/index.php/BHJ
ASPECT STUDY ON CARBON DIOXIDE (CO
2) FLUX IN THE
GLOBAL OCEAN USING SATELLITE
I Wayan Karyawan
Program Studi Kesehatan dan Keselamatan Kerja, Institut Ilmu Kesehatan Medika Persada Bali
ABSTRAK
Latar Belakang: Peningkatan dari CO2 di atmosfer dan berpotensi menghasilkan pemanasan global telah menjadi suatu
perhatian besar pada umat manusia. Sepertinya sangat sulit untuk melaksanakan pengamatan atas CO2 perubahan terus
menerus antara udara-laut. Samudra berisi lebih dari lima puluh kali karbon di atmosfer dan dapat sebagai penyangga yang membatasi konsentrasi CO2 di dalam atmosfer. Perubahan terus menerus Gas CO2 antara udara dan samudra adalah
konsentrasi CO2 di dalam samudra dikendalikan oleh proses fisika, kimia dan biologi. Dengan perbedaan konsentrasi CO2
udara-laut terjadi pertukaran konsentrasi gas CO2 antara udara-laut, yang kaya nutrien. Metode: Data dari WOCE ship
dianalisis dengan linier regresi, Y = ax – b , sehingga R2 dapat ditentukan koefisiennya, dihitung menggunakan program math lab, Net sea-air CO2 Flux sehingga perubahan Gas CO2 terus menerus dapat dihitung dengan Rumus : F = K ΔPCO2.
Tujuan: Mendeteksi hubungan perubahan terus menerus gas CO2 dengan pemanasan global dan mendeteksi perubahan
tekanan CO2 (pCO2) yang berhubungan dengan perubahan iklim. Hasil: PCO2 di dalam perairan permukaan samudra yang
global bervariasi secara musiman, di atas suatu cakupan yang luas dan di bawah kontrol pCO2 di atmosfer sampai sekarang.
Efek pemanfaatan biologi CO2 adalah membedakan perubahan temperatur musiman. Amplitudo air permukaan yang
musiman pCO2 di dalam perairan di garis lintang tinggi pada daerah kutub pada garis lintang 40o dan katulistiwa efek biologi
mempengaruhi, daerah yang hangat/ dingin dipengaruhi oleh temperatur. Efek ini adalah sekitar 6 bulan pergeseran fase. Maka, sepanjang batasan-batasan antara dua rejim ini, cenderung untuk batal satu sama lain, membentuk suatu zone pCO2
amplitudo kecil. Dengan data satelit pCO2 yang tinggi penyebab pengurangan koefisien pertukaran gas CO2 antara
udara-laut dan menghasilkan TCO2, suhu permukaan laut penyebab utama berkurangnya TCO2 tetapi di zone equtorial TCO2 yang
tinggi disebabkan oleh pencampuran vertikal dan mengalir atas. Kesimpulan: Disamping proses biologi seperti pernapasan dan fotosintesis untuk mengurangi CO2 secara alami untuk mengurangi pemanasan global sebagai sumber bencana
karenanya kita harus melaksanakan, berhenti melakukan penebangan hutan, pembakaran hutan, pemakaian bahan bakar fosil sehingga tidak mengganggu biodiversitas sebagai penunjang ketahanan pangan dan kestabilan alam.
Kata Kunci:Kecepatan Angin, PCO2, TCO2, Suhu Permukaan Laut, bencana alam, pemanasan Global, biodiversitas.
ABSTRACT
Background: The increase of atmospheric CO2 and the potentially resulting global warming has been a great concern for
human society. As it extremly dificult to perform observations of CO2 flux between air-sea. Ocean contains more than fifty
times carbon in the atmosphere and can be taken as buffer limiting the concentration of CO2 in atmosphere. Carbon dioxide
flux between air and ocean is CO2 concentration in ocean is controlled by physical, chemical and biological processes. It can
be determined from air-sea CO2 concentration differences and carbon dioxide (CO2) exchange between air-sea, in these rich
in nutrients. Method: Data from WOCE ship is analysis with linier regresion, Y = ax – b, get R2 determint coeffisien, calculated with math lab, Net sea-air CO2 Flux Calculated with Flux = K ΔPCO2. Objective: The objective of the present study is as the followings: to detect carbon dioxide flux relations with global warming and to detect partial pressure CO2
(pCO2) relations with climate change. Result: The pCO2 in surface waters of the global oceans varies seasonally over a wide
range above and below the current atmospheric pCO2. The effect of biological utilization of CO2 is diferentiate from that of
seasonal temperature changes using seasonal temperature data. The seasonal amplitude of surface water pCO2 in high
latitude waters locate pole ward of about 40o latitude and in the equaturiol zone is dominate by the biology effect, whereas
that in the temperate gyre regions is dominated by the temperature effect. These effects are about 6 months out of phase. Accordingly, along the boundaries between these two regimes, they tend to cancel each other, forming a zone of small pCO2
amplitude. Within satellite data the high pCO2 cause of decrease of coefficient air-sea of gas exchange and resulting the
increasing of TCO2, SST high cause to decrease TCO2 but in the equtorial zone TCO2 high that cause by vertical mixing and
up welling. Conclusion: Beside the biological process as respiration and photosynthesis to lessen CO2 in nature so that do
not as source of disaster hence we have to execute, lessening the source of disaster for example; deforestation, combustion of forest, usage of fossil fuel so that do not bother biodiversityas food resilience supporter and balanced of nature.
Korespondensi: I Wayan Karyawan
Email: [email protected]
12 INTRODUCTION
In recent years, the industrialization and urbanization tent to cause more problems in our living environment. The human and societal dimensions of environmental changes are the most important for environmental protection and conservation.[1] Specially, ocean waters are major resources for fish and biodiversity life for human life as the contribute ninety percent of world ocean Resources.[2] Human population and activities in the world are generally concentrated near the coast, over sixty percent of the human population lies in the coastal zone.[1] Human recreational activities, commercial and sport fishing and tourism are concentrated in coastal waters. For coastal waters, assessment of environmental component will be based on a number of receiving ecological characteristics, nature of the food chain, level of productivity and water temperature. They are potential for the increase of atmospheric CO2 and the magnitude of the net CO2 flux across the sea surface are important understanding the global carbon cycle. Base on approximately 2.5 million measurement s made for the pCO2 in surface waters of the global ocean since 1960, the climatologically distributions of monthly sea-air pCO2 difference, ΔpCO2 and the net air-sea have been estimated for a reference year 1995.
The increase of atmospheric CO2 and the potentially resulting global warming has been a great concern for human society. As it the extremely difficult to perform accepted in a form as below.[3,4,5] Global Warming is:
1. It is growing for an international consensus scientist that the warming of the earth’s climate is realizing and has been caused by an increase in emissions of Carbon Dioxide (CO2) and the other greenhouse gases. 2. Ocean contains more than fifty times
carbone in the atmosphere and can be taken as a buffer limiting the concentration of CO2 in atmosphere.
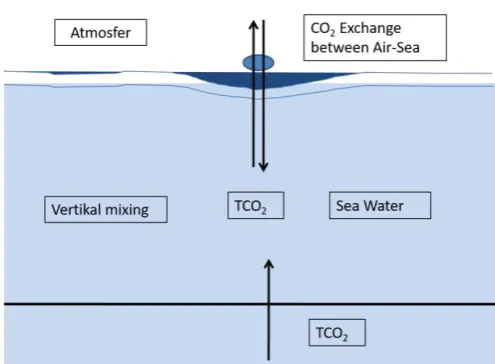
Figure 1. Carbon Dioxide (CO2) Exchange between Air-Sea
Since the late 18 the century, the CO2 concentration in the atmosphere has been increased by emission from fossil, fuel combustion, deforestation and cement production.[6,7] Carbone Dioxide (CO2) flux between air and ocean:
1). CO2 concentration in ocean is controlled by physical, chemical and biological processes and all these processes have been not well understood until now. 2). Much effort has gone into determining
the relationship between gas transfer and wind speed.
3). CO2 gas flux between ocean and air can be determined from air-sea CO2 concentration differences and CO2 gas exchange air-sea shows in figure 1.
Table 1. Global Warming and Ocean CO2 Budget
IPCC (Intergovernmental Panel on Climate Change)
Sumber Total Carbon Gt/yr
The research problems are formulated as the followings:
1. Within satellite data, why Carbon dioxide (CO2) flux relationship with global warming?
2. Within parameterize partial pressure CO2 (pCO2), Why CO2 flux relations with climate change? The objectives of this study are application of study on carbone dioxide flux relations with climate change in the Indonesia using satellite data. The more detailed objectives of the present study are as the followings:
1.To detect carbon dioxide flux relations with global warming. 2.To detect partial pressure CO2 (pCO2)
relations with climate change. The research result would give
information’s regarding to the following
aspects:
1. The carbon dioxide (CO2) flux based on climatologically surface ocean pCO2, and seasonal biological and temperature effect.
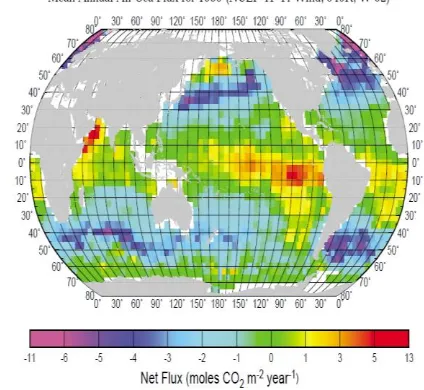
2. The increase of atmospheric CO2 and its potential for the global warming yellow are located in the areas of deep water upwelling (Figure 2). The effect of winter up welling is seen in the sub-arctic western pacific and that of up welling induced by the southwest monsoon during July-august is seen in the Persian Gulf. The strong source zone located along the Pacific equatorial is supported by the coastal up welling along south the America as well as by the upward entrainment of the equatorial under current water. The source intensity is toward the western Pacific due mainly to CO2 losses to photosynthesis and to the atmosphere. Strong CO2 sink (blue and purple areas) are as the flow from warm tropical oceans to sub polar zones.
Along the northern border of the south ocean, CO2 sink areas caused by cooling of pole ward flowing current such as the Brazil current located along eastern south America, the current located of south Africa the east Australian current located along south-eastern Australia. These warm water currents meet with cold current flowing
equator-ward from the Antartic zone along the northern border of the southern Ocean.
Figure 2. Global Distribution of the Net sea-air CO2
14
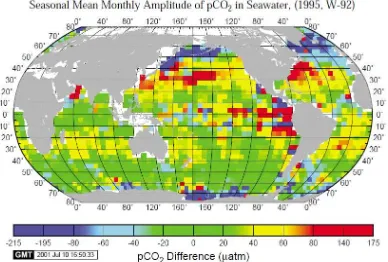
Figure 3. Seasonal Mean Monthly Amplitudo of pCO2 in Seawater
Seasonal Mean Amplitude of pCO2 Seawater
The difference between the pCO2 in the surface ocean water and that in the overlying air represents the thermodynamic driving potential for the CO2 gas transfer across the sea surface. The direction of the net transfer of CO2 is governed by the pCO2 difference and the sea –air CO2 gas transfer velocity, which has been improved using an expanded data set consisting of about 940.000 pCO2 measurement. Figure 3 shows the distribution peak to peak seasonal amplitude of surface-water pCO2. The positive value indicates areas where the surface water pCO2 maximum occurs during warm-water seasons. Within each hemisphere, seasonal changes for the temperate oceans (positive values) are approximately 6-month sout of phase from those (negative values) for the sub polar oceans. The seasonal variation in the northern hemisphere, in several pixels the sub artic Atlantic, eastern equatorial Pacific, Arabian sea, Chilean coast and Antarctic coast, abrupt change in the sign and colors (form red to dark blue) are observed. Because of the course spatial resolution of
our analysis, the pCO2-SST relations become reversed in area with fine scale oceanographic features such as the East greenland current in the sub artic Atlantic, the Brazil current in the south Atlantic and coastal up welling areas (Takahashi, 2000).
March; and the maximum monthly pCO2 of 529 matm occurs in July, during which a maximum daily value as high as 640 matm is observed. The extremely high values are due primarily to the monsoon-induced upwelling of deep waters. Large seasonal amplitudes are also observed near the Chilean coast,
where strong upwelling is known to occur. The green areas where seasonal changes are small are foundalon g the boundary between the warm subtropical waters and the colder subpolar waters of the Southern Ocean. This is due to the near cancellation of the temperature effect by the biology effect.
Figure 4. Framework of Research Concept
METHOD
Location of Research
This research was conducted in the Global Ocean.
Framework of Research Concept
Research conception divide into three frameworks, namely preparation, operation and validation, which can be seen in Figure 4.
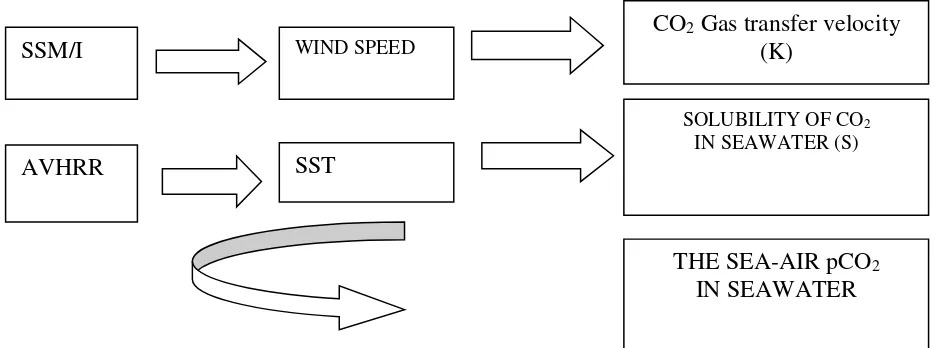
Material and Method
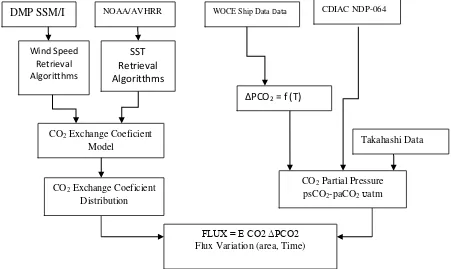
The material and method from CO2 flux can be seen at Figure 5.
Data Analysis Method
Data from WOCE ship is analyzed with linier regresion, Y = ax – b, get R2 determint
coeffisien, calculated with math lab, Net sea-air CO2 Flux, F can calculate using
The result would be the monthly ΔpCO2.
AVHRR SST (Atmospheric Very High Resolution Radiometric Sea Surface Temperature) dan SSM/I (S) satellite data with radiometric calibrate geologicate radiance. Satellite data is process to level-2 product (Geophysical parameters on Earth Surface) by SeaDas Software and its results synchronous with ENVI.
WOCE Ship Data Data CO2 Exchange Coeficient
Model
CO2 Partial Pressure
psCO2-paCO2ᴜatm
CO2 Exchange Coeficient
Distribution
FLUX = E CO2 ΔPCO2
Flux Variation (area, Time)
16 Figure 5. Material and Method
RESULT AND DISCUSSION
How and Why Is This Field Relevant?
As the world enters the 21st century there will increased focus on cycling of carbon. We are all aware that CO2 and other greenhouse gases are increasing in the atmosphere. There is no better example to show than the classic data from C.D. Keeling[6] showing the seasonal oscillations and the steady annual increase of CO2 at the Mauna Loa Observatory Most experts conclude we are already witnessing the impact of this increase as global warming and the signal is expected to become increasingly more pronounced between now and the year 2050. This is within the lifetime of students reading this book. Thus, an important focus of education in chemical oceanography should be on the concentrations of carbon species and their controlling mechanisms.
The ocean carbon cycle influences atmospheric CO2 via changes in the net air-sea CO2 flux that are driven by differences in the partial pressure of CO2, PCO2, between the surface ocean and atmosphere. The inventory of dissolved CO2 in the oceans is 50-60 times greater than that in the atmosphere, so a small perturbation of the ocean carbon cycle can result in a substantial change in the concentration of CO2 in the atmosphere. The regional and vertical
Figure 6. SSMI (v7) *monthly* means of 10 wind speed, columnar cloud liquid water, columnar water vapor and rain rate for July 2014.
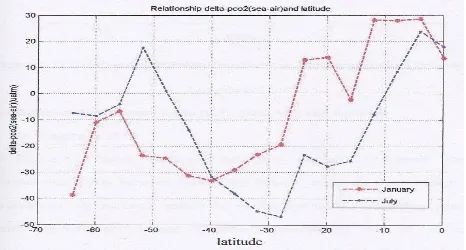
Figure 7. Relationship of delta CO2 sea-air and month at latitude -20 longitude 72.5
Figure 7 shows relationship delta CO2 sea-air and month at latitude -20 longitude 72.5 is get trend from January to June from 18 to -22 delta pCO2 occurs decrease, on low pCO2 from February to august are found in the heigh latitude are at
18 these areas low pCO2 water are formed by cooling of warm water with the biological
dropdown of pCO2 in the nutrient –rich sub polar water.
Figure 8. Relationship of delta CO2 sea-air and moth at latitude -20 longitude 72.5
Figure 8 shows relationship of delta CO2 sea-air and moth at latitude -20
longitude 72.5 low ΔpCO2 areas found in the
high latitude areas in the South Ocean, Indian Ocean during the austral summer (February) and the Sub artic and Atlantic Ocean during the Northern summer (August). These Areas represent an intense sink for atmospheric CO2, which attributed primarily to the photosynthetic utilization of
CO2. The broad low ΔpCO2 areas dark and
light blue which are found.
CONCLUSIONS
Conclusions beside biological process like respiration and photosynthesis to lessen CO2 in nature so that do not as source of disaster hence we have to execute, lessening the source of disaster for example; deforestation, combustion of forest, usage of fossil fuel.
SUGGESTION
Suggestion for the future study it is recommended to do the deeper study using different method on the CO2 flux.
REFERENCES
1. Ae, L.S 2004. Simulation of Eco-Dynamic Model in Tokyo Bay and its comparison with Satellite data. Chiba University Japan.
2. Kunte, P.D. 2003. Study of Sedimentation in the Gulf of Kachchh, Using 3D hydro-dynamic Model Simulation and Satellite Data. Doctor program Center of remote Sensing Chiba University, Japan.
3. Liss, P.G 1973. Process of Gas exchange a cross an Air-Water Interface, deep Sea Res., Vol. 20, 221-238
Air-sea Gas Exchange Gas transfer of water Surface, Brutsaertt W. And Jirk G.H. (eds), D Reidel Published Company 5. Sugimori. Y and Zhao C.1995. The Co2
flux estimation in the North Pasific ocean Based on Satellite and Ship Data, Procceeding of international Symposium on remote sensing, taejon, Korea
6. Keeling, R.F and T.H Feng.1995. “Transport of Heat, CO2 and O2 by the Atlantic’s Thermohaline Circulation“
Philosophical Transactions of the royal Society of London Series B-Biological
Sciences 348:133-142
7. IPPC (1995) Intergovermental Panel on climate Change
8. Takahashi, T. 2000. Cooperative Atmosphere Data Integration Project