Full Terms & Conditions of access and use can be found at
http://www.tandfonline.com/action/journalInformation?journalCode=cbie20
Download by: [Universitas Maritim Raja Ali Haji] Date: 17 January 2016, At: 23:59
Bulletin of Indonesian Economic Studies
ISSN: 0007-4918 (Print) 1472-7234 (Online) Journal homepage: http://www.tandfonline.com/loi/cbie20
How corruption diminishes the effectiveness of
public spending on education in Indonesia
Daniel Suryadarma
To cite this article: Daniel Suryadarma (2012) How corruption diminishes the effectiveness of public spending on education in Indonesia, Bulletin of Indonesian Economic Studies, 48:1, 85-100, DOI: 10.1080/00074918.2012.654485
To link to this article: http://dx.doi.org/10.1080/00074918.2012.654485
Published online: 14 Mar 2012.
Submit your article to this journal
Article views: 958
View related articles
ISSN 0007-4918 print/ISSN 1472-7234 online/12/010085-16 © 2012 Indonesia Project ANU http://dx.doi.org/10.1080/00074918.2012.654485
* I am grateful to Ari Perdana and Elif Yavuz for sharing their knowledge of the Indo -nesian education sector and to Muhammad Purnagunawan for providing input during the early stages of this research. I also thank Lina Marliani for assisting with district coding, and Daan Pattinasarany and Wenefrida Widyanti for sharing their expertise on Indonesian data sets. Nanda Rembulan Nurdianto provided excellent research assistance. Finally, I am grateful to Paul Chen, Arya Gaduh, Andrew Leigh, Asep Suryahadi, Chikako Yamauchi,
the BIES editor and seminar participants at the 4th Australasian Development Economics
Workshop in Canberra, the 11th East Asian Economic Association International Convention
in Manila, and the 2008 Economics and Democracy Conference in Canberra for comments and suggestions.
HOW CORRUPTION DIMINISHES THE EFFECTIVENESS
OF PUBLIC SPENDING ON EDUCATION IN INDONESIA
Daniel Suryadarma∗
Australian National University
This paper takes advantage of a regional corruption measure to assess the impact of corruption on the effectiveness of public spending in the education sector in Indo
-nesia, one of the most corrupt countries in the world. Two sets of outcomes are con
-sidered: school enrolment rates and school performance in national examinations. Public spending appears to have a negligible effect on school enrolment in highly corrupt regions, but a statistically signiicant, positive and relatively large effect in less corrupt regions. In contrast, public spending has no signiicant effect on school performance. The main lesson from this paper is that pouring more public funds into the education system is unlikely to bring about improvement unless it is ac
-companied by efforts to improve governance in the sector.
Keywords: corruption, public spending, education
INTRODUCTION
Countries can gain numerous beneits from having a highly educated population. Over many years, researchers have argued that higher human capital is associated, among other things, with higher economic growth (Hanushek and Kimko 2000); lower infant mortality rates (Jamison, Jamison and Hanushek 2007); higher levels of democracy (Barro 1999); and higher support for free speech (Dee 2004). Studies whose results contradict those just mentioned also exist. For example, Acemoglu et al. (2005) question the inding of a positive relationship between education and democracy; Bils and Klenow (2000) discuss reverse causality issues in the asso
-ciation between schooling and growth; and Pritchett (2001) inds no asso-ciation between human capital improvement and worker productivity. Nevertheless, encouraged by the indings of positive associations, developing countries have
been allocating substantial public resources to developing and improving their education systems. Examining 23 developing countries, the World Bank (2007) inds that public education makes up 8–27% of total government spending.
Yet there seems to be relatively little association between this substantial expenditure and education outcomes. Harbison and Hanushek (1992) examine 12 studies in developing countries and ind that six of them report a statistically insigniicant association. Similarly, Anand and Ravallion (1993) demonstrate that per capita public spending on education in a country has no statistically signii
-cant effect on the country’s literacy rate. In the same vein, Rajkumar and Swaroop (2008), using a pooled data set of 91 developed and developing countries, dis
-cover that the relationship between public spending on education and the educa
-tion failure (or ‘drop-out’) rate is small and statistically insigniicant. In contrast, Gupta, Verhoeven and Tiongson (2002) ind that increased public spending in education and health is associated with better outcomes in those spheres.
In an attempt to explain this phenomenon, several studies claim that the qual
-ity of governance plays a large role, because in highly corrupt countries schools receive only a small proportion of the intended budget allocation. For example, Reinikka and Svensson (2004) track a school grant program in Uganda and ind that, on average, schools receive only 13% of the funds allocated, with local politi
-cians siphoning off the rest. Therefore, one explanation for the lack of association between public spending and education outcomes may lie in how much of the budget allocation actually arrives in the schools.
Several studies ind a signiicant and strong correlation between public spend
-ing and education outcomes once governance is taken into account. Us-ing a Ugan
-dan government effort to reduce corruption as a source of variation, Björkman (2006) inds that a higher share of the grant reaches the schools in less corrupt than in more corrupt regions, and that the primary level exit examination scores of students in the less corrupt regions are 0.4 standard deviations higher than those of students in the more corrupt regions. Similarly, Rajkumar and Swaroop (2008) ind that a percentage point increase in the ratio of public education spending to GDP lowers the education failure rate by 0.7% in countries with good governance, but has no discernible effect in countries with weak governance.
This paper investigates the relationship between public spending on educa
-tion and educa-tion outcomes in Indonesia, and examines how corrup-tion affects that relationship. For several reasons, Indonesia makes an especially interesting case study of the inluence of corruption on the effects of public spending. First, although it is considered one of the most corrupt countries in the world, belong
-ing in the bottom 10% in all major cross-country data sets that measure corrup
-tion, quantitative research on corruption in Indonesia has begun only relatively recently.1 Second, Indonesia adopted a decentralised education system in 2001,
under which local governments manage the major activities of the sector and
1 According to Svensson (2005), the three most widely used cross-country corruption data sets are the World Bank’s Control of Corruption Index; Transparency International’s Cor
-ruption Perception Index (CPI); and the Political Risk Services International Country Risk Guide. Lambsdorff (2006) lists almost every corruption measure currently available. Quan
-titative studies of corruption and governance in Indonesia include Sumarto, Ariianto and Suryahadi (2003); Olken (2006a, 2006b, 2007); Kristiansen and Ramli (2006); Olken and Barron (2007); and Asia Foundation (2008).
are responsible for most of its expenditure.2 There is suficient variation in the
amount of public spending allocated to education by local governments to per
-mit an empirical analysis of the effect of such spending on school enrolment and education outcomes.
There are several reasons for focusing on the education sector, even though it is argued that corruption is lower in education than in other sectors (Mauro 1998; Fisman and Gatti 2002; Hunt 2006). First, many studies have shown that educa
-tion is one of the most effective avenues through which developing countries can improve living standards. Second, a substantial proportion of public spend
-ing is allocated to this sector, mak-ing it important to measure the effectiveness of education spending before providing policy recommendations for improving its effectiveness. Third, given that most parents wish to see their school age children enrolled in school, it is dificult for parents to resist requests for corrupt payments if these occur (Deininger and Mpuga 2005). Finally, there is indeed evidence of cor
-ruption taking place in the Indonesian education system (Kristiansen and Pratikno 2006), even though there is no exact measurement of how large this is or of its effect on education outcomes. In one recent study, Widyanti and Suryahadi (2008) ind that 9% of respondent households claim to know of cases of bribery in schools.
This paper provides information on how Indonesia’s education system has been inanced since decentralisation, and reviews the evidence on corruption in the education sector. It then describes the econometric speciication and data used to explore relationships between public education spending and education out
-comes, and the inluence of corruption on those relationships. It also outlines pos
-sible biases in this study. After presenting the estimation results, the paper offers some policy interpretations of them.
PUBLIC SPENDING ON EDUCATION
This section discusses the role of local governments and the central government in public spending on primary and secondary education following decentralisa
-tion.3 Indonesia has two main types of schools, distinguished by their curricula: regular schools and madrasah (Islamic schools). Both school types include public
and private schools. In terms of the number of schools and of students enrolled, regular schools are far more important than madrasah.
Regular schools use a core curriculum designed by the central government’s Ministry of National Education. Local governments administer public regular schools, while non-proit organisations can own and operate private regular schools.4 In contrast, the madrasah use a curriculum that is based on Islamic
teaching and is designed by the central government’s Ministry of Religious
2 The top three tiers of government in Indonesia are the central, provincial and local. Lo
-cal governments may be either districts (kabupaten) or municipalities (kota). A noteworthy
feature of Indonesia’s decentralisation is that most functions of government were devolved to local governments, bypassing the provinces.
3 Unlike the primary and secondary levels, the tertiary level of education remains central
-ised.
4 Law 20/2003 on the National Education System stipulates that private school operators must be non-proit organisations.
Affairs. The ministry also administers public madrasah, while Islamic organisa
-tions are allowed to operate private madrasah. Both regular and madrasah school
students in the 9th and 12th grades are required to sit for the national exit exami
-nations.5
After decentralisation in 2001, local governments became responsible for paying teacher salaries and maintaining the facilities of regular public schools, while the central government continued to provide a good proportion of the funds needed for building new schools. World Bank (2007) calculates that local government spending accounted for 70% of total public spending on educa
-tion in 2004. Supporting these igures, Kristiansen and Pratikno (2006) ind that central government spending on education fell from 17% of total government spending in 1997 (four years before decentralisation) to just 5% in 2004 (three years after decentralisation). Of the participants in the latter authors’ focus group discussions, 81% believed that school quality had improved following decentralisation. The study by Widyanti and Suryahadi (2008) found that 76% of respondents considered that education services were generally better in 2006 than in 2004.
In their qualitative research on the effects of decentralisation on the education system, Kristiansen and Pratikno (2006) ind that both public and private spend
-ing per student was much higher after decentralisation, with private spend-ing increasing 5.8, 4.2 and 3.3 times between 1998 and 2004 for primary, junior sec
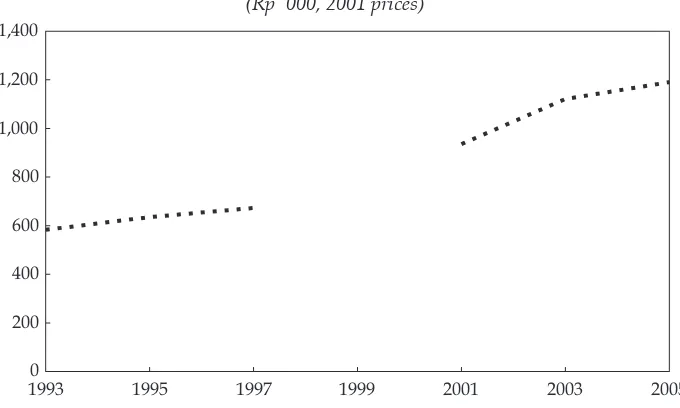
-ondary and senior sec-ondary schools, respectively. Although the authors do not indicate whether these increases are nominal or real, they are certainly substantial, much higher than the average inlation rate between those years. Public spending on education, meanwhile, roughly doubled in real terms between 1993 and 2005 (igure 1). The increase in public spending occurred for two reasons. First, par
-ties and candidates in local government election campaigns saw it as imperative to promise free education (Kristiansen and Pratikno 2006). Second, the national parliament passed a law in 2003 that requires spending on education to account for 20% of total spending for both local and central governments.6
EVIDENCE ON CORRUPTION IN THE EDUCATION SECTOR
Much of the evidence on the extent of corruption in the education sector is anec
-dotal, owing to the dificulty of collecting systematic information on this subject. In a survey of corruption in education in 17 countries, Chapman (2002) inds that more than half of respondents in Indonesia believed there was widespread cor
-ruption in the education sector. A quarter of respondents reported having been asked for bribes by education professionals.
Other forms of corruption include embezzlement of education program funds. One program affected is School Operational Assistance (Bantuan Operasional Sekolah, BOS), the central government’s lagship education-based anti-poverty program. It transfers special funds to schools for the purchase of additional teach
-5 In Indonesia, primary school runs from grade 1 to grade 6, junior secondary school cov
-ers grades 7 to 9, and senior secondary school is from grades 10 to 12.
6 World Bank (2007) discusses at length the problems associated with the 20% rule and their consequences.
ing materials or the provision of fee relief to allow children from poor families to stay at school. Newspapers have reported a number of cases of regional education oficials taking a cut from the BOS transfer. Moreover, a recent audit by the state audit agency found embezzlement of BOS funds in six out of 10 schools (Jakarta Post, 27/12/2010). If embezzlement occurs in the national government’s lagship
program, then it is highly plausible that it also occurs in local governments’ public spending on education.
Another form of corruption known to occur in Indonesia is high teacher absence. In a survey of six developing countries, Chaudhury et al. (2006) ind that almost one-ifth of teachers in Indonesia are absent without notice, while continuing to receive their salary. Since teacher salaries are included in pub
-lic spending on education, teacher absence reduces the effectiveness of such spending.
Because no measure of corruption in Indonesia’s education sector is available, the measure of corruption used in our analysis is not speciic to education, but is a more general measure of corruption in Indonesia. It is explained in the next section.
ECONOMETRIC SPECIFICATION, DATA AND ESTIMATION ISSUES
The reduced form econometric speciication used to measure the relationship between public spending and education outcomes is shown in equation 1.
Sit+2=β0+β1log(pubit)+β2log(privit)+β3povit+γt+υυit (1)
where Sit+2 is the education outcome of region i at time t+2; pubit and privit are
public and private education spending per student in the region at time t; povit
is the poverty headcount rate of the region at time t; γt is a year dummy; and υit
FIGURE 1 Real Public Education Spending (Central and Local) per Student (Rp ‘000, 2001 prices)
1993 1995 1997 1999 2001 2003 2005
0 200 400 600 800 1,000 1,200 1,400
Sources: Lanjouw et al. (2001) to 1998; World Bank (2007) from 2001; and author’s calculations from Susenas.
is the residual.7 The poverty rate is included to control for regional variance in
economic development, which may be correlated with the level of public spend
-ing and the dependent variables. The purpose of us-ing spend-ing data from time
t and linking them to outcomes in time t+2 is to take into account the likely lag in
the effect of public spending on outcomes.
The paper measures the effect of public spending on two sets of outcomes. The irst is net enrolment rates at junior and senior secondary levels. The net enrol
-ment rate is the proportion of children in a speciic school age group who are enrolled at that particular level. For example, the junior secondary net enrolment rate is the proportion of all 13–15-year-old children who are currently enrolled at the junior secondary level. These rates are calculated using Susenas, the National Socio-Economic Survey conducted by Statistics Indonesia, the central statistics agency. Susenas is an annually administered household survey, and is representa
-tive at the district/municipality level. In any given year, Susenas samples around 200,000 households consisting of 800,000 individuals. This paper uses data from Susenas 2004 and 2006.
The second set of outcomes is the performance of junior secondary school students in the 2004 and 2007 national examinations.8 The examination tests 9th
grade students in mathematics and English and Indonesian language.9 The Min
-istry of National Education (MONE) designs the national examination, and scores are comparable across regions. The pass rates of each region are calculated using MONE’s formula. The data are inclusive of all schools in each region – regular
schools and madrasah, both public and private.
To calculate the amount of public spending per student, this study used 2002 and 2004 local government level education expenditure realisation data com
-piled by the World Bank.10 The private education spending data are calculated by
dividing Susenas 2002 and 2004 data on household spending on education in each region by the number of students enrolled in that region.11 Finally, poverty rates
in each region are calculated from Susenas 2002 and 2004 data, using the poverty lines calculated by Pradhan et al. (2001). These lines are based on the consumption of 2,000 kilocalories per day, and are comparable across regions.
7 Several of the cross-country studies mentioned in the introduction use GDP per capita as an explanatory variable, possibly to proxy for welfare and private education spending. Since this paper uses both poverty rates and actual private spending data, there is no need to include GDP in the present analysis. In results not shown, controlling for GDP per capita does not change the conclusions of the paper.
8 The senior secondary national examination results are not publicly available.
9 Only the results of the mathematics examination are presented here. The results for the English and Indonesian language examinations are qualitatively similar.
10 It is not possible to calculate the exact amount of central government spending on edu
-cation for each region, so central spending is excluded from the data. In any case, most central government education spending is directed to the tertiary level (World Bank 2007). 11 It is not possible to distinguish education spending according to its use, for example, for tuition fees, transport to school or book purchases. Nor is there any information on the pro
-portion of students who attend school in a region different from their region of residence.
In order to investigate how corruption inluences the effect of public spending on educational outcomes, the study extends the model used in equation 1 so as to follow the model used by Rajkumar and Swaroop (2008), as shown in equation 2.
Sit+2=β0+β1log(pubit)+β2log(privit)+β3povit+β4coorrupt
corrupt pub
it
it it t it
+β5 ×log( )+ +γ υ (2)
where corruptit is the Corruption Perception Index (CPI) of region i at time t.
The data source for corruption is the CPI data for municipalities published by Transparency International Indonesia (TII) in 2007 and 2009 (Karyadi et al. 2007; Simanjuntak 2009). The data are based on surveys of business practitioners in 2006 and 2008, designed according to Transparency International’s cross-country CPI construction methodology. The weakness of subjective (perceptions) data is well documented (Bertrand and Mullainathan 2001), but no objective local gov
-ernment level data on corruption in Indonesia exist. There may also be some con
-cern about using a measure of corruption collected from business practitioners as a proxy for corruption in the education sector, but again there are no corrup
-tion data speciic to the educa-tion sector. However, under the assump-tion that any measurement error is not correlated with the observed CPI, the estimated coeficients will still be consistent. In order to check for robustness, column 3 in tables 2 and 3 uses a categorical dummy for the CPI, equal to one if the region is in the least corrupt half of the CPI distribution. This additional variable may help reduce any measurement error.
Given that Transparency International deines corruption as the misuse of public position for private gain, the CPI relects the views of businesses in each region about corruption in public sector agencies. The index ranges from zero to 10, with higher values indicating less corruption. While the CPI is designed to allow the ranking of regions according to their CPI scores, Transparency Inter
-national provides no information as to whether it can be considered as a cardinal measure of corruption. However, as Svensson (2005) notes, researchers typically treat the scores as cardinal measures.
Although TII has been conducting the biennial survey since 2004, this paper uses the 2006 and 2008 surveys. This is because TII visited only 21 regions in 2004. The 2006 survey covered 32 regions, 22 of which were revisited in 2008.12 Ideally,
a longitudinal data set of at least three time periods should be constructed, given the availability of CPI data (2004, 2006, 2008 and 2010). However, the four data sets used in this paper cover different periods. At the time this research was con
-ducted, public spending data were available only up to 2004, while the national examination results were publicly available only up to 2007. Therefore, only two periods of data could be constructed, where the independent variables were from 2002 and 2004 (except for the CPI, which uses data from 2006 and 2008), and the dependent variables were from 2004 and 2006 (except for the national examina
-tion data which were from 2007).
12 For the 10 regions that were not revisited in 2008, I use the 2006 CPI. As discussed be
-low, this approach is justiied by the relative time-invariance of the CPI.
Choice of estimation method
The two econometric models above can be estimated using a pooled ordinary least squares (Pooled OLS) or a panel ixed-effects (Panel FE) method. The choice of methodology depends on several considerations. Two sources of bias in the analysis are possible: reverse causality between public spending and education outcomes; and omitted variable bias stemming from the fact that the small sample size precludes the use of many control variables in the estimation.13 Provided that
reverse causality and omitted variable bias are time-invariant, a Panel FE method would remove those biases from the results.
The disadvantage of using a Panel FE method, however, is that it relies solely on within-region variation. Thus variables whose within-region variation is only a small proportion of total variation are likely to have insuficient variation to be able to generate meaningful results. Unfortunately, the CPI is one such variable. The within-region variation in the CPI is only 29.9% of total variation, implying that this is largely a time-invariant variable. Given this observation, estimating a Panel FE on equation 2 may effectively remove any possible inluence that corrup
-tion has on the rela-tionship between public spending and educa-tion outcomes. For these reasons, equations 1 and 2 are estimated using a Pooled OLS meth
-od.14 Summary statistics of the dependent and independent variables are pro
-vided in table 1.
CORRUPTION, PUBLIC SPENDING AND SCHOOL ENROLMENT
Results of the analysis of the impact of higher public spending on net enrolment rates at junior and senior secondary levels are shown in table 2, panels A and B.15 In each panel, column 1 shows the estimation results of equation 1, while
columns 2 and 3 show estimation results for equation 2. As explained above, two different measures of the CPI are used: the index itself (column 2) and a dummy variable that is equal to one if the region is in the top half of the CPI distribution, indicating a region with relatively low corruption (column 3). Columns 2 and 3 show whether corruption inluences the relationship between public spending and outcomes.
In column 1 of table 2, the estimates in the irst row of each panel show that the effect of public spending on junior and senior secondary net enrolment rates is
13 While there is some possibility of omitted variable bias, this paper has the advantage of using a within-country data set. The sample displays very little variation in respect of the control variables that need to be taken into account in cross-country studies, such as politi
-cal institutions, education inancing systems, the extent of decentralisation, and levels of female education. In any case, most of the control variables are statistically insigniicant in the cross-country studies. Rajkumar and Swaroop (2008), for example, use six control vari
-ables, and only one, a dummy for East Asian countries, is statistically signiicant.
14 The key indings about the effect of corruption on education are robust when the model is estimated using the Panel FE method, which implies that time-invariant unobserved heterogeneity is not a signiicant source of bias.
15 Ideally, the public and private spending data should be separated into junior and senior secondary categories. However, the way education spending is presented in the oficial documents rules out this possibility.
small and statistically insigniicant. The larger point estimate, 0.042 (panel B, col
-umn 1, row 1), indicates that a doubling of public spending per student would lead to an increase in the senior secondary net enrolment rate of only 4.2 percentage points, or less than 10% proportionally from the mean of 0.57 shown in table 1. This corroborates the inding in both the cross-country and the country-speciic studies mentioned in the introduction – that public spending has little effect on education outcomes.
However, when the analysis takes into account how corruption inluences the relationship between public spending and enrolments, the estimates in table 2 show that the negative impact of public spending in highly corrupt regions (those whose CPI is near zero) eventually becomes positive as the level of corruption declines.16For example, a region whose CPI is one standard deviation – about 0.81
points (table 1) – higher than the average is able to achieve a 4.7 percentage-point higher junior secondary net enrolment rate with the same amount of increased public spending as a region with an average CPI.17
16 For a region whose CPI is zero, the effect of public spending on enrolments is repre
-sented in the irst row of column 2 in each panel, for example –0.237 in table 2, panel A. 17 If everything else is held constant, the marginal effect of doubling public spending in a region with an average CPI (4.66) is –0.237 + (4.66 × 0.058) = 0.033, that is, row 1 + (average CPI x row 5) of column 2, panel A. Meanwhile, the marginal effect of the same amount of public spending in a region with a CPI of 5.47 (one standard deviation – 0.81 – higher than the average) is –0.237 + (5.47 × 0.058) = 0.080. The difference is 0.080 – 0.033 = 0.047, or 4.7 percentage points.
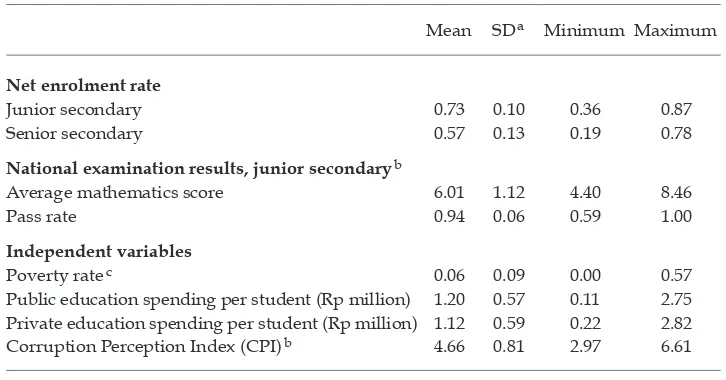
TABLE 1 Summary Statistics of Education Outcomes and Independent Variables
Mean SDa Minimum Maximum
Net enrolment rate
Junior secondary 0.73 0.10 0.36 0.87
Senior secondary 0.57 0.13 0.19 0.78
National examination results, junior secondaryb
Average mathematics score 6.01 1.12 4.40 8.46
Pass rate 0.94 0.06 0.59 1.00
Independent variables
Poverty ratec 0.06 0.09 0.00 0.57
Public education spending per student (Rp million) 1.20 0.57 0.11 2.75 Private education spending per student (Rp million) 1.12 0.59 0.22 2.82
Corruption Perception Index (CPI)b 4.66 0.81 2.97 6.61
a SD = standard deviation.
b The national examination score and the CPI range from zero to 10.
c The poverty lines used to calculate poverty rates apply the methodology developed by Pradhan et al. (2001), which is based on 2,000 kilocalories/day, and has the property of being comparable across regions. The mean poverty rate for the 32 sample regions is less than half that for all of Indonesia (which comprises 450 local government regions), so the sample is not necessarily representative of all of Indonesia.
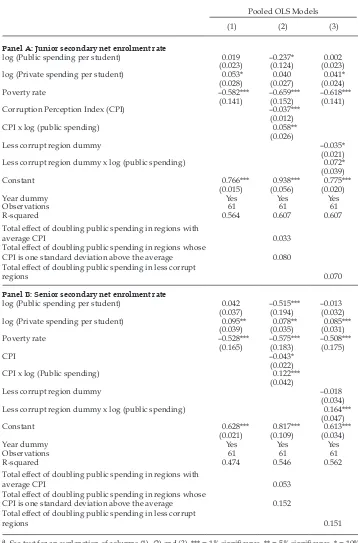
TABLE 2 Corruption, Public Spending and School Enrolmenta
Pooled OLS Models
(1) (2) (3)
Panel A: Junior secondary net enrolment rate
log (Public spending per student) 0.019 –0.237* 0.002
(0.023) (0.124) (0.023)
log (Private spending per student) 0.053* 0.040 0.041*
(0.028) (0.027) (0.024)
Less corrupt region dummy x log (public spending) 0.072*
(0.039)
Total effect of doubling public spending in regions with
average CPI 0.033
Total effect of doubling public spending in regions whose
CPI is one standard deviation above the average 0.080
Total effect of doubling public spending in less corrupt
regions 0.070
Panel B: Senior secondary net enrolment rate
log (Public spending per student) 0.042 –0.515*** –0.013
(0.037) (0.194) (0.032)
log (Private spending per student) 0.095** 0.078** 0.085***
(0.039) (0.035) (0.031)
Less corrupt region dummy x log (public spending) 0.164***
(0.047)
Total effect of doubling public spending in regions with
average CPI 0.053
Total effect of doubling public spending in regions whose
CPI is one standard deviation above the average 0.152
Total effect of doubling public spending in less corrupt
regions 0.151
a See text for an explanation of columns (1), (2) and (3). *** = 1% signiicance, ** = 5% signiicance, * = 10% signiicance. Standard errors are in parentheses, and clustered at the region level. The Corruption Perception Index ranges from 0 (most corrupt) to 10 (least corrupt). The less corrupt region dummy = 1 if the region belongs among the 50% least corrupt regions.
The results for the alternative (dummy variable) measure, included to reduce measurement error, show that for regions in the top half of the CPI distribution (that is, those with lower than average corruption), doubling public spending on education would result in a 7 percentage-point increase (0.07; panel A, column 3, last row) in the junior secondary net enrolment rate, although the effect is only weakly statistically signiicant. In contrast, the effect of public spending on the junior secondary net enrolment rate in regions in the bottom half of the CPI dis
-tribution is basically zero.18
A similar pattern, but with stronger effect, is found with the senior second
-ary net enrolment rate (columns 2 and 3, panel B). The parameter estimates in column 2 show that a CPI that is one standard deviation higher than the average generates an additional 9.9 percentage points in the senior secondary net enrol
-ment rate for the same amount of increased public spending.19 This is a large
additional effect of public spending on outcomes, because the average senior sec
-ondary net enrolment rate in the sample is 57% (table 1). Moreover, column 3 of panel B shows a similar result to that for junior secondary enrolment: public spending on education has no discernible impact on senior secondary enrolment in more corrupt regions. In contrast, a doubling of public spending per student in less corrupt regions would increase the senior secondary net enrolment rate by 15.1 percentage points (0.151; panel B, column 3, last row).
Overall, the results in columns 2 and 3 of both panels in table 2 show that increasing public education spending affects enrolment levels positively pro
-vided the area in question has a suficiently low corruption level. Therefore, it appears that the apparent lack of a relationship between higher public spending and school enrolment may be a consequence of corruption within the education sector.
CORRUPTION, PUBLIC SPENDING AND SCHOOL PERFORMANCE
This section examines the same questions about education spending and corrup
-tion in rela-tion to the second set of outcomes: performance in na-tional mathe
-matics examinations and the national examination pass rate at junior secondary level. Since scores in the national examinations are comparable across regions, the results in this section could be considered as an indication of the effect of public spending on school quality, and of how corruption affects this relationship.
Table 3 provides the estimation results. Qualitatively, the results in column 1 of both panels A and B are similar to those in table 2, where the estimated effects of public spending on outcomes are precisely zero. This corroborates the ind
-ings of a cross-country study on the determinants of mathematics and science achievement, which shows that higher spending on education is not associated
18 The results for regions in the bottom half of the CPI distribution are shown in the irst row of column 3 in each panel.
19 As with junior secondary enrolment (panel A), if everything else is held constant, the marginal effect of doubling public spending in a region with an average CPI (4.66) is –0.515 + (4.66 × 0.122) = 0.053, that is, row 1 + (average CPI x row 5) of column 2, panel B. Mean
-while, the marginal effect of the same amount of public spending in a region with a CPI of 5.47 (one standard deviation – 0.81 – higher than the average) is –0.515 + (5.47 × 0.122) = 0.152. The difference is 0.152 – 0.053 = 0.099, or 9.9 percentage points.
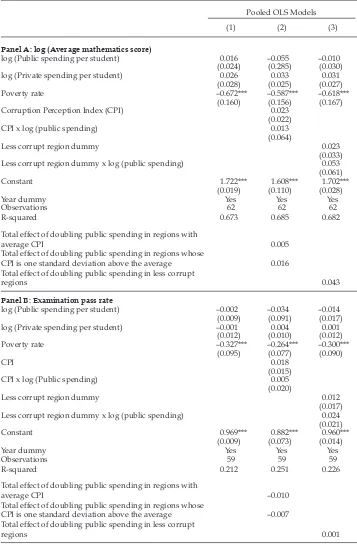
TABLE 3 Corruption, Public Spending and School Performancea
Pooled OLS Models
(1) (2) (3)
Panel A: log (Average mathematics score)
log (Public spending per student) 0.016 –0.055 –0.010
(0.024) (0.285) (0.030)
log (Private spending per student) 0.026 0.033 0.031
(0.028) (0.025) (0.027)
Less corrupt region dummy x log (public spending) 0.053
(0.061)
Total effect of doubling public spending in regions with
average CPI 0.005
Total effect of doubling public spending in regions whose
CPI is one standard deviation above the average 0.016
Total effect of doubling public spending in less corrupt
regions 0.043
Panel B: Examination pass rate
log (Public spending per student) –0.002 –0.034 –0.014
(0.009) (0.091) (0.017)
log (Private spending per student) –0.001 0.004 0.001
(0.012) (0.010) (0.012)
Less corrupt region dummy x log (public spending) 0.024
(0.021)
Total effect of doubling public spending in regions with
average CPI –0.010
Total effect of doubling public spending in regions whose
CPI is one standard deviation above the average –0.007
Total effect of doubling public spending in less corrupt
regions 0.001
a See table 2, note a.
with higher achievement (Hanushek and Kimko 2000). Glewwe and Kremer (2006) also ind that merely increasing resources while keeping delivery methods constant does not improve test scores.
In column 2 of table 3, the results in both panels show that lower corruption – as indicated by a higher CPI – does not signiicantly increase the effect of pub
-lic spending on school performance. Column 3 of both panels shows that pub-lic spending in less corrupt regions has no signiicant effect on school quality. These indings contrast with the inding of Björkman (2006) in Uganda, that grants to schools had a signiicant positive effect on examination performance.
A possible explanation for corruption’s lack of effect on the relationship between public spending and school performance may lie in the results reported in the previous section, which showed that public spending has a positive effect on school enrolment only in less corrupt regions. If those results imply that a relatively large proportion of low-performing students are encouraged to enrol in junior secondary schools in response to increased public spending, that trend may counteract any gain in average performance that might be expected from additional public spending in these less corrupt regions. This proposition is tested by controlling for school enrolment levels. The estimation results are provided in appendix table 1. They are qualitatively similar to the results in table 3, suggesting that this explanation is not supported by the data.
CONCLUSION
This paper takes a irst step towards understanding how corruption in the educa
-tion sector affects the performance of Indonesia’s educa-tion system. Against the backdrop of the substantial resources spent upon education and the likely impor
-tance of the latter to any country’s economic prosperity, the study measures the effect of public spending on school net enrolment rates and school performance in national examinations. It then examines whether corruption has a role in explain
-ing the effectiveness of public spend-ing.
Higher public spending is found to be associated with higher enrolment rates only in less corrupt regions. Therefore, while increasing public spending may be a necessary condition for improving school enrolment in Indonesia, it is not suf
-icient. Stakeholders must conduct a rigorous effort to combat corruption in the education sector in order for the higher spending to yield a positive effect on school enrolment.
In contrast, public spending is shown to have no statistically signiicant rela
-tionship with school quality, as indicated by students’ examination performance. This does not mean that public spending should be reduced; instead, the results indicate that allocating more funds to the education sector will not improve school quality unless this is accompanied by other policies, such as improving the curriculum and recruiting higher-quality teachers. Some of these policies do require more funding, but they need much more than just funds in order to suc
-ceed. Given the indings in this paper, one policy response that needs to be made is to conduct a stronger campaign against corruption, since this would generate increased school enrolments for any given level of public spending on education.
REFERENCES
Acemoglu, D., Johnson, S., Robinson, J. and Yared, P. (2005) ‘From education to democ
-racy?’, American Economic Review 95 (2): 44–9.
Anand, S. and Ravallion, M. (1993) ‘Human development in poor countries: on the role of private incomes and public services’, Journal of Economic Perspectives 7 (1): 133–50.
Asia Foundation (2008) ‘The cost of moving goods: road transportation, regulations and charges in Indonesia’, Asia Foundation, Jakarta.
Barro, R. (1999) ‘Determinants of democracy’, Journal of Political Economy 107 (6) pt 2:
S158–83.
Bertrand, M. and Mullainathan, S. (2001) ‘Do people mean what they say? Implications for subjective survey data’, American Economic Review 91 (2): 67–72.
Bils, M. and Klenow, P. (2000) ‘Does schooling cause growth?’, American Economic Review
90 (5): 1,160–83.
Björkman, M. (2006) ‘Does money matter for student performance? Evidence from a grant program in Uganda’, IGIER Working Paper No. 326, Innocenzo Gasparini Institute for Economic Research (IGIER), Università Bocconi, Milan.
Chapman, D. (2002) ‘Corruption and the education sector’, Management Systems Inter
-national, Washington DC.
Chaudhury, N., Hammer, J., Kremer, M., Muralidharan, K. and Rogers, F.H. (2006) ‘Miss
-ing in action: teacher and health worker absence in develop-ing countries’, Journal of Economic Perspectives 20 (1): 91–116.
Dee, T. (2004) ‘Are there civic returns to education?’ Journal of Public Economics 88 (9–10):
1,697–720.
Deininger, K. and Mpuga, P. (2005) ‘Does greater accountability improve the quality of public service delivery? Evidence from Uganda’, World Development 33 (1): 171–91.
Fisman, R. and Gatti, R. (2002) ‘Decentralization and corruption: evidence across coun
-tries’, Journal of Public Economics 83 (3): 325–45.
Glewwe, P. and Kremer, M. (2006) ‘Schools, teachers, and educational outcomes in develop
-ing countries’, in Handbook of the Economics of Education, Volume 2, eds Eric A. Hanushek
and Finis Welch, North Holland, Amsterdam: 945–1,017.
Gupta, S., Verhoeven, M. and Tiongson, E. (2002) ‘The effectiveness of government spend
-ing on education and health care in develop-ing and transition economies’, European Journal of Political Economy 18 (4): 717–37.
Hanushek, E. and Kimko, D. (2000) ‘Schooling, labor-force quality, and the growth of nations’, American Economic Review 90 (5): 1,184–208.
Harbison, R. and Hanushek, E. (1992) Educational Performance of the Poor: Lessons from Rural Northeast Brazil, Oxford University Press, Washington DC.
Hunt, Jennifer (2006) ‘Why are some public oficials more corrupt than others?’, in Inter-national Handbook on the Economics of Corruption, ed. Susan Rose-Ackerman, Edward
Elgar, Cheltenham.
Jamison, E., Jamison, D. and Hanushek, E. (2007) ‘The effects of education quality on income growth and mortality decline’, Economics of Education Review 26 (6): 771–88.
Karyadi, A., Istiyani, A., Simanjuntak, F. and Tanan, J.P. (2007) Indeks Persepsi Korupsi di Indonesia 2006: Survei di antara Pelaku Bisnis di 32 Wilayah di Indonesia [Corruption Per
-ception Index in Indonesia 2006: Survey among Businesses in 32 Regions in Indonesia], Transparency International Indonesia, Jakarta.
Kristiansen, S. and Pratikno (2006) ‘Decentralising education in Indonesia’, International Journal of Educational Development 26 (5): 513–31.
Kristiansen, S. and Ramli, M. (2006) ‘Buying an income: the market for civil service posi
-tions in Indonesia’, Contemporary Southeast Asia 28 (2): 207–33.
Lambsdorff, J.G. (2006) ‘Causes and consequences of corruption: what do we know from a cross-section of countries?’, in International Handbook on the Economics of Corruption, ed.
Susan Rose-Ackerman, Edward Elgar, Cheltenham.
Lanjouw, P., Pradhan, M., Saadah, F., Sayed, H. and Sparrow, R. (2001) ‘Poverty, educa
-tion and health in Indonesia: who beneits from public spending?’, World Bank Policy Research Working Paper 2739, World Bank, Washington DC.
Mauro, P. (1998) ‘Corruption and the composition of government expenditure’, Journal of Public Economics 69 (2): 263–79.
Olken, B. (2006a) ‘Corruption and the costs of redistribution: micro evidence from Indone
-sia’, Journal of Public Economics 90 (4–5): 853–70.
Olken, B. (2006b) ‘Corruption perceptions vs corruption reality’, NBER Working Paper 12428, National Bureau of Economic Research, Cambridge MA.
Olken, B. (2007) ‘Monitoring corruption: evidence from a ield experiment in Indonesia’,
Journal of Political Economy 115 (2): 200–49.
Olken, B. and Barron, P. (2007) ‘The simple economics of extortion: evidence from trucking in Aceh’, Journal of Political Economy 117 (3): 417–52.
Pradhan, M., Suryahadi, A., Sumarto, S. and Pritchett, L. (2001) ‘Eating like which “Joneses”? An iterative solution to the choice of a poverty line “reference group”’,
Review of Income and Wealth 47 (4): 473–87.
Pritchett, L. (2001) ‘Where has all the education gone?’, World Bank Economic Review 15 (3):
367–91.
Rajkumar, A.S. and Swaroop, V. (2008) ‘Public spending and outcomes: does governance matter?’, Journal of Development Economics 86 (1): 91–111.
Reinikka, R. and Svensson, J. (2004) ‘Local capture: evidence from a central government transfer program in Uganda’, Quarterly Journal of Economics 119 (2): 679–705.
Simanjuntak, F. (2009) Indeks Persepsi Korupsi Indonesia 2008 dan Indeks Suap [Indonesian
Corruption Perception Index 2008 and Bribery Index], Transparency International Indonesia, Jakarta.
Sumarto, S., Ariianto, A. and Suryahadi, A. (2003) ‘Governance and poverty reduction: evidence from newly decentralized Indonesia’, in The Role of Governance in Asia, ed.
Y. Shimomura, Institute of Southeast Asian Studies, Singapore.
Svensson, J. (2005) ‘Eight questions about corruption’, Journal of Economic Perspectives
19 (3): 19–42.
Widyanti, W. and Suryahadi, A. (2008) The State of Local Governance and Public Services in the Decentralized Indonesia in 2006: Findings from the Governance and Decentralization Survey 2 (GDS2), SMERU Research Institute, Jakarta.
World Bank (2007) Investing in Indonesia’s Education: Allocation, Equity, and Eficiency of Pub -lic Expenditures, World Bank, Jakarta.
APPENDIX TABLE 1 Corruption, Public Spending and School Performance: Controlling for School Enrolmenta
Pooled OLS Models
(1) (2) (3)
Panel A: log (Average mathematics score)
log (Public spending per student) 0.021 –0.123 –0.009
(0.026) (0.300) (0.032)
log (Private spending per student) 0.044 0.045 0.046
(0.031) (0.029) (0.030)
Less corrupt region dummy x log (public spending) 0.078
(0.067)
Junior secondary net enrolment rate –0.297 –0.283 –0.348
(0.321) (0.331) (0.345)
log (Public spending per student) 0.001 –0.048 –0.014
(0.010) (0.102) (0.017)
log (Private spending per student) 0.003 0.006 0.005
(0.012) (0.012) (0.013)
Poverty rate –0.392** –0.316* –0.376**
(0.190) (0.172) (0.190)
CPI 0.016
(0.013)
CPI x log (Public spending) 0.009
(0.022)
Less corrupt region dummy 0.009
(0.016)
Less corrupt region dummy x log (public spending) 0.033
(0.031)
Junior secondary net enrolment rate –0.109 –0.082 –0.126
(0.194) (0.189) (0.212)