Submitted a project report in partial fulfillment of the requirements for the award of Master of Mathematics. I declare that this project report entitled "Performance of Brownian-Motion-Generated Universal Portfolios during COVID-19 Pandemic" was prepared by KHOR WEI SHENGE and meets the required standard for submission in partial fulfillment of the requirements for the award of Master of Mathematics at Tunku Abdul Rahman University. Brownian motion is one of the famous stochastic processes that was heavily applied in various financial derivatives prices.
The aim of this study is to study the performance of finite order Brownian motion generated universal portfolio using 3 independent Brownian motion. This study also aims to study the effect of parameters of Brownian motion in forming the universal portfolio generated by Brownian motion to provide further insight into parameter selection. According to the result, the Brownian Motion Universal portfolio outperforms the benchmark (compare with the respective listed index in each country), especially in terms of Sharpe ratio and Sortino ratio. follow the winner and follow the loser to avoid forward-looking bias and be practical.
Winning (medium winner) of Thailand's share 31 Table 4.3.11: Top 5 Losing and Top 5 Wining portfolio Follow. Loser (Extreme Loser) of Malaysia's stock 32 Table 4.3.12: Top 5 Losers and Top 5 Wining Portfolio Follow. Loser (Extreme Loser) of Singapore's stock 33 Table 4.3.13: Top 5 Losing and Top 5 Wining portfolio Follow.
Loser (Extreme Loser) of Thai Stocks 34 Table 4.3.14: Portfolio of Top 5 Losers and Top 5 Winners Follow the loser.
1 INTRODUCTION
- General Introduction
- Problem Statement
- Aim and Objectives
- Scope and Limitation of the Study
- Contribution of Study
- Literature Review
- Covid – 19 Pandemic and Stock Market
- Universal Portfolio
A universal portfolio generated by Brownian motion is studied with the Malaysian, Singaporean and Thai stock markets. Previous work on Brownian motion has created a universal portfolio that focuses its performance on a normal business cycle with varying holding periods. To study the performance of Brownian motion, a universal portfolio was created in the stock market of Malaysia, Singapore and Thailand during the COVID 19 pandemic. ii).
To study the effects of the Brownian motion parameter generated universal portfolio on the final wealth. The research includes the performance of the universal portfolio generated by Brownian motions in the stock market of Malaysia, Singapore and Thailand. The purpose of this project is to study the performance of the universal portfolio generated by Brownian motion in the stock market of Malaysia, Singapore and Thailand during the COVID 19 pandemic.
The project also aims to provide some useful insight into the choice of Brownian motion parameter to generate universal portfolio. An empirical study on the performance of universal portfolio generated by Holder inequality ratio based on Malaysia stock market conducted by Tan and Yap investigated the performance of Brownian motion generated universal portfolio in Malaysia stock market better than the constant rebalance portfolio.
3 METHODOLOGY
Introduction
Basic terminology and Review in Universal Portfolio
- Finite Order Universal Portfolio
Tan (2013) adopted the approach of a universal portfolio generated by probability distribution and introduced the universal portfolio with finite moving order generated by probability distribution. Therefore, it is more practical to use the universal portfolio of Tan (2013) in the investment strategy than that of Cover and Ordentlich (1996). The order ν of universal portfolio is the number of days of stock data used in calculating the next day's portfolio strategy.
For a small order ν (that is, ν =1,2,3), the computation time and memory storage requirements to calculate the portfolio will be significantly reduced. Using the derivations of Lim (2013) and Pang (2017) on order 1, 2, 3 universal portfolios, we get the following portfolio strategy formula.
Brownian Motion
Ross (2007) suggested that the process {𝑌𝑌𝑛𝑛𝑛𝑛} has stationary and independent elevations, where 𝑌𝑌𝑛𝑛𝑛𝑛 has a Gaussian distribution with mean 𝑛𝑛𝜇𝜇𝑛𝑛 and variance 𝑛𝑛 𝜎𝜎𝑛𝑛2 𝑓𝑓𝑐𝑐𝑟𝑟 𝑙𝑙= 1.2,.
Software Configuration
- Hardware / Software setting Core Hardware
Data collection and Data Cleansing
- FTSE Bursa Malaysia KLCI
- FTSE Straits Times Index
- SET 50
- Sample period
This research aims to cover the pandemic period, and yet there is no formal definition of the end of the COVID-19 pandemic period, so this research covers the study until the end of June 2022, when more than half of the global population received at least one dose of vaccination according to global database (Mathieu et al., 2021). Most of the country has decided to relax the limit on the border to even open their table to vaccinated people. The three economies examined in this research have also opened their border to the globe at the end of the trial period.
Portfolio construction
Introduction
Simple Optimal Allocation
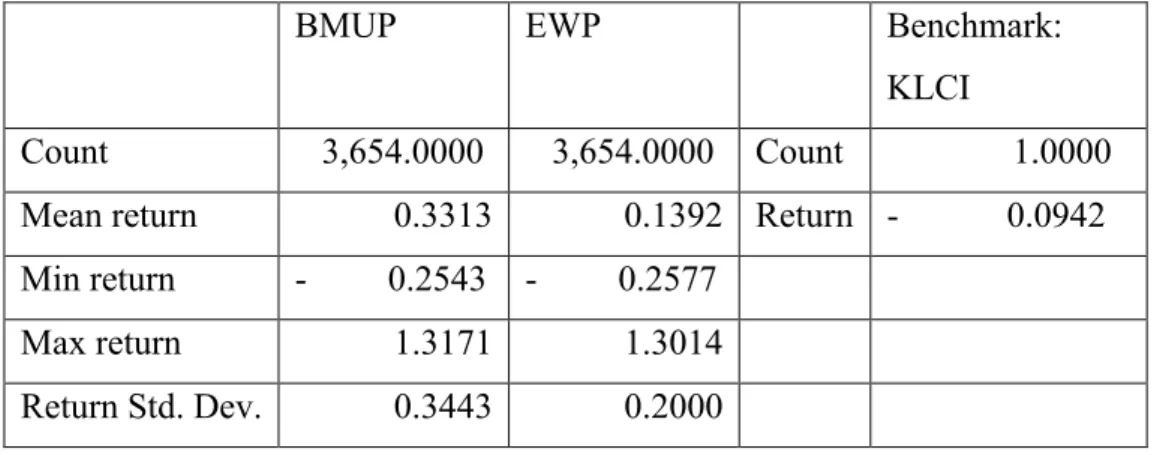
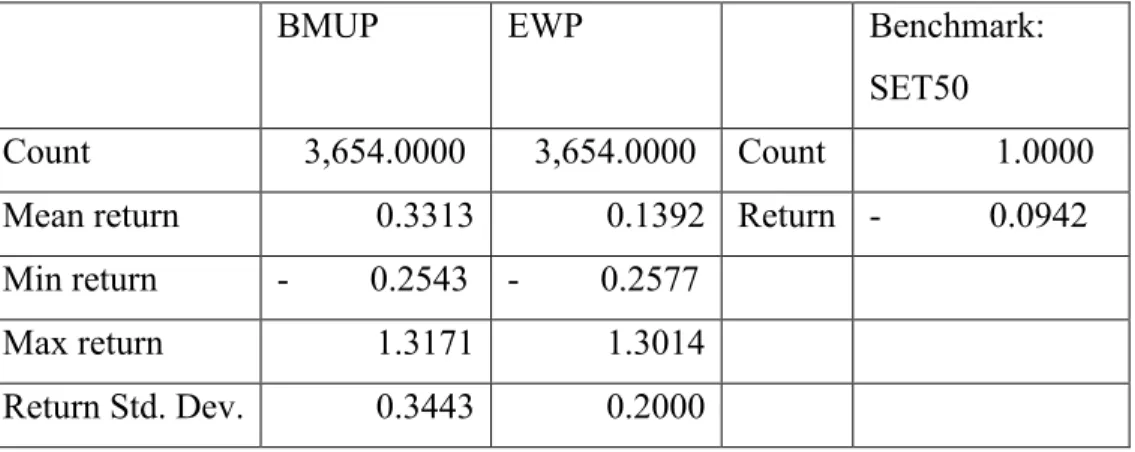
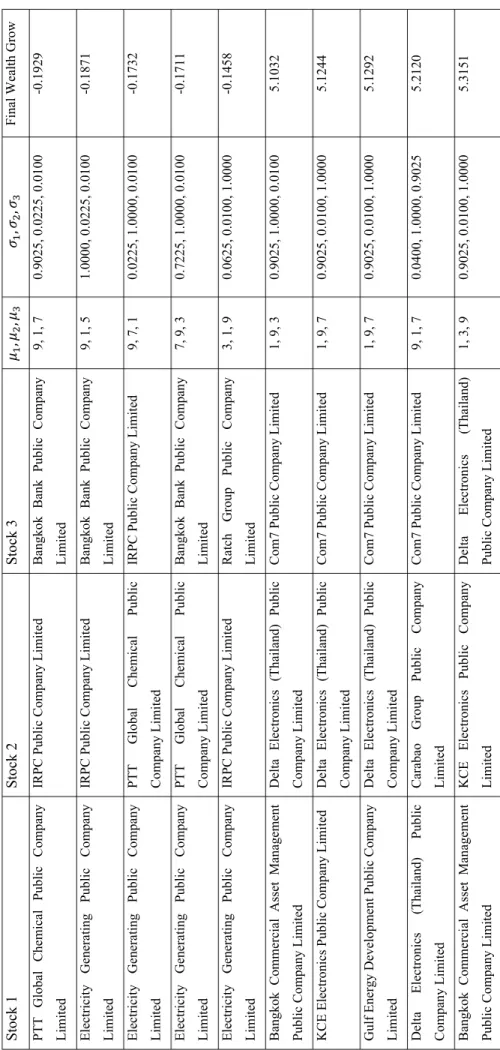
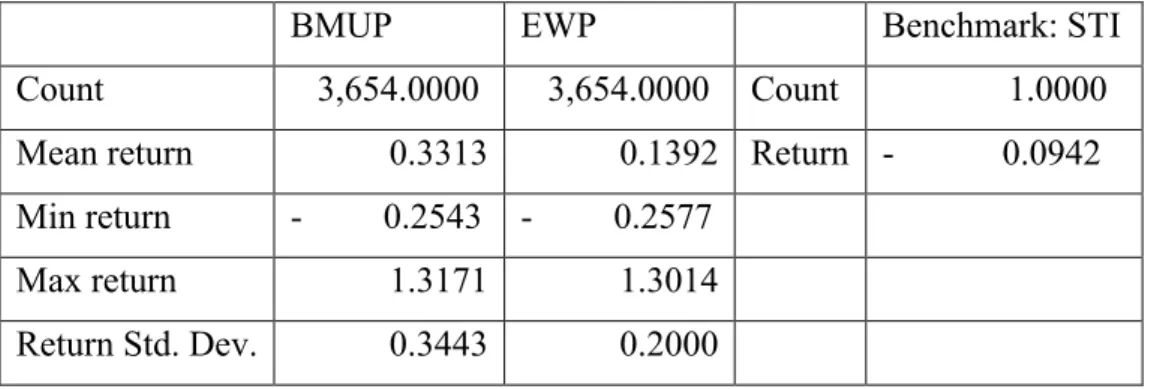
From the simple statistics above, we can see that the average return of the Brownian motion generated portfolio is higher than the benchmark (the respective index within each economy ie KLCI for Malaysia, SIT for Singapore and SET for Thailand) and the traditional equally weighted portfolio. By further researching each portfolio mentioned above in each economy, this research finds that some portfolios are very good or very bad because the portfolio is not diversified as the combination can take 3 stocks which are consistently bad and lead to the worst result. In addition, this research further investigates the risk profile of the above portfolios, including Sharpe ratio, Sortino ratio and maximum D.
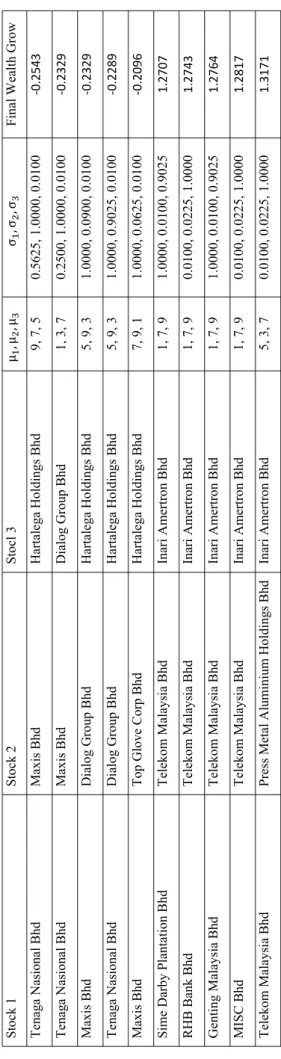
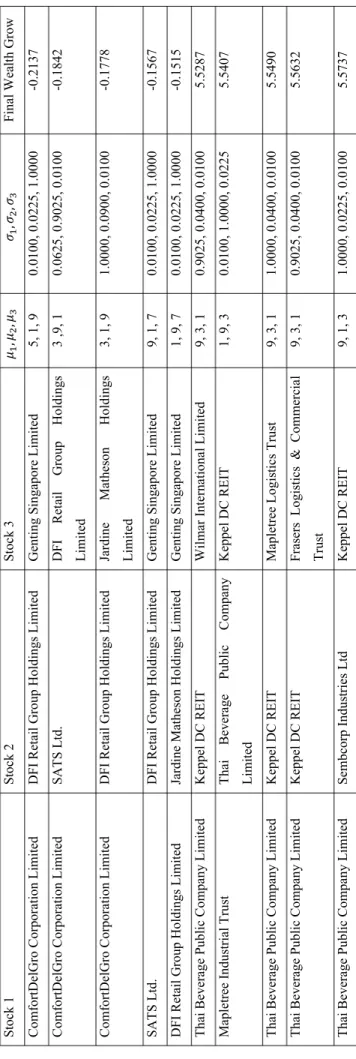
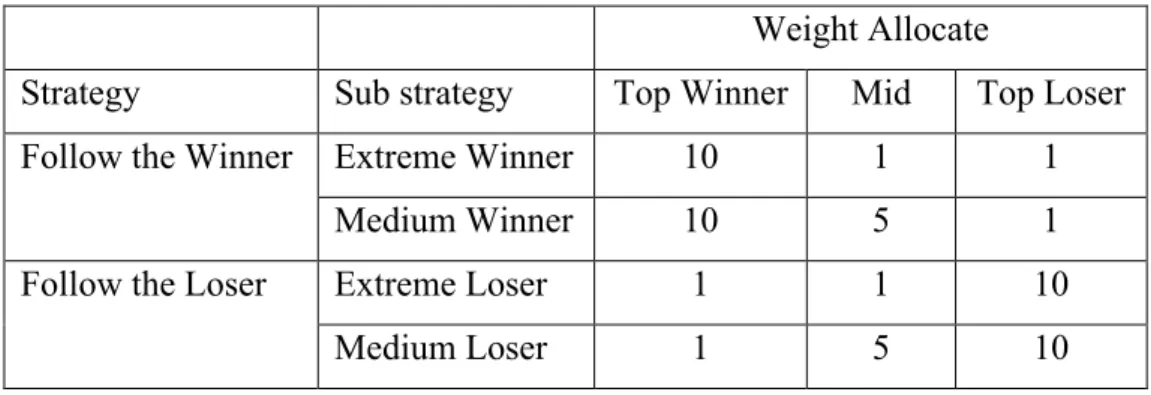
Based on the top winning and losing portfolios from each economy, it is intuitive to show that the portfolio tends to perform as well as the stocks that are the most difficult to invest in. According to the Brownian motion portfolio methodology, higher 𝜇𝜇 and 𝜎𝜎 stocks that have a positive return within the portfolio tend to promote a positive portfolio return. A higher 𝜎𝜎 actually helps to give more weight to the stocks in the portfolio.
It is the most important contributor in deciding the weight of stocks to be invested within the portfolio. According to the discussion above, the top five winning portfolio and top five losing portfolio just follow the same logic, investing heavily in stocks that win or lose the most with high 𝜇𝜇 and 𝜎𝜎. However, the positive ssde of the result shows that the winning portfolio outperforms the losing portfolio.
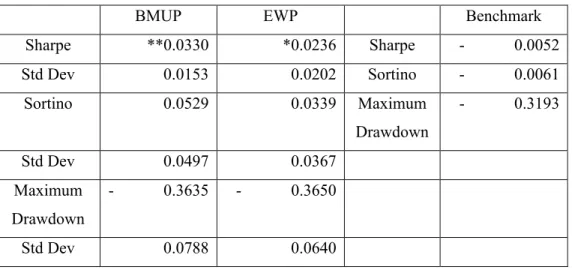
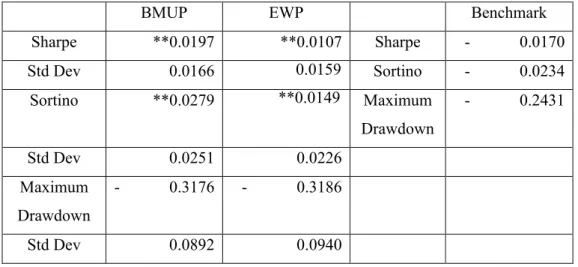
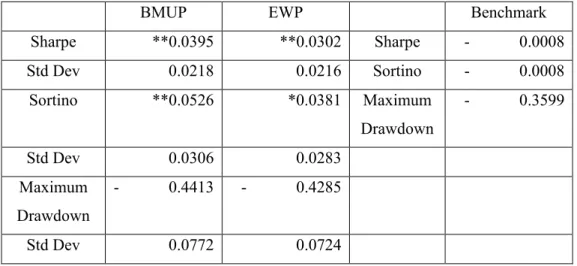
Based on the risk profile above, BMUP's form ratio outperforms their benchmark to the respective economy. The return, although not statistically significant, but the average return is higher than benchmark and EWP. BMUP offers better average return, average form ratio and average sortino ratio, thus a better choice for investment strategy.
Follow the Winner and Follow the Loser Strategy
The risk profile suggests that Follow the winner risk profile is indifference compared to benchmark.
Summary
Conclusions
Recommendations for future work
En global database over COVID-19-vaccinationer. 2019), 'Performance of Finite Order Stochastic Process Generated universal Portfolios', Malaysian Journal of Mathematical Science 13(S), s. 2015), Universal portfolios generated by reciprocal functions of price relatives, Journal of Mathematics 11, pp. 2019), 'Universal portfolios generated by the Pseudo f-Divergences', IOSR Journal of Mathematics 15, s. 2019), 'Universal portfolios generated by the Inequality Ratio', IOSR Journal of Mathematics 15, s. 1082.KL Hong Leong Financial Group Berhad 2444 .KL Kuala Lumpur Kepong Berhad 4863.KL Telekom Malaysia Berhad 5681.KL Petronas Dagangan Bhd 3182.KL Genting Berhad.
J36.SI Jardine Matheson Holdings Limited U11.SI United Overseas Bank Limited BN4.SI Keppel Corporation Limited V03.SI Venture Corporation Limited AJBU.SI Keppel DC REIT. C07.SI Jardine Cycle & Carriage Limited G13.SI Genting Singapore Limited 9CI.SI CapitaLand Investment Limited. H78.SI Hongkong Land Holdings Limited C38U.SI CapitaLand Integrated Commercial Trust S63.SI Singapore Technologies Engineering Ltd F34.SI Wilmar International Limited.