1
Removal of Hardness from Groundwater by Electro-coagulation Using Aluminium Electrode
By
Aizul Adli bin A. Aziz
Dissertation submitted in partial fulfillment of the requirement for the
Bachelor of Engineering (Hons) (Civil Engineering)
SEPTEMBER 2012
Universiti Teknologi PETRONAS Bandar Seri Iskandar
31750 Tronoh
Perak Darul Ridzuan
2 ABSTRACT
There are many problems associated with industrial and domestic use of hard water. The need to develop of modern and cost effective technologies to remove water hardness is highly demand due to the growing demands for water of high quality both for industrial and domestic uses. Various techniques with their own advantages and disadvantages can be used for removal of water hardness. One of the techniques is the electro-coagulation process (EC). This study is carried out to investigate the efficiency of EC process in hardness removal from brackish groundwater using aluminium electrodes.
This EC process is conducted in batch reactor and under different current density and distance between electrodes. Moderately hard groundwater from tube well 2 of intial hardness 118.34mg/L could be reduced to 52.17mg/L within one hour by using current density of 20V/20mm2 and electrode spacing of 2cm. The production rate was 200mL/hour. The removal of hardness by using batch volume of 200mL is greater than 5000mL. The removal efficiency of batch of 200mL is 72.18% while the batch of 5000mL is 17.25%. The concentration of two major contribution cation which are calcium and magnesium have been decreased to 200 mg/L and 150 mg/L respectively.
Hardness in groundwater can be reduced by electrocoagulation process. The production rate was 200mL/hour. This rate of production is considered appropriate only for drinking water supply.
3
ACKNOWLEDGEMENTS
First and foremost, I would like to take this opportunity to direct my utmost indebtedness to my Final Year Project supervisor, AP Dr. Nasiman Sapari for his prized supervision and advices throughout the entire project. His provisions, tolerance, and willingness to assist me in the problem or complications that I confronted in my project have contributed tremendously to my project. I would also like to take this opportunity to acknowledge the Final Year Project coordinator, Ir Idris Othman for his effort in guaranteeing the project is developed smoothly within the time frame specified. Last but not least, I would like to give my utmost gratitude and appreciation to my family and fellow friends for their provision and inspiration so that this project can be accomplished fruitfully.
4
TABLE OF CONTENTS
ABSTRACT . . . 2
ACKNOWLEDGEMENTS . . . 3
CHAPTER 1: INTRODUCTION . . . 8
1.1 Project Background . . . 8
1.2 Problem Statement . . . 9
1.3 Objectives and Scope of Study . . . 9
CHAPTER 2: LITERATURE REVIEW . . . 10
2.1 Hardness . . . 10
2.2 Sources of Hardness . . . 10
2.3 Types of Hardness . . . 12
2.3.1 Magnesium . . . 12
2.3.2 Calcium . . . 12
2.4 Electro-coagulation Precipitation . . . 13
2.5 Other Types of Hardness Treatment . . . 14
2.5.1 Electro-dialysis(ED) . . . . 14
2.5.2 Nano-filtration(NF) . . . . 15
2.5.3 Reverse Osmosis(RO) . . . . 16
2.5.4 Synthetic Resin . . . . 17
5
CHAPTER 3: METHODOLOGY . . . 18
3.1 Process Flow Methodology . . . . 18
3.2 Gantt Chart, Key Milestone and Project Activities . 20 3.3 Physical and Chemical characteristics of groundwater to be
Tested . . . 21
3.4 Water Quality Standards . . . . 23
3.5 Tests Procedure and Equipment Needed . . 24
CHAPTER 4: RESULTS AND DISCUSSION . . . . 27
4.1 Water Quality Standard Tests Result from selected tubewells in Kg. Puteh Groundwater Treatment, Kelantan . 27 4.2 Electrochemical Results on Synthetic Hardwater . 31 4.2.1 Electrode Distance Parameter . . 31 4.2.2 Voltage Parameter . . . . 32 4.3 Electrochemical Results on Groundwater from Tubewell in
Kampung Puteh Water Treatment Plant, Kelantan . 34 CHAPTER 5: CONCLUSION AND RECOMMENDATION . . 34
REFERENCES: . . . 35
APPENDICES: . . . 39
6 LIST OF FIGURES
Figure 1 Electro-chemical schematic diagram 9
Figure 2 Electro-dialysis (ED) Schematic Diagram 14
Figure 3 Nano-filtration (NF) Schematic Diagram 15
Figure 4 Schematic flow of RO desalination plant 16
Figure 5 Schematic Diagram of RO Pilot Plant 16
Figure 6 Synthetic Resins 17
Figure 7 Continuous Flow of Packed Sand Gravel Filter and Synthetic
Resins 17
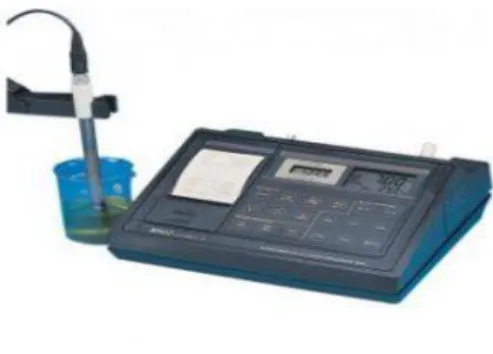
Figure 8 pH Meter 22
Figure 9 Turbidimeter 23
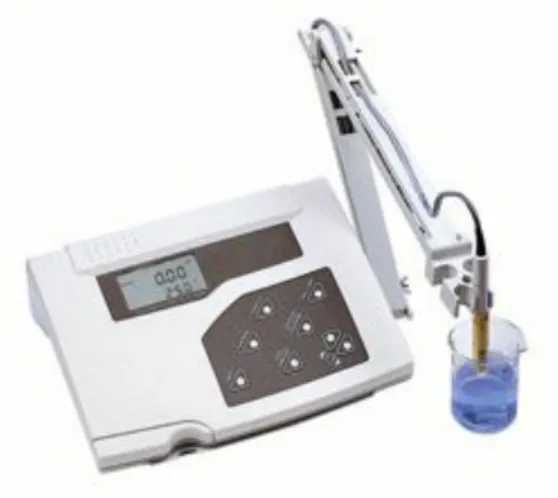
Figure 10 Conductivity Meter 24
7 LIST OF TABLE
Table 1 WHO Drinking Water Quality Standards, 1996 11
Table 2 Gantt Chart 20
8 1.0 INTRODUCTION
1.1 Project Background
Groundwater in Malaysia is a resource that need to be exploited to meet the demand of water for various uses. This water represents the underground part of „water cycle‟ and contains a high percentage of freshwater of the world. The utilization of groundwater can help to solve the water shortage in areas where surface water is limited.
In Malaysia, Kelantan is currently using groundwater as the source of water supply.
Groundwater is generally less affected by pollution because it is protected by the soil that acts as a filter. However it may contain minerals such as calcium and magnesium or other metals in excessive levels that make the water unsuitable for drinking water supply.
Treatment of groundwater normally involves aeration, oxidation, coagulation, flocculation, sedimentation, filtration and chlorination. These treatments involve many chemicals and processes which are not suitable for remote communities where support services and technical expertise is lacking. Therefore it is necessary to find a simpler method of treatment that does not required high level of expertise for the maintenance and operation of the system.
Electrochemical oxidation or electro coagulation (EC) is an alternative method for hardness removal from ground water. It is found to be a promising process for solid liquid separation with simple equipment and operation. This treatment process has increasingly being used in South America and Europe for treating industrial wastewater containing metals. However, the process is still not fully utilized for removal of hardness in groundwater. The EC is expected to be economically more feasible than conventional chemical oxidation. An EC process does not require chemicals addition. It only require a sacrificial metal anode (mostly iron and aluminum) to be transformed into ions electron solution to precipitate the iron and other metals by directly electrical current.
9 1.2 Problem Statement
Groundwater was found to be an economical source of water supply for various remote industries and communities. However, hardness may be present in excessive levels that render the water unsuitable for drinking water supply. This contamination can cause problems including side effect to human health. Therefore it is necessary to treat the hard groundwater. Treatment for hardness removal from groundwater commonly involves nano-filtration, electro-dialysis, reverse osmosis and synthetic resin. These methods are not suitable for remote communities where support services and technical expertise is lacking. Therefore it is necessary to find a simpler method of treatment that does not require high level of expertise for the maintenance and operation of the system.
Electrochemical oxidation or electro-coagulation (EC) is an alternative method for metal removal from ground water. It is found to be a promising process for solid liquid separation with simple equipment and operation.
1.3 Objectives and Scope of Study
This research attempts to find an alternative solution of hardness removal by direct electro-precipitation and coagulation without the use of chemicals dosing. This method will be applicable for areas that are far away from the main water supply such as isolated resort, rural communities and industries. The objective of this study is to develop groundwater treatment module using only electricity and water from tubewell. The findings of this research will make hard groundwater due to high calcium and magnesium from tube wells become suitable for drinking and industrial use. Preliminary work has shown that electrochemical treatment of groundwater can become a possible method for providing quality water for small communities.
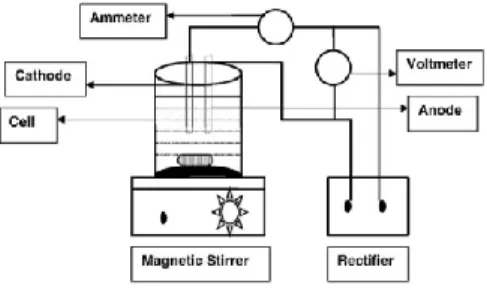
Figure 1: Electro-chemical schematic diagram (B. P. Dash and S. Chaudhari, 2005)
10 2.0 LITERATURE REVIEW
2.1 Hardness
Pollutions that has been created by human and naturally have reduced the suitability and availability of water for human consumption [1-3]. Hardness has always been identified as an important water quality parameters in industrial water consumption in manufacturing of high quality products [4, 5]. Amount of calcium and magnesium cations in water are the major cause of groundwater hardness [6-10]. The amount of iron, manganese, strontium and some other metals that can cause groundwater hardness can be ignored compared to the amount of calcium and magnesium [11]. The evidence of health significance of water hardness has been proved in the late 1950‟s. The relationship between water hardness and the incidence of vascular diseases was first described in 1957 [12].
2.2 Sources of Hardness
Dissolved polyvalent metallic ions from sedimentary rocks, seepage and runoff from soils are the principal natural sources of hardness in water [13]. The two principal cations which are calcium and magnesium are present in many sedimentary rocks, the most common being limestone and chalk [14]. Decomposition of calcium and magnesium aluminosilicates produces cations in water and also from dissolution of limestone, magnesium limestone, magnesite, gypsum and other minerals at higher concentrations [15].
11 WHO Drinking Water Quality Standards, 1996
Parameters Max. allowable/ Approval limits
Color (Pt.Co Units)
50
Turbidity 1
pH 6 – 8.5
Chemical characteristics (mg/L)
Arsenic 0.05
Barium 1
Cadmium 0.01
Calcium 200
Chloride 600
Chromium (hexavalent) 0.05
Copper 1.5
Cyanide 0.2
Fluoride 1.4 – 2.4
Iron 1
Lead 0.05
Magnesium 150
Manganese 0.5
Phenolic compounds 0.002
Selenium 0.01
Sulphate 400
Total dissolved solids 1500
Zinc 15
12 2.3 Types of Hardness
2.3.1 Magnesium
Magnesium in groundwater from igneous rock was primarily derived from ferromagnesian minerals like olivine, pyroxenes, amphiboles and dark colored micas [16]. For metamorphic and other altered rock, Magnesium occurs in minerals like chlorite and serpentine [17]. In sedimentary rock, magnesium occurs as carbonates, sometimes mixed with calcium carbonate [18]. Dolomite contains calcium and magnesium in equal amount. When groundwater have been in contact with dolomite or with Mg-rich evaporates, Mg could be expected to become the dominant cation in the groundwater [19]. The recommended maximum limit of Mg ranged from 50 to 150 mg/L [20].
2.3.2 Calcium
Calcium is one of the principal cations in groundwater [6-10, 21]. In sedimentary rock, calcium occurs as carbonate (calcite and aragonite), calcium magnesium carbonate (dolomite), calcite (limestone), and calcium sulphate (gypsum and anyhydrite). Some calcium fluoride may also be present [22]. Sources of calcium from igneous rock are silicates minerals like pyroxenes, amphiboles and feldspar [23]. Since the solubility of these minerals is low, water from igneous or metamorphic rock tends to be low in calcium [24]. Groundwater from limestone and other calcareous deposits is generally hard and can be expected to be saturated solution of calcite [25]. Calcium sources in alluvial and other unconsolidated materials consist primarily of the various minerals in the rock and soil fractions in these deposits [23]. Maximum allowable calcium in drinking water is 200 mg/L [26].
Hardness
Magnesium Calcium
13 2.4 Electro-coagulation Precipitation
A lot of problem is created by water hardness in industry as well as in domestic use. It is essential to remove the water hardness considering the problems which are caused by it [27]. Ion exchange resins and the usage of chemical substances are the usually used techniques for the removal of water hardness [7, 10, 15, 28, 29]. The quality of the product water is undesirably affected by applying these techniques. Sodium concentration of water increases during the ion exchange process which is very dangerous to a patient with hypertension who needs to limit the consumption of sodium.
Thus, ion exchange should not be used to remove hardness of large quantity of water [13]. On the other hand, the water hardness will be highly permanent by using lime for softening. Highly skillful person is required in order to determine to exact amount of lime need to be added into the softening system [30, 31]. The weight of insoluble particles is increased in the liming process by using alum or ferric chloride [30]. Besides its economic cost, this technique also has undesired health effects such as Alzheimer.
Moreover, the chlorination efficiency is decreased as the pH of water will be decreased to
<7.8 by the lime [27]. Besides increasing the sludge production, coagulants also increase total solids in the effluents [29]. Adsorption is one another technique to remove hardness but due to the necessity of backwashing, the technique also gained less attention [28, 29].
The use of membrane also will face a lot of problems such as the problem of scaling and membrane fouling [15, 32, 33]. Electro-chemical or electro-coagulation is the most preferably technique due to its simplicity and is used in removal of irons as well as organic matters [31]. Metal anode which is aluminium will be used in this process by applying direct electric current [34, 35, 36]. The following reactions will occur in anode:
In anode:
M(s) M(aq)n+ + ne- (1)
2H2O + 2e- 4H+(g) + O2(g) + 4e- (2) In cathode:
M (aq)n+
+ ne- M (s) [1]
2H2O + 2e- H2 (g) + 2OH- (4)
14 2.5 Other Types of Hardness Treatment
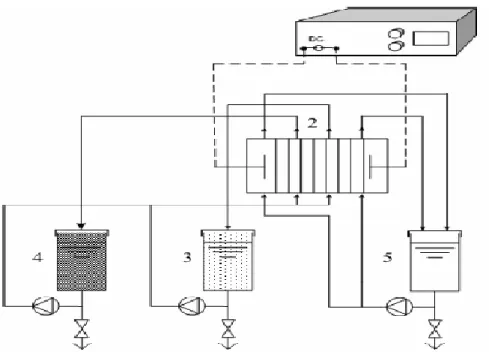
2.5.1 Electro-dialysis(ED)
Figure 2 : Electro-dialysis schematic diagram (K. Walha and R. B. Amar, 2007)
There is a series of anion and cation exchange membranes are arranged in an alternating pattern between an anode and a cathode in a basic ED cell. During ED experimental studies, aqualyser P1 equipment is used. Ion concentrations increase in alternating compartments with a simultaneous decrease of ion in other compartment at the end of ED test. The equipment consists of a stack with 20 pairs of CMV cationic membranes and AMV anionic membranes with 0.27m2 area. A rectifier will provide a DC power at maximum 30V and 3A. A schematic diagram of the ED is shown if Figure 2. The pilot plant consists of three hydraulic circuits:
a circuit for the solution to process.
a circuit of concentration which salinity increase vs. time.
a circuit for electrode rinsing.
15 2.5.2 Nano-filtration(NF)
Figure 3 : Nano-filtration schematic diagram (A. Gorenflo and D. Velazquez-Padron, 2002)
A spiral wound module of NF pilot unit is shown in Figure 3. A bypass and concentrate valve are used to adjust transmembrane pressure and cross flow velocity independently. The inner recirculation will adjust the recovery. A computer will record temperature, permeate and concentrate flow. The filtration characteristics of the membrane are high rejection of pesticides and organic matters and also high passage of calcium. There are three layers within the membrane where the top layer of thickness 0.02µm are polypiperazine, a microporous support(polysulfone) and a support(polyester).
The surface of the membrane is negatively charged.
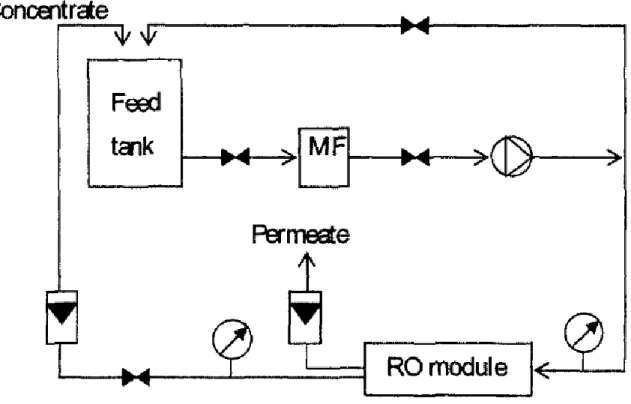
16 2.5.3 Reverse Osmosis(RO)
Figure 4: Schematic flow of RO desalination plant (M. D. Afonso and J. O. Jaber, 2004)
Figure 5: Schematic Diagram of RO Pilot Plant (M. D. Afonso and J. O. Jaber, 2004)
17 2.5.4 Synthetic Resin
This method uses waste of polystyrene foam and plastics such as foam packaging for food and air bubble plastics as synthetic resins with a combination of packed sand-gravel filters in columns system to remove hardness in groundwater. The most effective method to remove hardness in groundwater is ion exchange process. Sodium and potassium ions can be exchanged for calcium and magnesium ions. The ionic impurity in water can be removed by commercial resin which is presently used in individual and industrial purposes. Natural green sand or synthetic zeolite resin is used as the ion exchange resin.
Figure 6: Synthetic Resins
Figure 7: Continuous Flow of Packed Sand Gravel Filter and Synthetic Resins ( P.
Pentamwa and W. Thipthara, 2011)
18 3.0 METHODOLOGY
3.1 Process Flow Methodology
The research project will be executed in three stages as described below and also outlined in the flow chart of research activities.
3.1.1 Groundwater Sampling and Analysis
Groundwater from existing water treatment plant has been selected which is from Kampung Puteh Water Treatment Plant which contains all 140 number of wells .
Groundwater from four different tube wells have been selected. The first well is Combine Well which is the water from all tube wells is pumped in into a tank which is called Combine Well. Two samples from shallow wells(about 100m in depth) have been selected which are from Well 2 and Well18. One sample from the deep well(about 200m in depth) which is Well 3 has been selected. The quality of the groundwater sample which are concentration of calcium, magnesium, sodium, potassium, bicarbonate, sulphate and chloride, turbidity, total dissolved solids, colour, pH and conductivity.
Parameters Method Equipment
Calcium and Magnesium Colorimetric method HACH 2800
Turbidity Nephelometric method 2100Q Portable
Turbidimeter
Colour Spectrophotometer HACH 2800
pH Probe and meter HQ11d Portable Meter
Conductivity
Measure of the ability of water to pass an electrical current
HQ11d Portable Meter
19
3.1.2 Preliminary Electrocoagulation Experiment
Preliminary electrocoagulation experiment was carried out using batch experimental to determine the optimium electrode spacing and current density. The experiment was carried by using synthetic hardwater of initial hardness of 1400 mg/L as CaCO3. Variation of electrode spacings of 1cm, 2cm, 3cm and 4 cm were being tested at current density of 2V. The 2cm spacing has been determined as the optimum one. By using 2cm spacing, current density of 5V, 8V, 12V, 15V and 20V were being tested to determine the optimum current density.
3.1.3 Electrocoagulation Experiment Using Groundwater
Based on the groundwater test results, Well 2 has been determined to contain the highest hardness concentration which is 118.39 as CaCO3 mg/L. The groundwater from Well 2 has been used for futher experiment to determine to effectiveness of removal of hardness from groundwater by electrocoagulation by using aluminium electrode. Two different volumes of batch were used which are 200mL and 5000mL to identified the effectiveness of removal in a larger volume.
Selection of tube well from existing groundwater
treatment systems
Analysis of groundwater
quality
Run the treatment system using batch
experimental
Sampling and analysis of
water hardness
Report Writing
20
3.2 Gantt Chart, Key Milestone and Project Activities 3.2.1 Final Year Project I
3.2.2 Final Year Project II
21
3.3 Physical and Chemical characteristics of groundwater to be Tested 3.3.1 pH
pH refers to the activities of hydrogen ions in the water, expressed as the negative logarithm of the H+ activity in moles per litre. At a pH of 7, the H+ activity is 10-
7 and the solution is considered neutral. When the pH is less than 7, the solution behaves as an acid (especially below 4). Above pH 7, the solution reacts like a base. Most natural waters are within a pH range of 6 to 8.5. Most excess hydrogen-ion concentration result from the presence of dissolved carbon dioxide, which has weak chemical bonds.
3.3.2 Total Dissolved Solids
The total dissolved solids content (TDS) or total salt concentration of groundwater varies less than 100 to more than 100,000 mg/L. groundwater is classified according to its TDS as:
Fresh <1000mg/L
Moderately saline 3000 – 10,000mg/l Very saline 10,000 – 35,000 mg/L Briny or Brackish > 35,000mg/L
According to the Who standard, the recommended the maximum limit for the TDS content of drinking water is 500 mg/L.
3.3.4 Color
Color of water is expressed in Platinum-Cobalt (Pt Co) Color Units. Color is an indicator of organic compounds in the water. Light to dark-brown discoloration has been observed in groundwater with exposed peats or other organic deposits. Humic flavic type acids and protein-lignin compounds that comprise the stable organic) matter (humus) in the soil probably cause most of this color. Brownish discoloration can also occur when groundwater with dissolved ferrous iron is exposed to the atmosphere and insoluble ferric hydroxides are formed. Recommended maximum allowable color is 50 Pt Co unit.
22 3.3.5 Turbidity
Clay, silt and other fines that enter the well from the aquifer primarily cause turbidity of groundwater. Water from wells in fractured or cavernous rock exposed to the surface, or from springs which discharge shallow groundwater, can be muddy after rainy periods. Oxidation of dissolved ferrous iron and manganese to insoluble forms also contributes to turbidity. A milky appearance of the water discharged by a well may be caused by cascading water inside the well. Turbidity is expressed in Nephelometric Turbidity [2] or Formazin Turbidity unit (FTU).
3.3.6 Conductivity
The property of water to conduct an electric is related to the dissolved solids the water contains. Pure distilled water is an extremely poor electrical conductor, but an addition of small amounts of soild materials can readily makes it conductive.
Conductivity is expressed in µmho/cm or µS/cm.
3.3.7 Calcium and Magnesium
Calcium is one of the principal cations in groundwater. In sedimentary rock, calcium occurs as carbonate (calcite and aragonite), calcium magnesium carbonate (dolomite), calcite (limestone), and calcium sulphate (gypsum and anyhydrite). Some calcium fluoride may also be present . Sources of calcium from igneous rock are silicates minerals like pyroxenes, amphiboles and feldspar. Since the solubility of these minerals is low, water from igneous or metamorphic rock tends to be low in calcium. Groundwater from limestone and other calcareous deposits is generally hard and can be expected to be saturated solution of calcite. Calcium sources in alluvial and other unconsolidated materials consist primarily of the various minerals in the rock and soil fractions in these deposits. Maximum allowable calcium in drinking water is 200 mg/L.
Magnesium in groundwater from igneous rock was primarily derived from ferromagnesian minerals like olivine, pyroxenes, amphiboles and dark colored micas. For metamorphic and other altered rock, Magnesium occurs in minerals like chlorite and serpentine. In sedimentary rock, magnesium occurs as carbonates, sometimes mixed with calcium carbonate. Dolomite contains calcium and magnesium in equal amount.
23 3.3.8 Sodium
Sodium is primarily derived from feldspars in igneous rock and its weathering products (clay minerals) in other material. Shale and clay layers often yield water with relatively high sodium content. Other sources of sodium are leachate and deep percolation water from the upper soil layers and contamination of groundwater by salty connate water or water of marine origin. Brines and other salty waters, which usually occur at great depth, contain large amounts of sodium.
3.3.9 Potassium
Potassium is less common than sodium in igneous rock, but more abundant in sedimentary rock as potassium feldspars. These minerals, however, are very insoluble so that potassium levels in groundwater normally are much lower than sodium concentrations.
3.3.10 Bicarbonate
Sources if bicarbonate (HCO3) include CO2 from the atmosphere, CO2 produced by the biota of the soil or by the activity of sulphate reducers and other bacteria in deeper formations, and the various carbonate rocks and minerals. Bicarbonate concentrations of more than 200 mg/L are not uncommon in groundwater and higher concentrations can occur where CO2 is produced within the aquifer.
3.4 Water Quality Standard
Parameter Acceptable Value Source of reference
Total Coliform 5000MPN/100ml WHO1
Turbidity 1000 NTU WHO2
Colour 300 TCU WHO1
Ph 5.5-9.0 MAL
Total Dissolve Solids 1500 mg/L WHO1
WHO1: Refers to WHO International Standards for Drinking Water 1963.
WHO2:Refers to WHO Guidelines for Drinking Water Quality Vol. 1&2 1984.
MAL:Refers to values adapted for Malaysian conditions
Reference: National Standard for Drinking Water Quality,2nd version,2004
24 3.5 Tests Procedure and Equipment Needed
3.5.1 pH
Equipment: pH meter
1) Submerge electrode with temperature probe in the sample of wash solution (turn the meter on first). Stir for a few seconds.
2) Allow the readings to stabilize (a minute or so) and record the results. The measurement of the pH of a solution is dependant on the temperature of the solution. This is why whenever pH is measured the temperature must be included.
Most pH meters will compensate for temperature automatically. The temperature probe must be positioned as close as possible to the pH probe for accuracy reasons. The standard reference temperature for calibration etc. is 25 C.
Figure 8: pH meter
25 3.5.4 Turbidity
Equipment: Turbidity meter
Figure 9 : Turbidity Meter
1. Prepare the turbidity meter for use according to the manufacturer's directions.
2. Use the turbidity standards provided with the meter to calibrate it. Make sure it is reading accurately in the range in which you will be working.
3. Shake the sample vigorously and wait until the bubbles have disappeared. You might want to tap the sides of the bottle gently to accelerate the process.
4. Use a lint-free cloth to wipe the outside of the tube into which the sample will be poured. Be sure not to handle the tube below the line where the light will pass when the tube is placed in the meter.
5. Pour the sample water into the tube. Wipe off any drops on the outside of the tube.
6. Set the meter for the appropriate turbidity range. Place the tube in the meter and read the turbidity measurement directly from the meter display.
7. Record the result on the field or lab sheet.
8. Repeat steps 3-7 for each sample.
26 3.5.5 Conductivity
Equipment: Conductivity meter
Figure 10 : Conductivity Meter
1. Prepare the conductivity meter for use according to the manufacturer's directions.
2. Use a conductivity standard solution (usually potassium chloride or sodium chloride) to calibrate the meter for the range that you will be measuring. The manufacturer's directions should describe the preparation procedures for the standard solutio n.
3. Rinse the probe with distilled or deionized water.
4. Select the appropriate range beginning with the highest range and working down.
Read the conductivity of the water sample. If the reading is in the lower 10 percent of the range, switch to the next lower range. If the conductivity of the sample ex ceeds the range of the instrument, you may dilute the sample. Be sure to perform the dilution according to the manufacturer's directions because the dilution might not have a simple linear relationship to the conductivity.
5. Rinse the probe with distilled or deionized water and repeat step 4 until finished.
27 4.0 RESULTS AND DISCUSSION
4.1 Results of groundwater quality from selected tubewells in Kg. Puteh Groundwater Treatment, Kelantan.
4.1.1 Combine Well
Minerals Conc. Equiv./L Meq/L
Ca 19.700 20.000 0.985
Mg 10.100 12.150 0.831
Na 4.965 23.000 0.216
K 4.869 39.000 0.125 Hardness 90.43 as CaC03 mg/L
Total 2.157 Turbidity 11 NTU
HCO3 115.000 61.000 1.885 TDS 82mg/L
SO4 2.593 48.000 0.054 Color 20 CU
Cl 2.862 35.500 0.080 pH 6.7
Total 2.020 Conductivity 164µS/cm
Percent Error % 6.786808
Ca2+ Mg2+ Na+
HCO3-
SO42-
Cl-
0 0.985 1.816 2.032
1.88 5
1.939 2.019
28 4.1.2 Well 2(shallow well)
Minerals Conc. Equiv./L Meq/L
Ca 14.700 20.000 0.735
Mg 19.900 12.150 1.638
Na 5.083 23.000 0.221
K 3.040 39.000 0.078 Hardness 118.39 as CaCO3 mg/L
Total 2.672 Turbidity 4 NTU
HCO3 130.000 61.000 2.131 TDS 72.5mg/L
SO4 10.815 48.000 0.225 Color 24 CU
Cl 4.333 35.500 0.122 pH 6.4
Total 2.479 Conductivity 145µS/cm
Percent Error % 7.798938
Ca2+ Mg2+
Na+
HCO3-
SO42-
Cl-
2.373 2.594 0.735
0
2.131 2.356 2.478
29 4.1.3 Well 3(deep well)
Minerals Conc. Equiv./L Meq/L
Ca 9.300 20.00 0.465
Mg 11.400 12.150 0.938
Na 4.908 23.000 0.213
K 5.939 39.000 0.152 Hardness 69.99 as CaCO3 mg/L
Total 1.769 Turbidity 114 NTU
HCO3 97.000 61.000 1.590 TDS 75mg/L
SO4 0.077 48.000 0.001 Color 85 CU
Cl 1.273 35.500 0.036 pH 6.2
Total 1.628 Conductivity 150µS/cm
Percent Error % 8.681154
Ca2+ Mg2+
Na+
HCO3-
SO42-
Cl-
0 0.46
5
1.40 3
1.616
1.590 1.591 1.62 7
30 4.1.4 Well 18(shallow well)
Minerals Conc. Equiv./L Meq/L
Ca 5.400 20.000 0.270
Mg 11.200 12.150 0.922
Na 4.862 23.000 0.211
K 6.203 39.000 0.159 Hardness 59.51 as CaCO3 mg/L
Total 1.562 Turbidity 40 NTU
HCO3 82.000 61.000 1.344 TDS 82.5mg/L
SO4 3.995 48.000 0.083 Color 52 CU
Cl 0.921 35.500 0.026 pH 6
Total 1.453 Conductivity 165µS/cm
Percent Error % 7.484736
Ca2+
Mg2+ Na+
HCO3-
SO42- Cl-
0 0.270 1.192 1.403
1.427
1.344 1.45
3
31
4.2 Electrochemical Precipitation Results on Synthetic Hardwater
The calcium and magnesium hardness is the concentration of calcium and magnesium ions expressed as equivalent of calcium carbonate. The molar mass of CaCO3, Ca2+ and Mg2+ are respectively 100,1 g/mol, 40,1 g/mol and 24,3 g/mol.The ratio of the molar masses are:
So total permanent water hardness expressed as equivalent of CaCO3 can be calculated with the following formula:
4.2.1 Electrode Spacing Parameter
As shown in Figure below, the results indicated the residual of hardness concentration after using Al electrode at different distance (1, 2, 3 and 4 cm).
0.00 200.00 400.00 600.00 800.00 1000.00 1200.00 1400.00
0 30 60 90 120 150 180 210 240
Hardness concentration (mg/L)
Time (min)
4 cm 3 cm 2 cm 1 cm
32
At a distance of 4 cm, the removal efficiency was low compared to the distance of 3, 2 and 1 cm. However, at 2 cm distance between the electrodes, the hardness concentration was reduced tremendously.
4.2.2 Applied Voltage Parameter
A result on effect applied voltages on hardness removal is shown in Figure below.
The figure indicated various volts were used to determine the removal efficiency of hardness concentration at 1400 mg/L with surface area of 20 cm2.
The increase of electrical volt, the removal efficiency of hardness increase. The oxidized aluminium increase rapidly and generate more hydroxyl ion leads to make hardness concentration reduce fast. In results, the quickest hardness reduced and removed by precipitation after 240 minutes of the process. These results suggest 20 V is an optimal electrical potential for continuous treatment.
0.00 200.00 400.00 600.00 800.00 1000.00 1200.00 1400.00
0 30 60 90 120 150 180 210 240
Hardness concentration (mg/L)
Time (min)
5 volts 8 volts 12 volts 15 volts 20 volts
33
4.3 Electrochemical Precipitation Results on Groundwater from Tubewell in Kampung Puteh Water Treatment Plant, Kelantan.
By using the optimum voltage and distance between electrodes which are 20V and 2cm respectively, a result on effect of batch volume on hardness removal is shown in Figure below. The figure indicated batch volume of 200mL and 5000mL were used to determine removal efficiency of hardness concentration at 118.34 mg/L with surface area 20 cm2.
The removal of hardness by using batch volume of 200mL is greater than 5000mL. The removal efficiency of batch of 200mL is 72.18% while the batch of 5000mL is 17.25%.
0.00 20.00 40.00 60.00 80.00 100.00 120.00 140.00
0 30 60 90 120 150 180 210 240
Hardness concentration (mg/L)
Time (min)
200mL 5000mL
34
5.0 CONCLUSION AND RECOMMENDATION 5.1 Conclusion
Hardness in groundwater can be reduced by electrocoagulation process. In this research, moderately hard groundwater from tube well 2 of intial hardness 118.34mg/L could be reduced to 52.17mg/L within one hour by using current density of 20V/20mm2 and electrode spacing of 2cm. The production rate was 200mL/hour. This rate of production is considered appropriate only for drinking water supply.
5.2 Recommendation
Electrocoagulation is a suitable method to be used to treat hardwater for drinking water supply since it requires no chemical usage and does not require supervision from an expertise. In this research, it has been identified that removal efficiency in a smaller scale is more effective than a larger scale volume. It is suggested that the number of electrodes should be added in order to provide larger surface area for the magnesium and calcium precipitation to occur. Further research should be carried out to find the most effective method to remove water hardness in a large scale volume for drinking water supply as well as for industrial purpose.
35 REFERENCES
[1] S. C. Low, C. Liping, L. Seng Hee, (2008) Water softening using a generic low cost nano filtration membrane, Desalination 221 168-173.
[2] B. Van der Bruggen, (2001) et al., Application of nano-filtration for removal of pesticides, nitrate and hardness from groundwater: rejection properties and economic evaluation, Journal of Membrane Science193 239-248.
[3] S. Verissimo, (2006) et al., Influence of the diamine structure on the nano- filtration performance, surface charge of the composite polyamide membranes, Journal of Membrane Science 279 266-275.
[4] J. Saurina, (2002) et al., Determination of calcium and total hardness in natural waters using potentiometric sensor array, Analytica Chimica Acta 464 89-98.
[5] A. F. Viero, (2002) et al., Removal of Hardness and COD from retanning treated effluent by membrane process, Desalination 149 145-149.
[6] P. Pentamwa, W. Thipthara, S. Nuangon, (2011) Removal of Hardness from Groundwater by Synthetic Resin from Waste Plastics, International Journal of Environment Science and Development, Vol. 2 No. 6
[7] E. Ildiz, (2003) et al., Water softening in a cross flow membrane reactor, Desalination 159 139-152.
[8] M. H. Entezari, M. Tahmasbi, (2009) Water Softening by Combination of ultrasound and ion exchange, Ultrasonic Sono-chemistry 16 356-360.
[9] M. Soltanieh, M. Mousavi, (1999) Application of charged membranes in water softening: modeling and experiments in the presence of poly-electrolytes, Journal of Membrane Science 154 53-60.
[10] N. Kabay, (2002) et al., Removal of calcium and magnesium hardness by electro- dialysis, Desalination 149 343-349.
36
[11] M. Malakootian, N. Yousefi, (2009) The Efficiency of Electro-coagulation Process Using Aluminium Electrodes in Removal of Hardness from Water, Iran.
J. Environ. Health Sci. Eng., vol. 6, pp. 131-136.
[12] J. Kobayashi, (1957) et al., On geographical relationship between the chemical nature of river water and death rate from apoplexy 11 12-21.
[13] I. B. Abbes, S. Bayoudh, M. Baklouti, (2008) The removal of hardness of water using sulfonated waste plastic, Desalination 222 81-86.
[14] N. Kabay, M. Demircioglu, E. Ersiiz, I. Kurucaovali, (2002) Removal of calcium and magnesium hardness by electro-dialysis, Desalination 149, 343-349.
[15] J. Schaep, (1998) et al., Removal of hardness from groundwater by nano-filtration , Desalination 119, 295-302.
[16] R. M. Touyz, (2003) “Role of magnesium in the pathogenesis of hypertension,”
Molecular Aspects of Medicine, vol. 24, pp. 107-136.
[17] K. W. Muir, (2000) “Therapeutic potential of magnesium in the treatment of acute stroke,” Journal of Stroke and Cerebrovascular Disease, vol. 9, pp. 257-267.
[18] J. Crowther, (1988) “Magnesium and Calcium in carbonate bedrock and groundwaters, Peninsular Malaysia, “Journal of Southeast Asian Sciences, vol. 2, pp. 189-200.
[19] J. C. Van Moort, (1973) “The magnesium and calcium contents of sediments, especially pelites, as a function of age and degree of metamorphism, “Chemical Geology, vol. 12, pp. 1-37.
[20] K. Anne, “Magnesium and Calcium in Drinking Water and Heart Diseases, “in Encyclopedia of Environmental Health, O. N. Editor-in-Chief: Jerome, Ed,. Ed Burlington:Elsevier, 2011, pp. 535-544.
37
[21] C.Y. Yang and H. F. Chiu, (1999) “Calcium and magnesium in drinking water and the risk of death from hypertension, “American Journal of Hypertension, vol.
12, pp. 894-899.
[22] S. H. Yoon, (1998) et al., “Effect of calcium ion on the fouling of nanofilter by humic acid in drinking water production, “Water Research, vol. 32, pp. 2180- 2186.
[23] B. D. Marshall and D. J. DePaolo, (1989) “Calcium isotopes in igneous rocks and the origin of granite,” Geochimica et Cosmochimica Acta, vol. 53, pp. 917-922.
[24] J. Hanley, (2011) et al., “Interaction of magmatic fluids and silicate melt residues with saline groundwater in the footwall of the Sudbury Igneous Complex, Ontario, Canada:New evidence from bulk rock geochemistry, fluid inclusions and stable isotopes,” Chemical Geology, vol. 281, pp. 1-25.
[25] G. M. Davis and P. Horswill, (2002) “Groundwater control and stability in an excavation in Magnesian Limestone near Sunderland, NE England,” Engineering Geology, vol.66, pp. 1-18.
[26] T. M. Missimer, (1994) “Water Supply Development for Membrane Water Treatment Processes”, Lewis Publ., Boca Raton.
[27] S. Kawamura, (2000) “Integrated Design and Operations of Water Treatment Facilities,” John Wiley & Sons, pp. 510-523.
[28] G. Gasco and A. Mendez, (2005) “Sorption of Ca2+, Mg2+, Na+ and K+ by Clay Minerals,” Desalination 182, pp. 333-338.
[29] R. B. Ramesh, (2007) “Treatment of Tannery Wastewater by Electro- coagulation,” Journal of University Chemical Technology and Metallurgy, 42 (2), pp. 201-206.
[30] O. Degremond, (2002) “Handbook of Water Treatment, 6nd edition, Lavoisier Wiley Publications, Chapter 2.
38
[31] E. Bazrafshan (2008) et al., “Performance Evaluation of Electro-coagulation Process for Removal of Chromium Solutions Using Iron and Aluminium Electrodes”, Turkish J. Eng. Env Sci, 32, pp. 59-66.
[32] J. S. Park, J. H. Yeon and K. H. Moon (2007) “Removal of Hardness Ions from Tap Water Using Electro Membrane Processes, Desalination 202, pp. 1-8.
[33] K. Walha, R. B. Amar, F. Quemeneur, P. Jaouen (2008) “Treatment by Nano Filtration and Reverse Osmosis of High Salinity Drilling Water for Seafood Washing and Processing, Desalination 219, pp. 231–239.
[34] Y. Xiong (2001) et al., “Treatment of Dye Wastewater Containing Acid Orange II Using a Cell with Three-phase Three-dimensional Electrode, Water Research , 35 (17): 4226-4230.
[35] P. Daida (2005) “Removal of Arsenic from Water by Electro Coagulation Using Al – Al , Fe – Fe Electrode Pair Systems and Characterization of by Product , UMI Microform ,1 – 68.
[36] T. K. Kim, E. B. Shin, S. Kim (2002) “Decholorization of Disperse and Reactive Dyes by Continuous Electro Coagulation Process, Desalination, 150: 165-175.
39 APPENDICES
Distance Parameters Test on Synthetic Hardwater Distance 4 cm
Volt 2
Conc. 748.4mg/L
Time Conc
Avr. (Ca)
Conc Conc
Avr.(Mg)
Conc Hardness (CaCO3)
Surface area (cm2) 0
300.00
300.00
150.00
150.00 1365.00
20
300.00 150.00
300.00 150.00
30
410.00
408.00
76.00
76.33 1332.97
20
408.00 74.00
406.00 79.00
60
363.00
361.33
90.00
88.33 1265.50
20
361.00 89.00
360.00 86.00
90
345.00
342.67
90.00
95.33 1247.53
20
343.00 96.00
340.00 100.00
120
335.00
337.67
98.00
99.00 1250.07
20
338.00 100.00
340.00 99.00
150
360.00
357.33
80.00
81.67 1228.17
20
357.00 82.00
355.00 83.00
180
382.00
380.33
63.00
60.67 1199.57
20
380.00 60.00
379.00 59.00
210
350.00
345.33
81.00
81.00 1195.43
20
346.00 82.00
340.00 80.00
240
340.00
341.00
72.00
72.00 1147.70
20
341.00 74.00
342.00 70.00
40 Distance 3 cm
Volt 2
Conc. 748.4mg/L
Time Conc
Avr. (Ca)
Conc Conc
Avr.(Mg)
Conc Hardness (CaCO3)
Surface area (cm2) 0
300.00
300.00
150.00
150.00 1365.00
20
300.00 150.00
300.00 150.00
30
246.00
246.00
75.00
77.00 930.70
20
247.00 77.00
245.00 79.00
60
210.00
209.00
70.00
71.67 816.33
20
209.00 72.00
208.00 73.00
90
234.00
234.00
65.00
64.00 847.40
20
233.00 63.00
235.00 64.00
120
212.00
213.67
65.00
64.00 796.57
20
214.00 64.00
215.00 63.00
150
258.00
259.00
52.00
51.00 856.60
20
259.00 51.00
260.00 50.00
180
250.00
248.00
50.00
51.33 830.47
20
248.00 51.00
246.00 53.00
210
234.00
232.33
50.00
52.00 794.03
20
230.00 52.00
233.00 54.00
240
219.00
218.00
58.00
54.67 769.13
20
218.00 55.00
217.00 51.00
41 Distance 2 cm
Volt 2
Conc. 748.4mg/L
Time Conc
Avr. (Ca)
Conc Conc
Avr.(Mg)
Conc Hardness (CaCO3)
Surface area (cm2) 0
300.00
300.00
150.00
150.00 1365.00
20
300.00 150.00
300.00 150.00
30
280.00
281.00
110.00
108.00 1145.30
20
281.00 108.00
282.00 106.00
60
190.00
187.67
66.00
66.00 739.77
20
188.00 67.00
185.00 65.00
90
213.00
213.00
50.00
52.67 748.43
20
215.00 53.00
211.00 55.00
120
188.00
186.33
35.00
33.00 601.13
20
186.00 33.00
185.00 31.00
150
160.00
156.00
49.00
50.33 596.37
20
156.00 50.00
152.00 52.00
180
230.00
231.33
29.00
26.00 684.93
20
231.00 26.00
233.00 23.00
210
258.00
256.00
49.00
46.00 828.60
20
256.00 46.00
254.00 43.00
240
211.00
212.67
33.00
31.00 658.77
20
212.00 31.00
215.00 29.00
42 Distance 1 cm
Volt 2
Conc. 748.4mg/L
Time Conc
Avr. (Ca)
Conc Conc
Avr.(Mg)
Conc Hardness (CaCO3)
Surface area (cm2) 0
300.00
300.00
150.00
150.00 1365.00
20
300.00 150.00
300.00 150.00
30
352.00
352.33
113.00
116.00 1356.43
20
350.00 116.00
355.00 119.00
60
280.00
281.00
110.00
108.00 1145.30
20
281.00 108.00
282.00 106.00
90
349.00
351.00
82.00
82.00 1213.70
20
351.00 80.00
353.00 84.00
120
302.00
305.00
88.00
89.00 1127.40
20
305.00 89.00
308.00 90.00
150
355.00
357.00
68.00
70.00 1179.50
20
357.00 70.00
359.00 72.00
180
371.00
368.00
54.00
56.00 1149.60
20
368.00 56.00
365.00 58.00
210
352.00
350.00
66.00
68.00 1153.80
20
350.00 68.00
348.00 70.00
240
305.00
307.00
61.00
59.00 1009.40
20
309.00 59.00
307.00 57.00
43 Voltage Parameter Test on Synthetic Hardwater
Distance 2 cm
Volt 5
Conc. 748.4mg/L
Time Conc
Avr. (Ca)
Conc Conc
Avr.(Mg)
Conc Hardness (CaCO3)
Surface area (cm2) 0
300.00
300.00
150.00
150.00 1365.00
20
300.00 150.00
300.00 150.00
30
220.00
221.33
56.00
58.00 791.13
20
221.00 58.00
223.00 60.00
60
246.00
246.00
65.00
67.00 889.70
20
244.00 69.00
248.00 67.00
90
240.00 240.00 42.00 42.00 772.20 20
238.00 40.00
242.00 44.00
120
170.00
170.00
71.00
71.33 717.47
20
169.00 73.00
171.00 70.00
150
170.00
170.00
61.00
58.00 662.80
20
169.00 55.00
171.00 58.00
180
170.00
170.00
56.00
56.33 655.97
20
169.00 55.00
171.00 58.00
210
220.00
220.00
22.00
21.00 636.10
20
219.00 20.00
221.00 21.00
240
208.00
208.00
18.00
16.00 585.60
20
210.00 14.00
206.00 16.00